. 2023 Sep 18;6(1):950.
doi: 10.1038/s42003-023-05328-6.

Positive and biphasic extracellular waveforms correspond to return currents and axonal spikes

Affiliations

Positive and biphasic extracellular waveforms correspond to return currents and axonal spikes

Shirly Someck et al. Commun Biol. .

Abstract

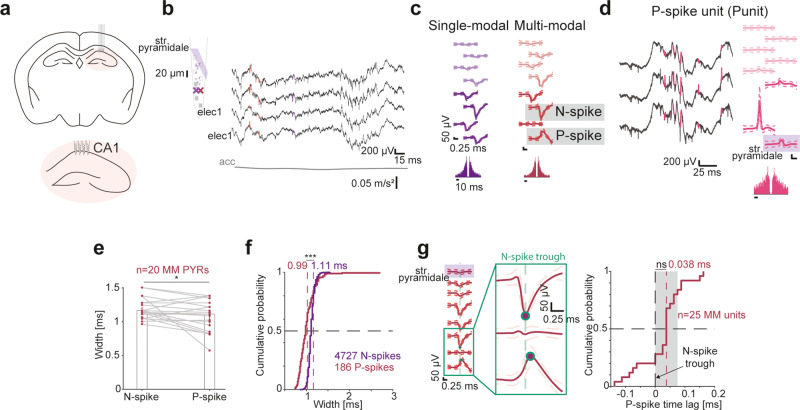
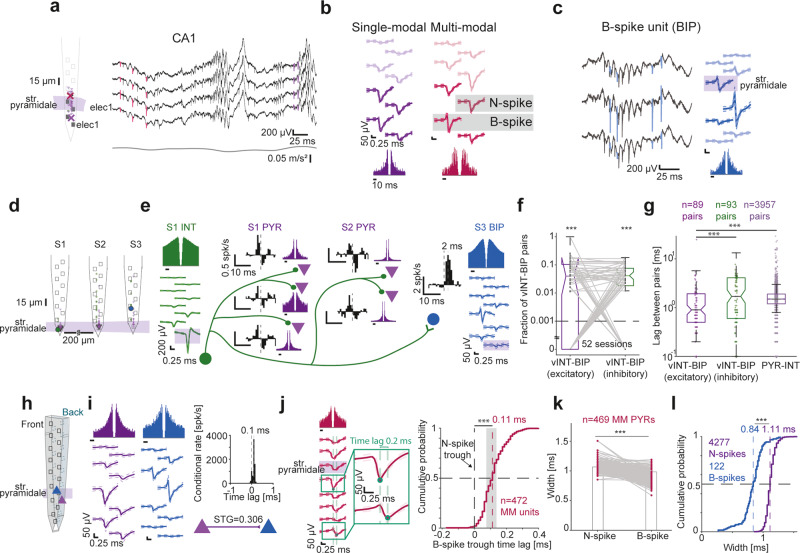
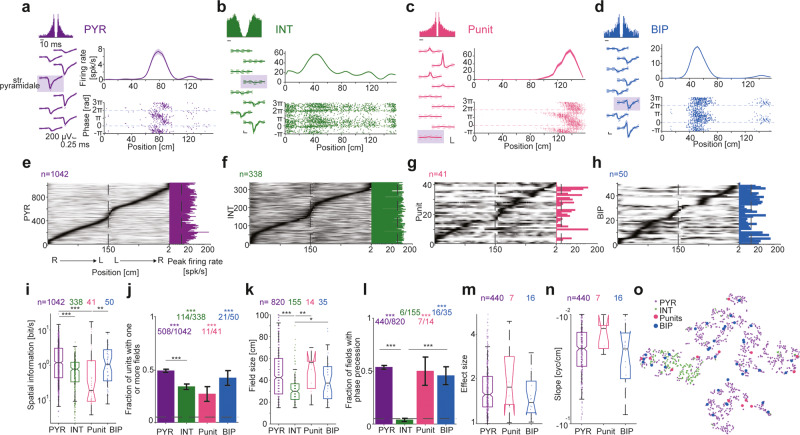
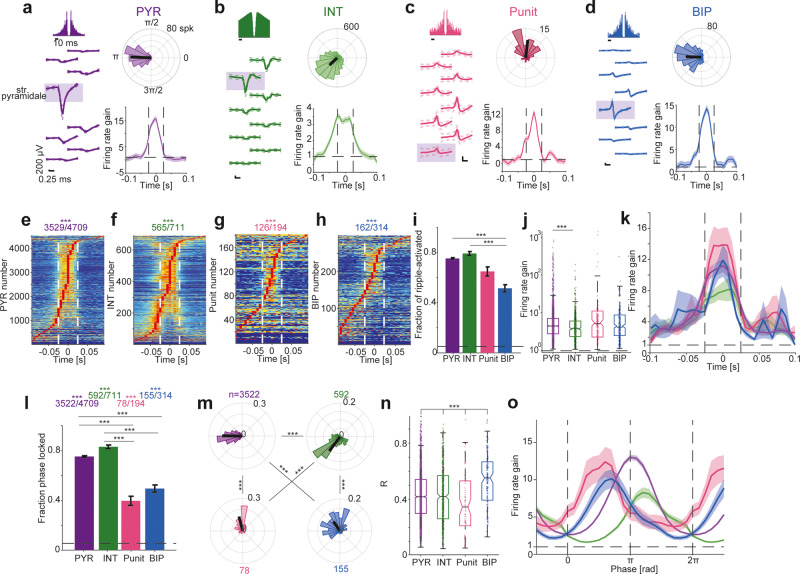
Multiple biophysical mechanisms may generate non-negative extracellular waveforms during action potentials, but the origin and prevalence of positive spikes and biphasic spikes in the intact brain are unknown. Using extracellular recordings from densely-connected cortical networks in freely-moving mice, we find that a tenth of the waveforms are non-negative. Positive phases of non-negative spikes occur in synchrony or just before wider same-unit negative spikes. Narrow positive spikes occur in isolation in the white matter. Isolated biphasic spikes are narrower than negative spikes, occurring right after spikes of verified inhibitory units. In CA1, units with dominant non-negative spikes exhibit place fields, phase precession, and phase-locking to ripples. Thus, near-somatic narrow positive extracellular potentials correspond to return currents, and isolated non-negative spikes correspond to axonal potentials. Identifying non-negative extracellular waveforms that correspond to non-somatic compartments during spikes can enhance the understanding of physiological and pathological neural mechanisms in intact animals.


Conflict of interest statement

The authors declare no competing interests.

Figures

Fig. 1
Fig. 1. Positive extracellular spikes correspond to return currents.
a Multi-shank recording array in hippocampal CA1 region. b Left, Schematic shank with 13 simultaneously-recorded units in CA1 of a freely-moving mouse. Str. pyramidale is in the top electrode. X marks correspond to the units depicted in (c). Right, Wideband (0.1–7,500 Hz) traces recorded by four adjacent electrodes. acc, head acceleration. c Single-modal (SM) and multi-modal (MM) units recorded simultaneously from CA1. Wideband spike waveforms and auto-correlation histograms (ACHs) of the SM pyramidal cell (PYR), and of the MM PYR with a negative spike (N-spike) and a positive spike (P-spike). d Positive unit (Punit) in extracellular recordings from CA1. A Punit is defined as a unit with a dominant positive peak in the main channel waveform. e P-spikes are narrower than same-unit N-spikes. Spike width, inverse of the dominant frequency of the waveform spectrum. MM PYRs with P-spikes and MM Punits are included. *p < 0.05, Wilcoxon’s test. f P-spikes of SM Punits are narrower than N-spikes of SM PYRs or MM PYRs with B-spikes. ***p < 0.001, U-test. g Same-unit N- and P-spikes unit occur in near synchrony. Left, The peak of the P-spike of a MM PYR occurs simultaneously with the N-spike trough. Right, The median time lag between N- and P-spikes in CA1 MM units is not consistently different from zero. ns, p > 0.05, Wilcoxon’s test comparing to a zero null. Gray patch, 95% confidence limits.
Fig. 2
Fig. 2. Biphasic extracellular spikes correspond to axonal potentials.
a Left, Schematic shank with 32 simultaneously-recorded units in CA1 of a freely-moving mouse. Right, Wideband traces. All conventions here and in (b) are the same as in Fig. 1b, c. b Waveforms and ACHs of an SM PYR and an MM unit with biphasic spikes (B-spikes) recorded simultaneously from CA1. c B-spikes can appear without N-spikes. A biphasic unit (BIP) is defined as a unit with a dominant positive peak preceding a dominant negative peak in the main channel waveform. d, e A BIP exhibiting “monosynaptic excitation” by a verified inhibitory interneuron (vINT). d Probe schematic in CA1. e Derived network of a vINT, BIP, and five PYRs. Cross-correlation histograms (CCHs) show that the vINT is inhibitory for the five PYRs. However, the vINT-BIP CCH exhibits an “excitatory” monosynaptic peak, which can be accounted for by violation of Dale’s law or by a separate compartment of the vINT. Note similar vINT and BIP ACHs. f Fraction of vINT-BIP excitatory and vINT-BIP inhibitory connections in every session. Lined *p < 0.05, Wilcoxon’s test. Dashed line, chance level; ***p < 0.001, Binomial test comparing to chance level. Every box plot shows median and interquartile range (IQR), whiskers extend for 1.5 times the IQR in every direction, and a plus indicates an outlier. g Time lags for vINT-BIP excitatory connections, vINT-BIP inhibitory connections, and PYR-INT excitatory connections. Lined **/***p < 0.01/p < 0.001, U-test. h, i CA1 PYR-BIP pair recorded from opposite sides of a 30 μm dual-sided probe. The spike transmission gain (STG) corresponds to a 0.3 of a BIP spike occurring after a PYR spike. Transmission peaks at a sub-millisecond, one-sided time lag. j Time lag of B-spike trough relative to same-unit N-spike trough. ***p < 0.001, Wilcoxon’s test compared to zero. All other conventions are the same as in Fig. 1g. k B-spikes are narrower than same-PYR N-spikes. ***p < 0.001, Wilcoxon’s test. l B-spikes of SM BIPs are narrower than N-spikes of SM PYRs or MM PYRs with P-spikes. ***p < 0.001, U-test.
Fig. 3
Fig. 3. Neocortical non-negative extracellular spikes correspond to return currents and axonal potentials.
a Multi-shank recording array in the parietal cortex. b Punit in extracellular recordings from the neocortex. c MM units are more prevalent in CA1 than in the neocortex. Dataset includes 3189 neocortical units from n = 17 mice and 5971 CA1 units from n = 9 mice. Here and in (d) and (e), ***p < 0.001, G-test; error bars, SEM. d Units with P-spikes are more prevalent in the neocortex than in CA1. e The fraction of units with B-spikes is higher in CA1 than in the neocortex. f, g P- and B-spikes are narrower than same-PYR N-spikes in neocortex. **/***p < 0.01/p < 0.001, Wilcoxon’s test. h, i P-spikes and B-spikes of neocortical SM Punits and BIPs, respectively, are narrower than N-spikes of SM PYRs or MM PYRs with P-/B-spikes. ***p < 0.001, U-test. j The median time lag between N- and P-spikes in neocortical MM units is not consistently different from zero. ns, p > 0.05, Wilcoxon’s test comparing to a zero null. Here and in (k) conventions are the same as in Fig. 1g. k Time lag of B-spike trough relative to same-unit N-spike trough. ***p < 0.001, Wilcoxon’s test compared to zero. l Fraction of vINT-BIP excitatory and vINT-BIP inhibitory connections in every session. Lined *p < 0.05, Wilcoxon’s test; **/***p < 0.01/p < 0.001, Binomial test comparing to chance level (dashed line). Box plot conventions are the same as in Fig. 2f. m Time lags for vINT-BIP excitatory connections, vINT-BIP inhibitory connections, and PYR-INT excitatory connections. Lined */***p < 0.05/ p < 0.001, U-test. n, o Neocortical PYR-BIP pair recorded from opposite sides of a 30 μm dual-sided probe. Spike transmission gain (STG) is close to unity. Transmission peaks at a sub-millisecond, one-sided time lag.
Fig. 4
Fig. 4. Positive phases of biphasic extracellular spikes correspond to return currents.
a Computation of B-spike peak lag relative to the trough of the N-spike in the same MM unit. b, c Distance of B-spike from N-spike vs. lag of B-spike peak from N-spike trough. Distances are positive when the B-spike is closer to the surface of the brain. Cartoons illustrate the orientation of PYR soma, dendritic tree, and axon. Here and in (c), cc, rank correlation coefficient; **/***p < 0.01/p < 0.001, permutation test. The negative correlation in the neocortex (and the positive correlation in CA1) are consistent with the B-spike peaks near the soma and most proximal dendrites representing return currents during AIS spikes, and B-spike peaks near more distal dendrites representing return currents during somatic spikes. d, e Biphasic index (BPI) vs. distance between B- and N-spikes. The increasingly-positive BPIs farther from the N-spike (significant in CA1) are consistent with return currents forming a wavefront that propagates in space before the N-spike.
Fig. 5
Fig. 5. BIPs and Punits exhibit place fields and phase precession.
ad Units recorded in CA1 as mice ran back and forth on a 150 cm long linear track. In (ad): Left, Wideband waveforms and ACH. Top, Firing rate as a function of position (mean ± SEM over 82/96/70/41 same-direction trials of PYR/INT/Punit/BIP). Bottom, Instantaneous theta phase of every spike. Phase 0 corresponds to theta peak. eh Units of all four types exhibit increased firing rates at specific regions of the linear track. Every row represents a unit. Firing rates on right (R) to left (L) runs are concatenated with L to R runs and scaled to the 0 (white) to 1 (black) range. ik Spatial rate coding of CA1 units. i Spatial information carried by the units. Top, number of units active and stable on the track. Here and in (k), */**/***p < 0.05/p < 0.01/p < 0.001, Kruskal–Wallis test, corrected for multiple comparisons. Box plot conventions are the same as in Fig. 2f. j Fraction of units with one or more place fields. Here and in (l), ***p < 0.001, Binomial test, comparing to chance level of 0.05; lined ***p < 0.001, G-test; error bars, SEM. k Place field sizes. ln Spatial phase coding of CA1 units. l Fraction of fields with theta phase precession. m Phase precession effect sizes. n Phase precession slopes. o t-SNE projection of all fields. Sample size is the same as (k). Features includes are spatial information, field size, in-field gain, TPP effect size, and TPP slope.
Fig. 6
Fig. 6. In CA1, Punits and BIPs occur outside str. pyramidale.
a Linear recording array in the neocortex and CA1. b Wideband traces recorded by the 32-electrode array in a freely-moving mouse. Vertical inter-electrode spacing is 20 µm. A ripple event peaks at elec11, corresponding to the center of str. pyramidale. c Traces from the same session showing multiple spike events, including a PYR in str. pyramidale (elec8-11), a SM Punit in the white matter (elec25), and a neocortical PYR (elec30-31). d Depth distribution of PYRs, INTs, Punits, and BIPs in CA1. Zero depth corresponds to the center of CA1 str. pyramidale. Bin size is 20 µm. Here and in (e, f), horizontal dashed lines indicate the center of the layer. e Same as (d), with the absolute numbers scaled to fractions at every depth. f The depth distribution of non-negative units is distinct from the depth distribution of PYRs in CA1. ***p < 0.001, Kolmogorov–Smirnov test. Box plot conventions are the same as in Fig. 2f.
Fig. 7
Fig. 7. Punits and BIPs precede PYRs and INTs in ripple lock in CA1.
ad Units with non-negative waveforms exhibit time-locking to ripple events. Example ripple-locked CA1 PYR, INT, Punit, and BIP. Left, Wideband spike waveforms and ACHs. Top right, Ripple phase during every spike, binned into 20 equal-sized bins. Black line represents the mean phase and the resultant length. Bottom right, Firing rate gain as a function of time in ripple. Here and in (eh), vertical dashed lines indicate mean ripple time range. eh Punits and BIPs exhibit increased firing rates during ripple events. Ripple-triggered firing rate histograms of all CA1 units. For presentation purposes, firing rates are scaled to the 0 (blue) to 1 (red) range. ***p < 0.001, Binomial test comparing to chance level, 0.05. i The fraction of BIPs with firing rate gain above 1 during ripple events. Here and in (l), lined ***p < 0.001, G-test, corrected for multiple comparisons; error bars, SEM. Vertical dashed lines indicate chance level, α = 0.05. j Firing rate gain during ripples. Here and in (n), ***p < 0.001, Kruskal–Wallis test. Box plot conventions are the same as in Fig. 2f. k Gain as a function of time in ripple. Here and in (o), shading shows SEM. lo Phase-locked Punits and BIPs precede PYRs and INTs in ripple events. l The fraction of phase-locked units. m Punits and BIPs spike earlier on the ripple cycle compared to PYRs and INTs. ***p < 0.001, Wheeler–Watson test. n Resultant lengths of ripple phase, indicating lock strength. o Gain as a function of phase in ripple.

Similar articles

Cited by

References

    1. Adrian ED, Moruzzi G. Impulses in the pyramidal tract. J. Physiol. 1939;97:153–199. - PMC - PubMed
    1. Steinmetz NA, et al. Neuropixels 2.0: a miniaturized high-density probe for stable, long-term brain recordings. Science. 2021;372:eabf4588. - PMC - PubMed
    1. Tranchina D, Nicholson C. A model for the polarization of neurons by extrinsically applied electric fields. Biophys. J. 1986;50:1139–1156. - PMC - PubMed
    1. Buzsáki G, Anastassiou CA, Koch C. The origin of extracellular fields and currents — EEG, ECoG, LFP and spikes. Nat. Rev. Neurosci. 2012;13:407–420. - PMC - PubMed
    1. Einevoll GT, Kayser C, Logothetis NK, Panzeri S. Modelling and analysis of local field potentials for studying the function of cortical circuits. Nat. Rev. Neurosci. 2013;14:770–785. - PubMed

Publication types

Grants and funding