. 2023 Nov;15(11):1549-1558.
doi: 10.1038/s41557-023-01329-4. Epub 2023 Sep 18.

Mapping protein dynamics at high spatial resolution with temperature-jump X-ray crystallography

Affiliations

Mapping protein dynamics at high spatial resolution with temperature-jump X-ray crystallography

Alexander M Wolff et al. Nat Chem. 2023 Nov.

Abstract

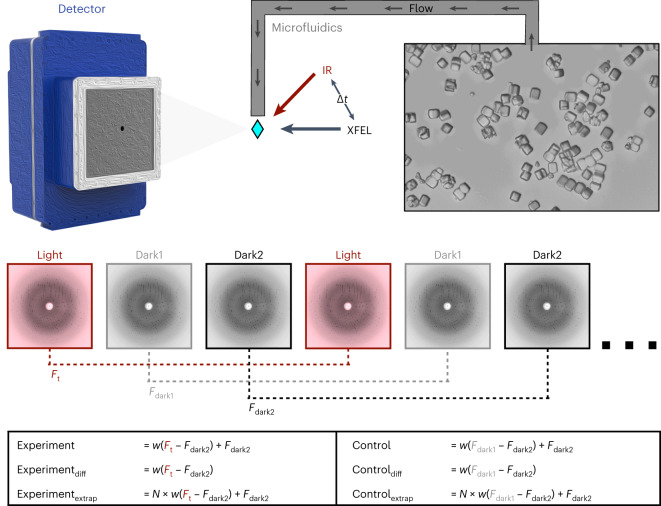
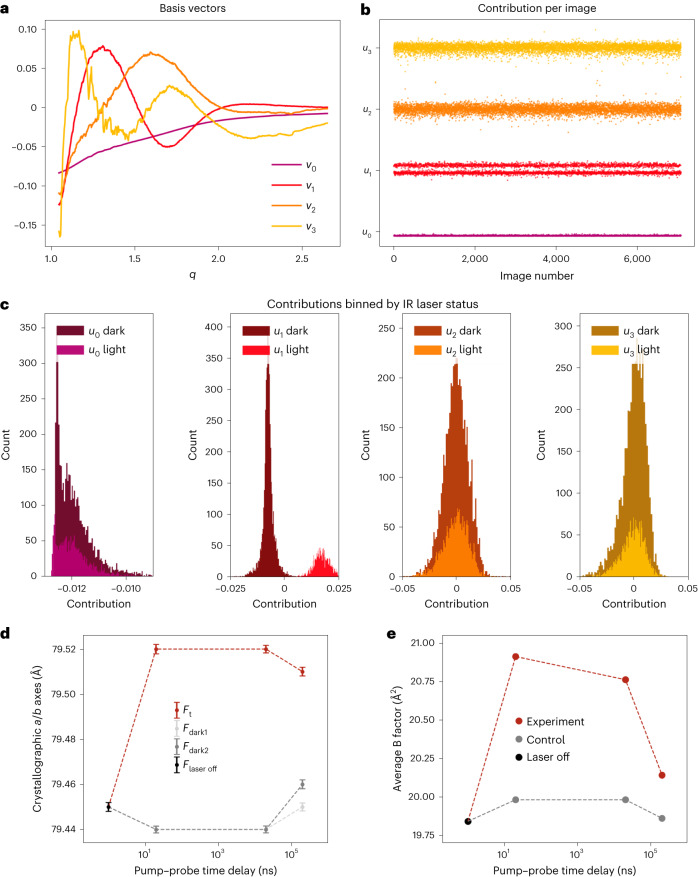
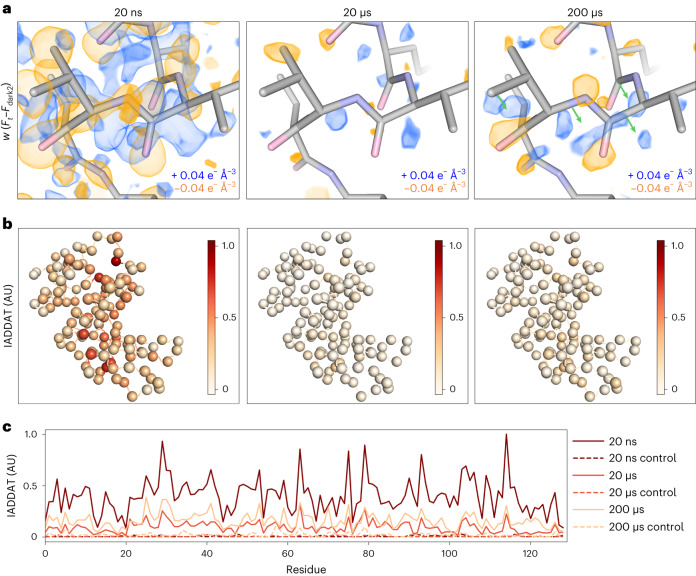
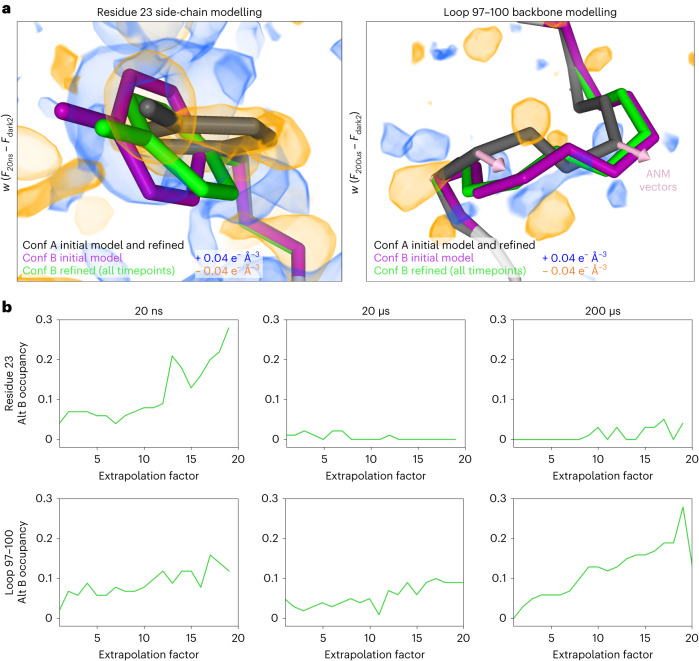
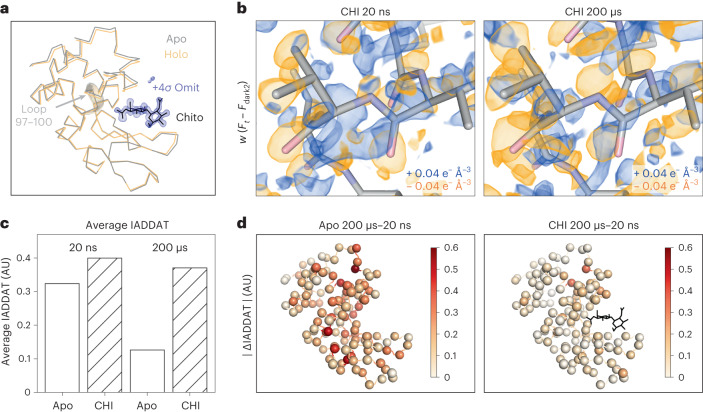
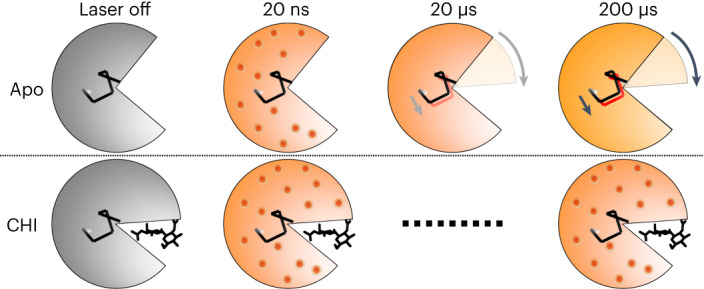
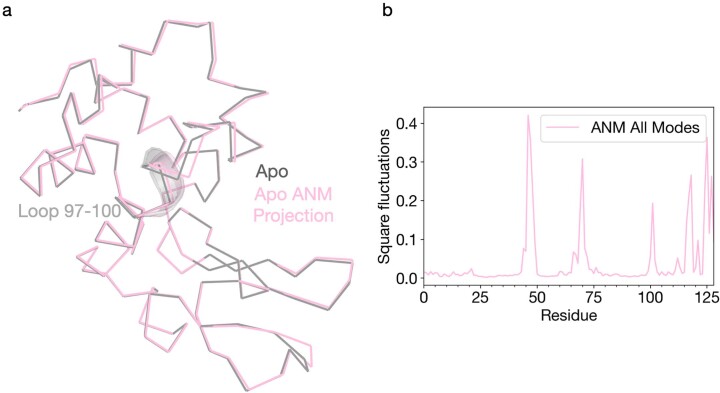
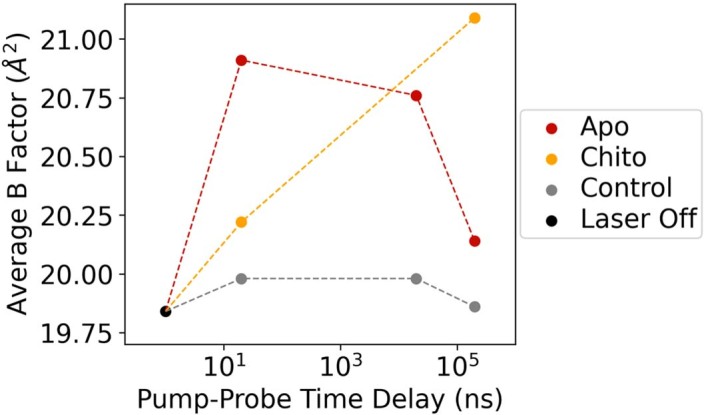
Understanding and controlling protein motion at atomic resolution is a hallmark challenge for structural biologists and protein engineers because conformational dynamics are essential for complex functions such as enzyme catalysis and allosteric regulation. Time-resolved crystallography offers a window into protein motions, yet without a universal perturbation to initiate conformational changes the method has been limited in scope. Here we couple a solvent-based temperature jump with time-resolved crystallography to visualize structural motions in lysozyme, a dynamic enzyme. We observed widespread atomic vibrations on the nanosecond timescale, which evolve on the submillisecond timescale into localized structural fluctuations that are coupled to the active site. An orthogonal perturbation to the enzyme, inhibitor binding, altered these dynamics by blocking key motions that allow energy to dissipate from vibrations into functional movements linked to the catalytic cycle. Because temperature jump is a universal method for perturbing molecular motion, the method demonstrated here is broadly applicable for studying protein dynamics.


Conflict of interest statement

The authors declare no competing interests.

Figures

Fig. 1
Fig. 1. Schematic of T-jump TRX experiment.
Lysozyme crystals were delivered to the pump–probe interaction region via a microfluidic jet. Light and dark images were collected in an interleaved manner, with light images defined as those where the crystal was pumped with an IR laser at a defined time delay (∆t) before being probed by the XFEL. Dark images were collected with the IR pump shutter closed and an XFEL probe. These images were combined in post-processing to create a set of structure factors for each time delay (Ft) and as well as two corresponding sets of dark structure factors (Fdark1 and Fdark2). Experiments and matching controls as defined above and in the text were analysed to identify time-dependent structural changes.
Fig. 2
Fig. 2. Experimental detection of T-jump.
a,b, Radial averages of diffraction images from the 20 ns dataset were decomposed using SVD. The basis vectors (vn) associated with the largest four singular values were visualized (a), as was the contribution (un) of each corresponding basis vector to each radial average (b). c, U1 values were split, which was clarified by plotting the values as histograms. The values and sign of u1n associated with the second largest singular value, correlate with IR laser status, as reported by the IR laser diode. d, Analysis of the crystallographic a/b axis lengths, equivalent under P43212 symmetry, as a function of pump–probe time delay reveal thermal expansion of the unit cell. All values in d are mean ± 95% confidence interval. Time zero corresponds to the laser-off (laser off; n = 9,464) dataset, with laser-on (light; 20 ns, n = 15,253; 20 µs, n = 13,681; 200 µs, n = 11,931) and interleaved laser-off (dark1; 20 ns, n = 14,383; 20 µs, n = 13,559; 200 µs, n = 11,857 and dark2; 20 ns, n = 14,454; 20 µs, n = 13,893; 200 µs, n = 11,950) datasets plotted for each pump–probe time delay. Unit cell dimensions expand following perturbation with an IR laser, while unilluminated data show consistent unit cell dimensions over the course of the experiment. e, Similarly, the average B-factor of refined models increases following perturbation with an IR laser. Models were refined against laser off, experiment or control structure factors. Source data
Fig. 3
Fig. 3. Time-resolved difference electron density evolves over time following T-jump.
a, Comparison of weighted difference electron density maps (Ft – Fdark2) for each pump–probe time delay, centred around residues 97–100. Maps were visualized at an absolute contour level of ±0.04 e Å3 alongside corresponding refined models. While model coordinates appeared stable across pump–probe time delays, difference maps revealed time-resolved changes to the T-jump induced signal, with evidence for coordinated motions (green arrows) apparent by 200 µs. b, IADDAT was calculated as an average value per residue for each pump–probe time delay, then mapped onto C-alpha positions (spheres) of the respective model, and plotted as a function of residue number. c, Comparison of IADDAT values for experimental maps relative to matched controls revealed low levels of noise across the series. Source data
Fig. 4
Fig. 4. Explicit modelling of time-resolved structural changes.
a, For all pump–probe time delays, difference electron density maps were visualized at an absolute contour level of ±0.04 e Å3 alongside the refined models. Alternate conformations were manually modelled into the experimental difference density for several regions, including residues 23 and 97–100, then refined against ESFMs. An ANM was developed on the basis of the ground state (conformation A of the initial model) and vectors were visualized for comparison with alternate conformers. b, Occupancies of the alternative conformations were examined as a function of increasing extrapolation factors. The stability of the hypothetical high-energy states during the coordinate refinement, and the increase in their occupancies with increasing extrapolation factor provide evidence that these conformations are populated in the ensemble. Source data
Fig. 5
Fig. 5. Chitobiose binding perturbs changes induced by T-jump.
a, Ribbon diagrams of lysozyme structures (laser off) in the apo (grey) and chitobiose (CHI)-bound (holo, orange) forms show a decrease in distance between the two lobes of the protein upon ligand binding, characteristic of the active site ‘closing’ motion. Chitobiose is shown as black sticks, along with a ligand omit map contoured to +4σ and carved within 5 Å of the chitobiose molecule. b, Visualization of weighted difference density maps (Ft – Fdark2) for chitobiose-bound datasets show similar in the apo and ligand-bound states. Maps were visualized at an absolute contour level of ±0.04 e Å3 alongside initial refined models for each pump–probe time delay. c, Comparing average IADDAT values for ligand-bound and apo maps revealed similar signal levels at 20 ns, with substantial differences appearing by 200 µs. d, Mapping absolute differences in IADDAT between 20 ns and 200 µs (|∆IADDAT|) values onto the structure (C-alphas as spheres) further reveals that time-resolved changes are more pronounced for the apo enzyme than for the inhibitor-bound enzyme. Source data
Fig. 6
Fig. 6. Schema of time-resolved conformational changes in lysozyme following T-jump.
The cartoon highlights closure of the active site cleft upon chitobiose (CHI) binding, with subsequent representations of time-resolved structural changes following T-jump. At short pump–probe time delays (20 ns) atomic vibrations (shown as red dots) are present in both the apo and inhibitor-bound structures. These vibrations persist in the inhibitor-bound structure but dissipate into more complex motions in the apo structure, including the bending of a helix that lies at the hinge point of the lysozyme molecule.
Extended Data Fig. 1
Extended Data Fig. 1. Qualitative and quantitative assessment of time-resolved difference electron density features.
(a) Comparison of weighted difference density maps for each pump-probe time delay (Flight – Fdark2) and matched controls (Fdark1 – Fdark2) visualized at an absolute contour level of ± 0.04 e3 alongside initial refined models. Atoms with greater electron density, such as the disulfide bridge between residues 76 and 94, display clear signals across all experimental maps yet very little noise in matching controls. (b) Pairwise correlation coefficients were calculated between all difference maps, revealing varying levels of similarity between experimental maps and low noise across controls. Labels correspond to time-delay (20ns, 20µs, 200µs) presence of the inhibitor, chitobiose (CHI), whether a map was a matched control (CTRL), or based on simulated (SIM) structure factors (see Methods for details). Source data
Extended Data Fig. 2
Extended Data Fig. 2. Simulations of increased B-factors recapitulate signals present at the 20 ns pump-probe time delay.
The experimental 20ns difference electron density map is visualized along with a simulated difference density map created by linearly scaling the B-factors in the laser off structure by a factor of 1.2. Negative peaks (yellow) are centered upon atoms in both maps, surrounded by positive features (blue).
Extended Data Fig. 3
Extended Data Fig. 3. Normal mode analysis of the Apo laser off structure.
ProDy was used to generate an anisotropic network model based on the apo ground state conformation. (a) The apo structure was then visualized as a ribbon diagram (grey) along with the same model projected along the combined ANM modes (green). (b) Per-residue RMSF values for the ANM model were plotted to quantify local dynamics. Source data
Extended Data Fig. 4
Extended Data Fig. 4. Effect of T-jump on average B-factor of refined apo and chitobiose-bound structures.
Models were refined against Laser Off, Experiment (apo or chitobiose bound), or Control structure factors. Controls exhibit similar B-factors across all time points, while B-factors for experimental measurements increase following T-jump. Apo models reveal a decline in B-factors at longer pump-probe time delays as complex motions develop, while chitobiose-bound experimental models retain higher B-factors at 200 μs, indicative of persistent, short-amplitude motions. Source data

References

    1. Henzler-Wildman K, Kern D. Dynamic personalities of proteins. Nature. 2007;450:964–972. doi: 10.1038/nature06522. - DOI - PubMed
    1. Bhabha G, Biel JT, Fraser JS. Keep on moving: discovering and perturbing the conformational dynamics of enzymes. Acc. Chem. Res. 2015;48:423–430. doi: 10.1021/ar5003158. - DOI - PMC - PubMed
    1. van den Bedem H, Fraser JS. Integrative, dynamic structural biology at atomic resolution-it’s about time. Nat. Methods. 2015;12:307–318. doi: 10.1038/nmeth.3324. - DOI - PMC - PubMed
    1. Coquelle N, et al. Chromophore twisting in the excited state of a photoswitchable fluorescent protein captured by time-resolved serial femtosecond crystallography. Nature Chem. 2018;10:31–37. doi: 10.1038/nchem.2853. - DOI - PubMed
    1. Hekstra DR, et al. Electric-field-stimulated protein mechanics. Nature. 2016;540:400–405. doi: 10.1038/nature20571. - DOI - PMC - PubMed

Publication types