. 2023 Oct;4(10):1491-1507.
doi: 10.1038/s43018-023-00636-6. Epub 2023 Sep 18.

Acetate acts as a metabolic immunomodulator by bolstering T-cell effector function and potentiating antitumor immunity in breast cancer

Affiliations

Acetate acts as a metabolic immunomodulator by bolstering T-cell effector function and potentiating antitumor immunity in breast cancer

Katelyn D Miller et al. Nat Cancer. 2023 Oct.

Abstract

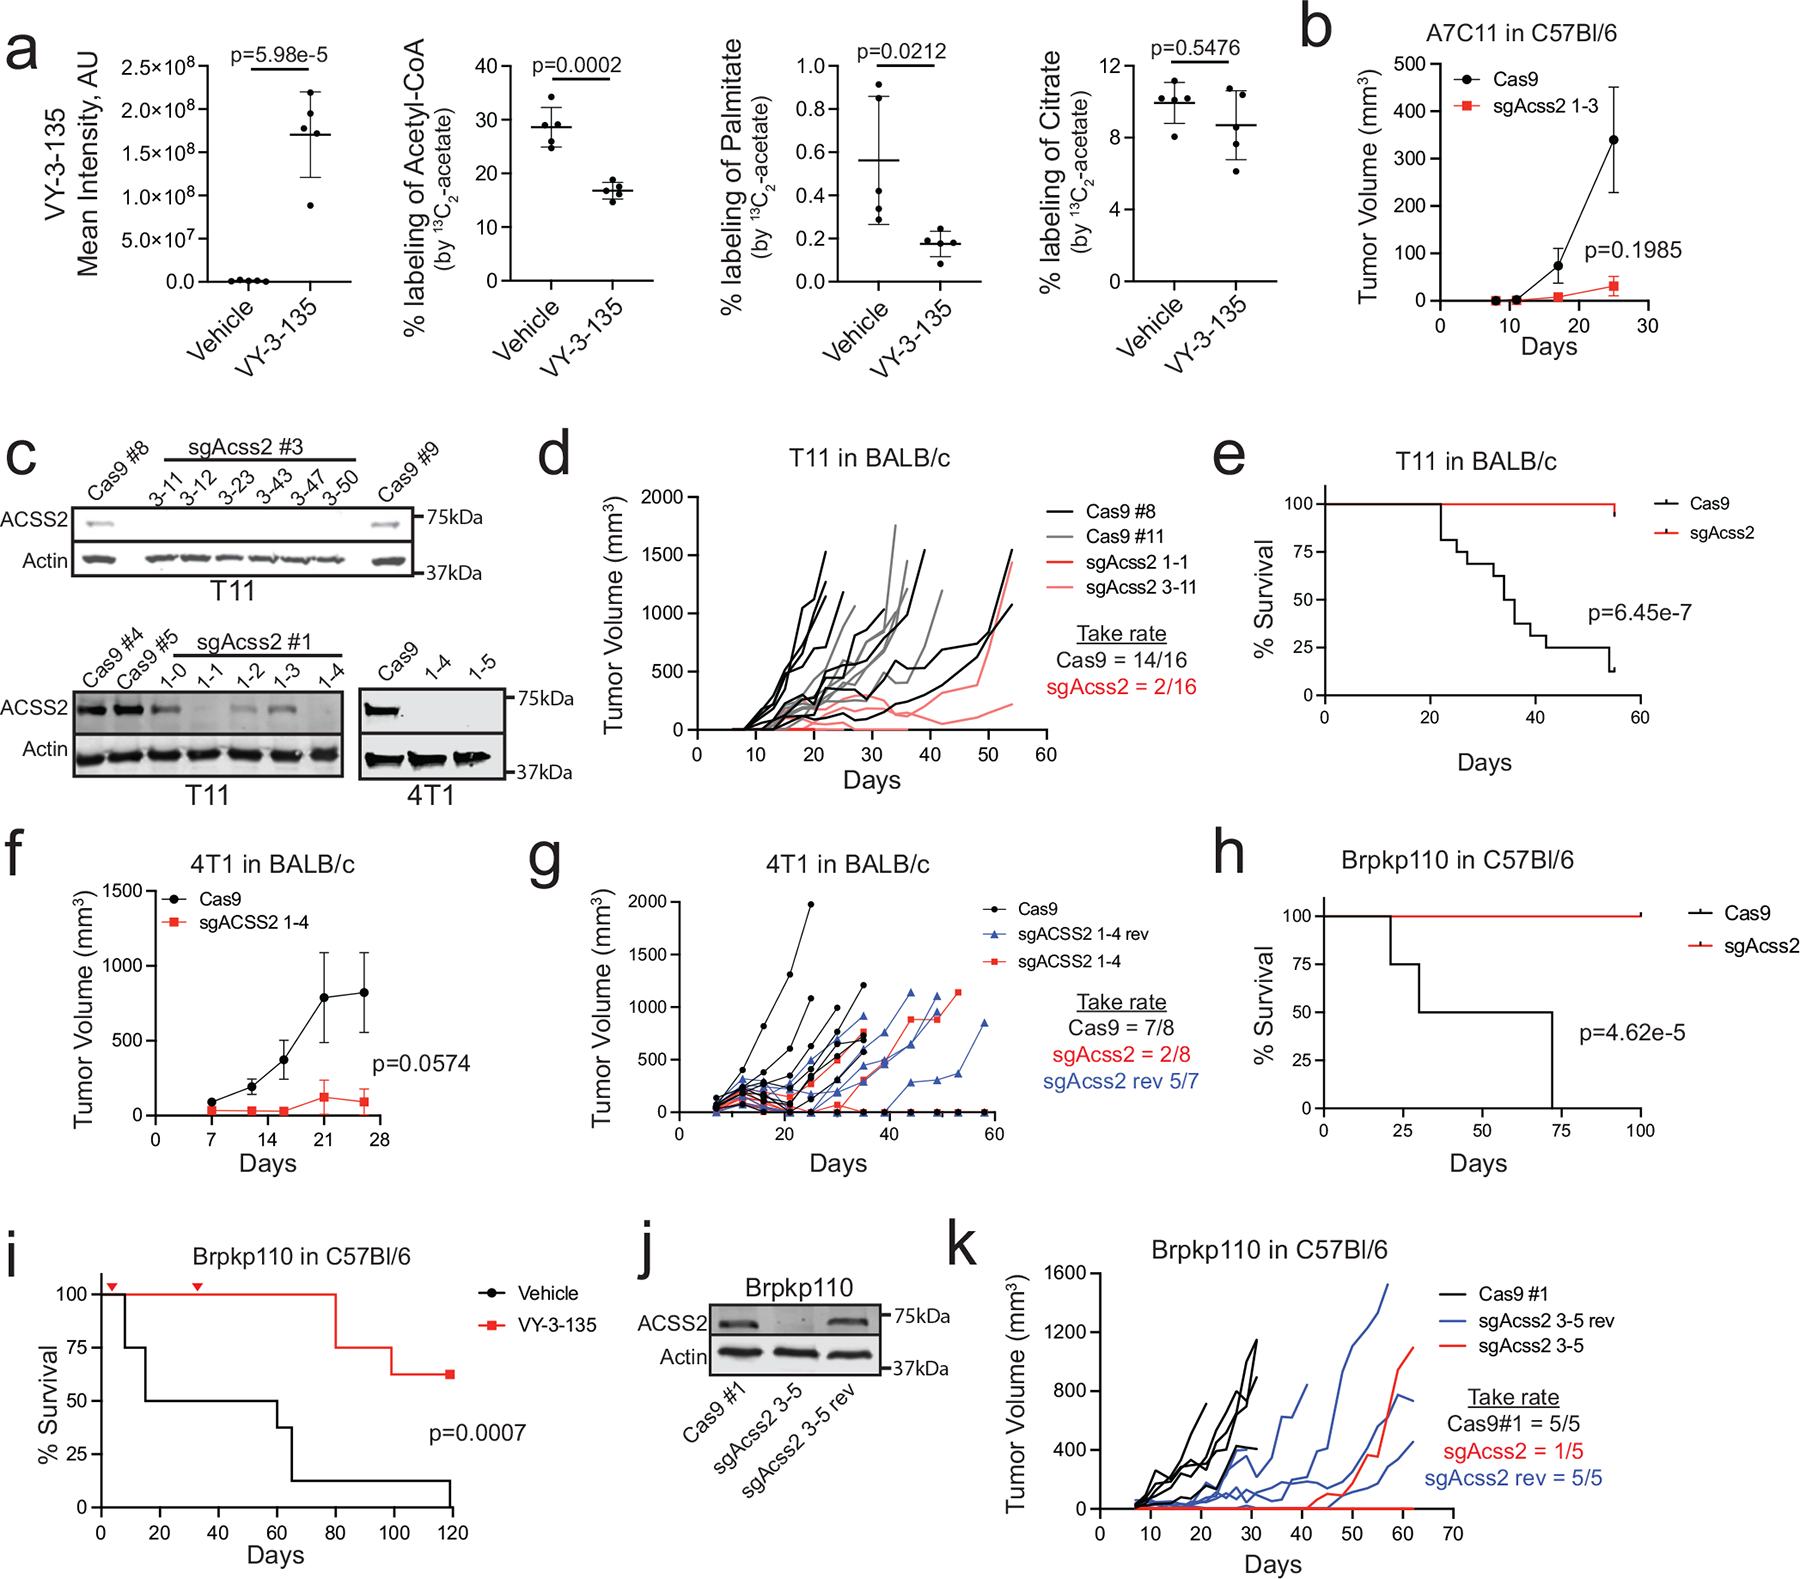
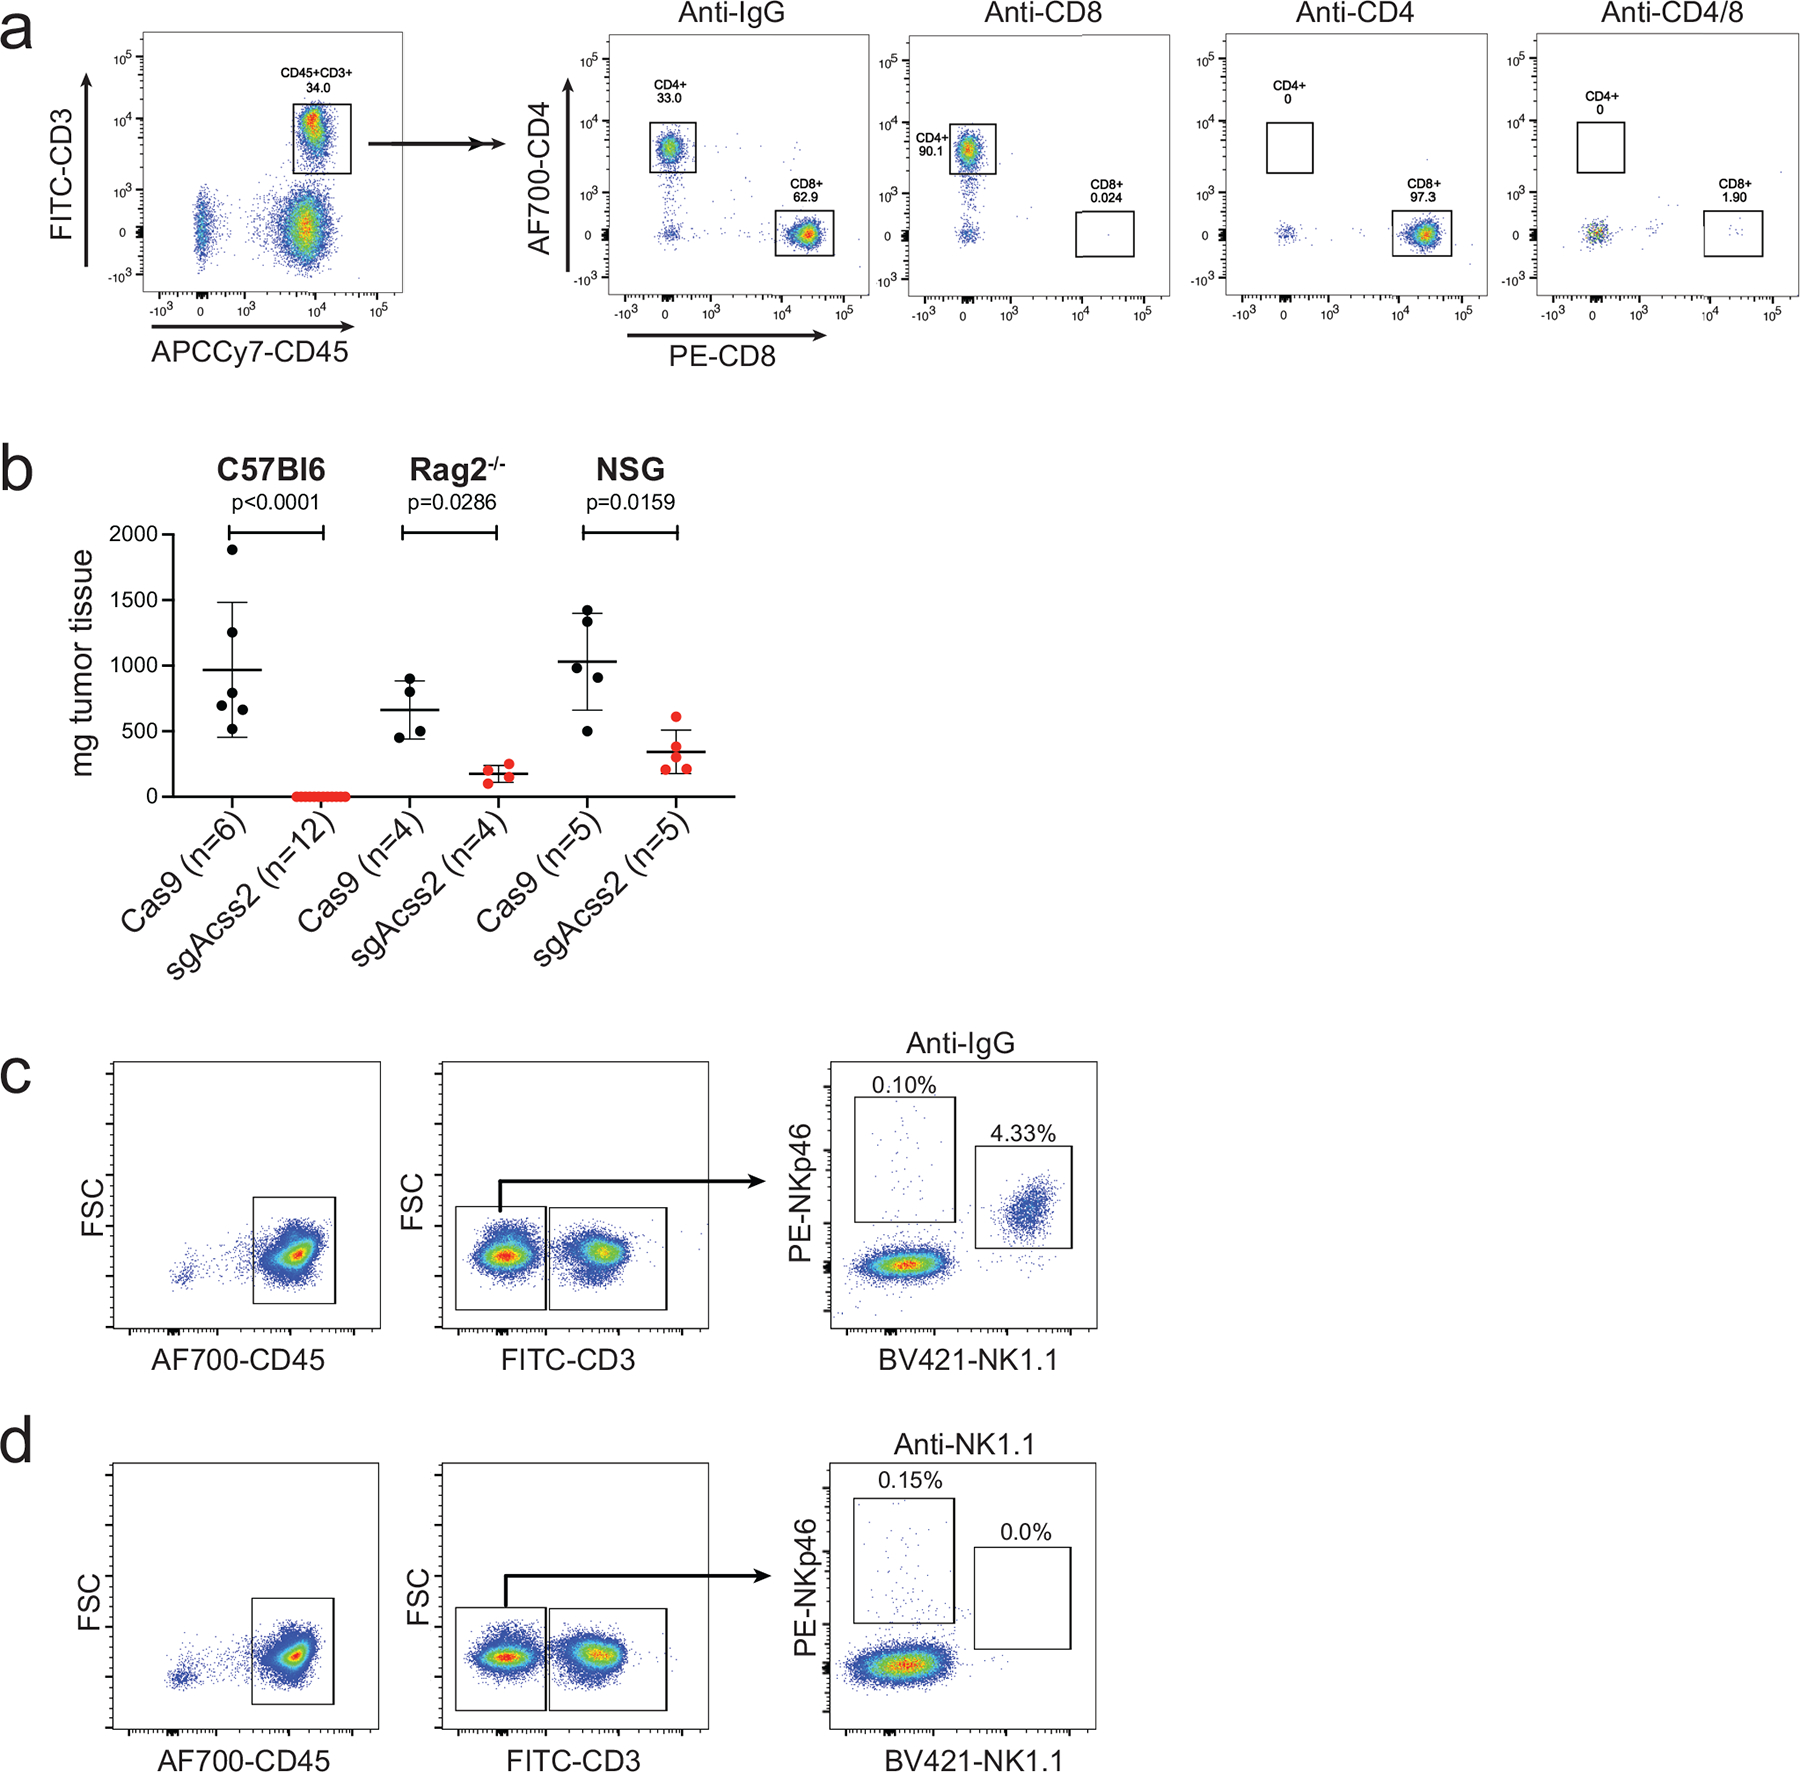
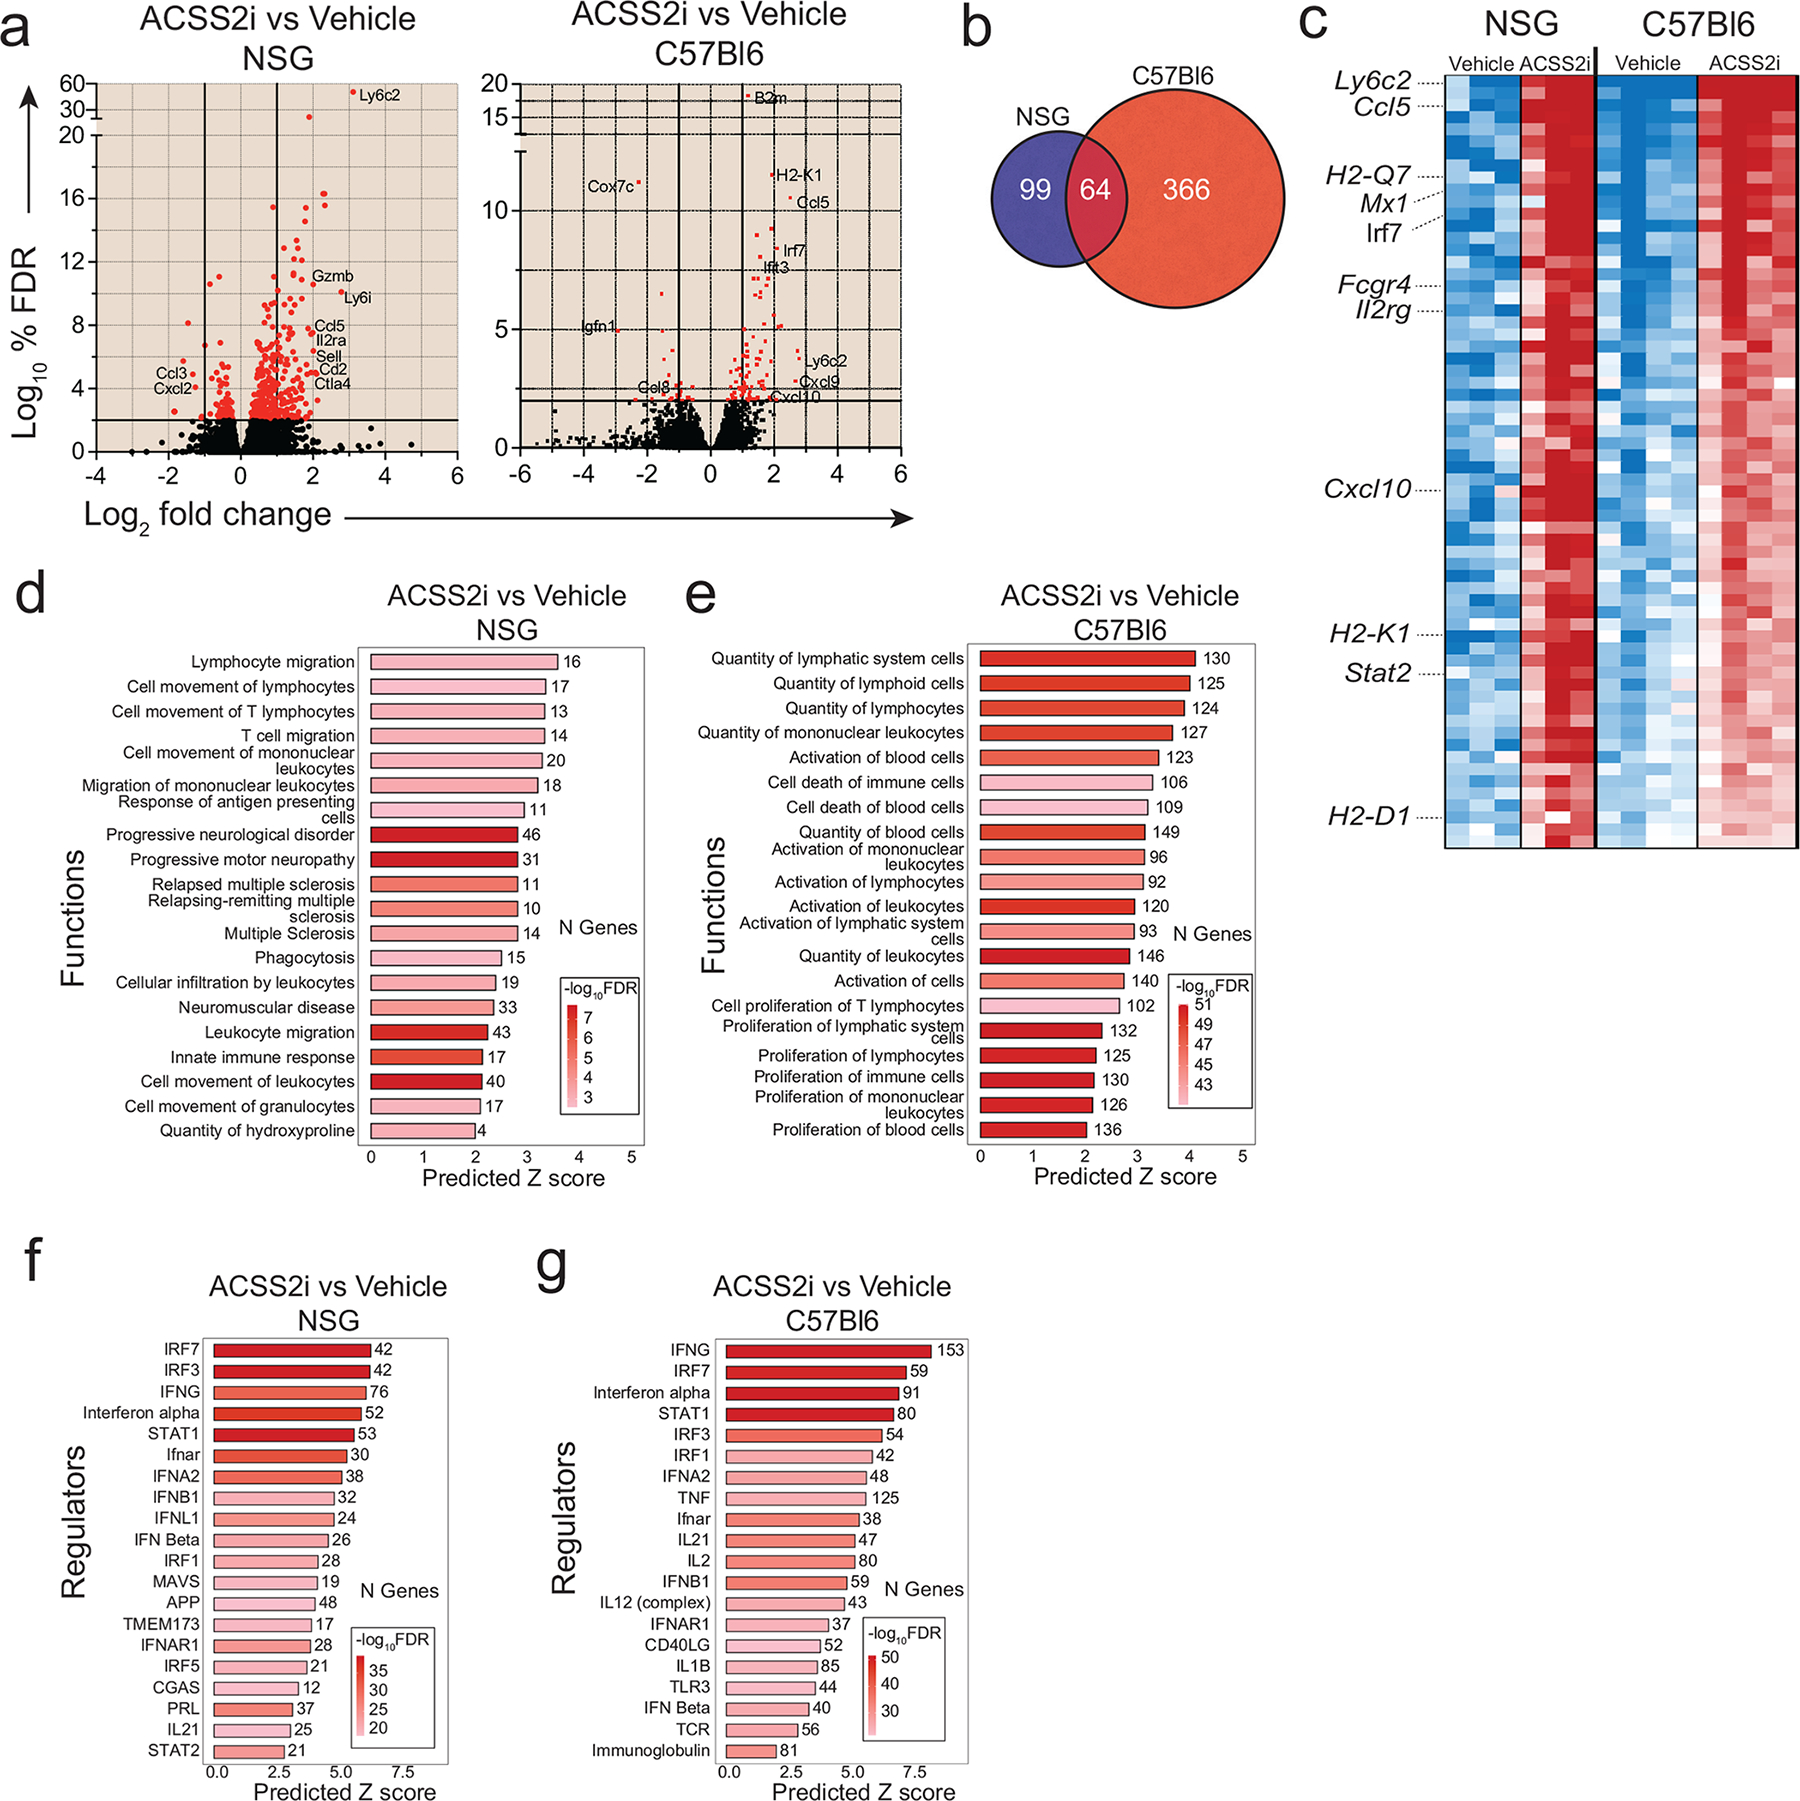
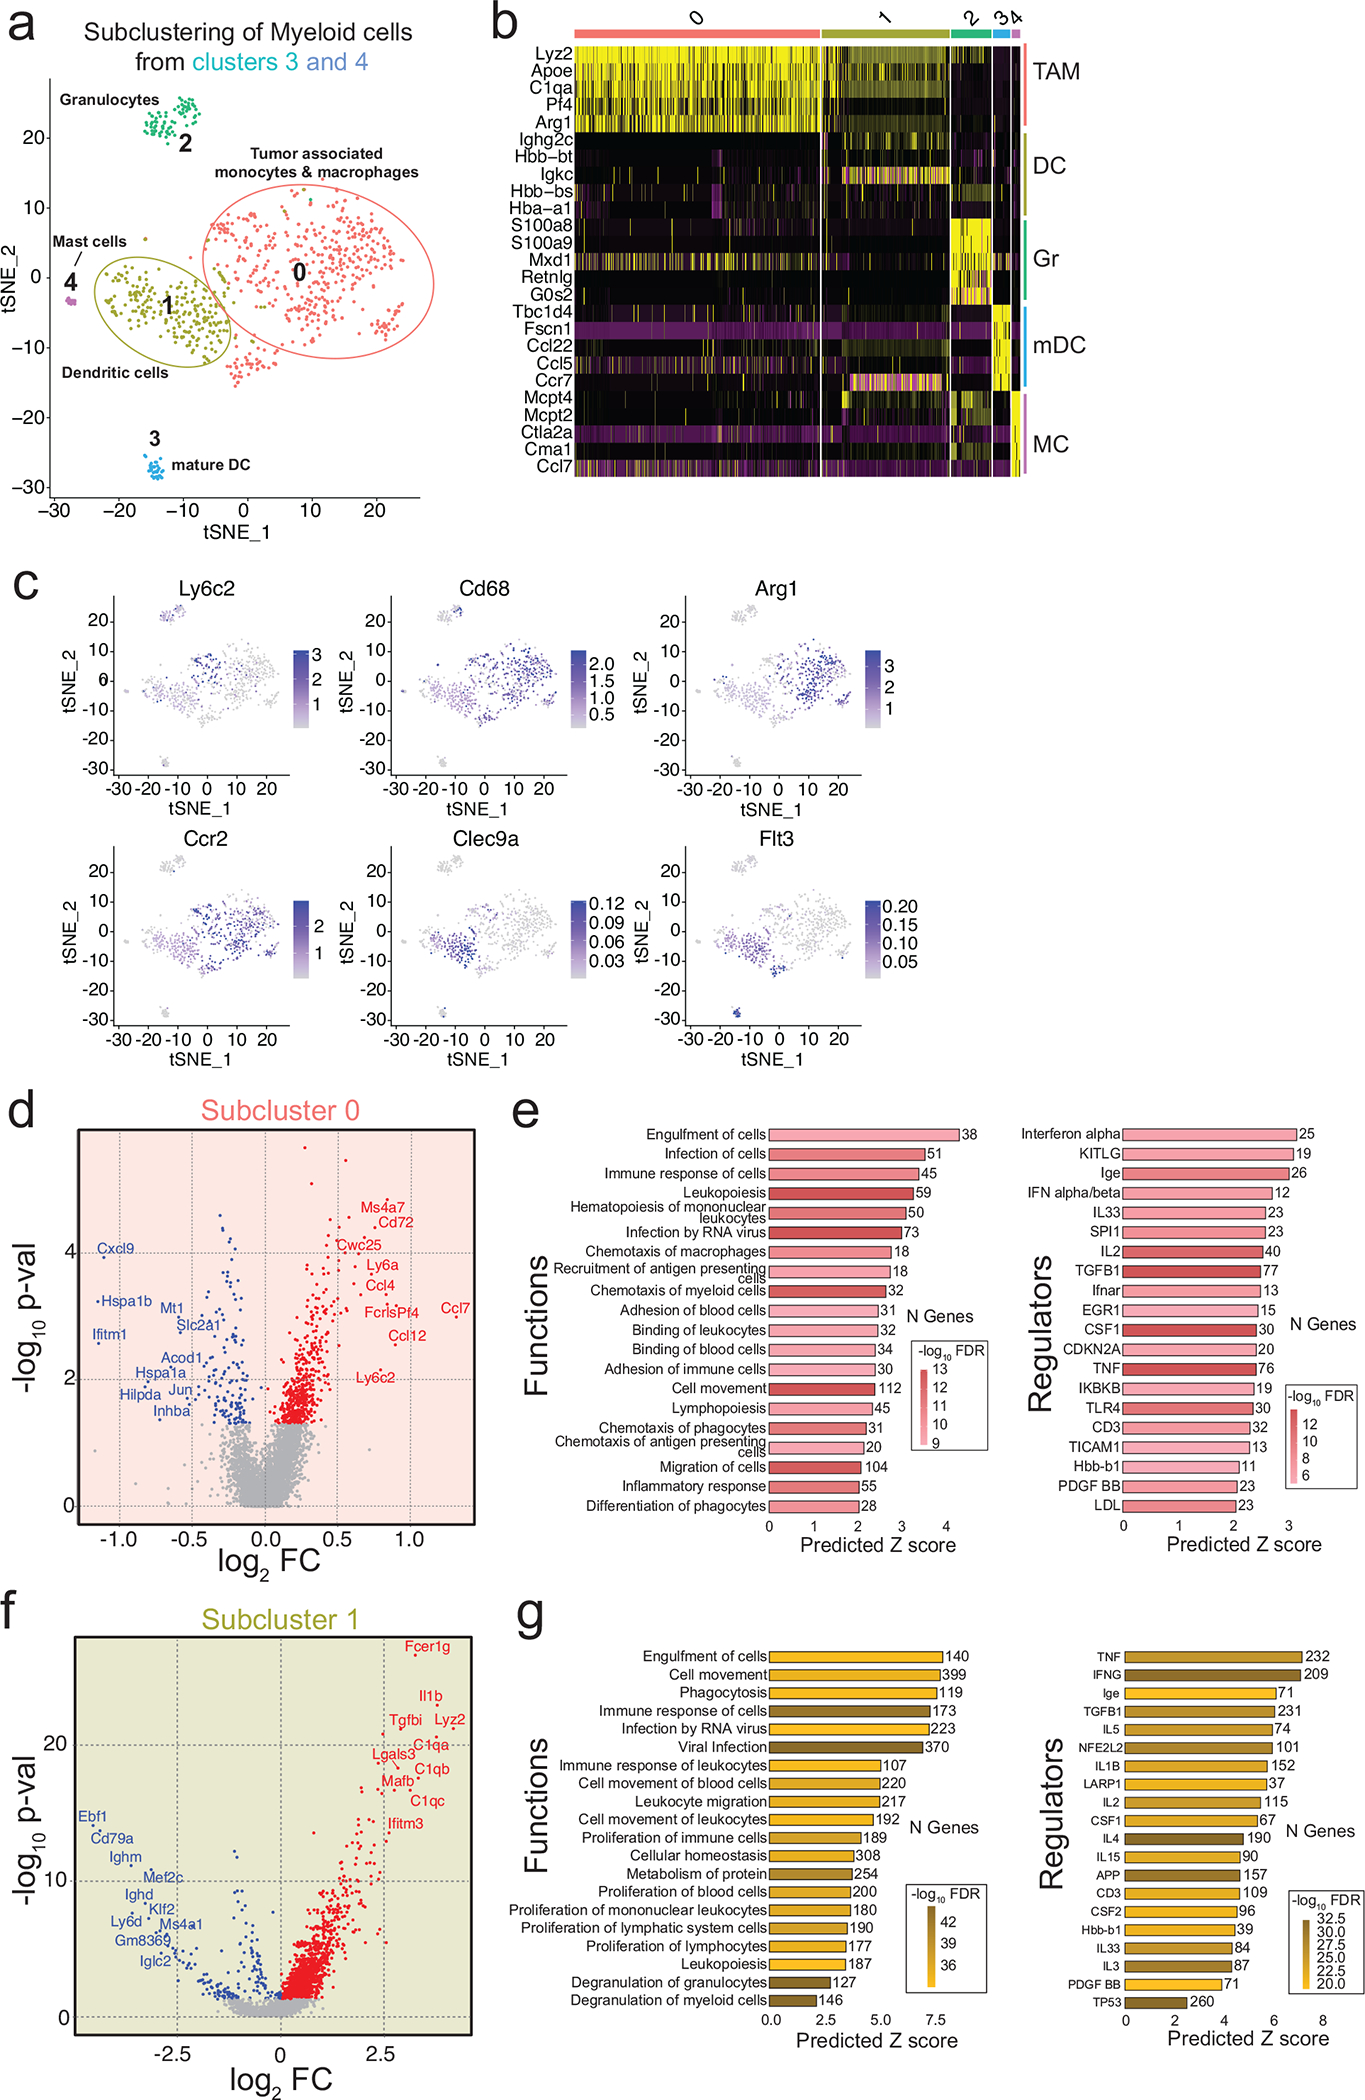
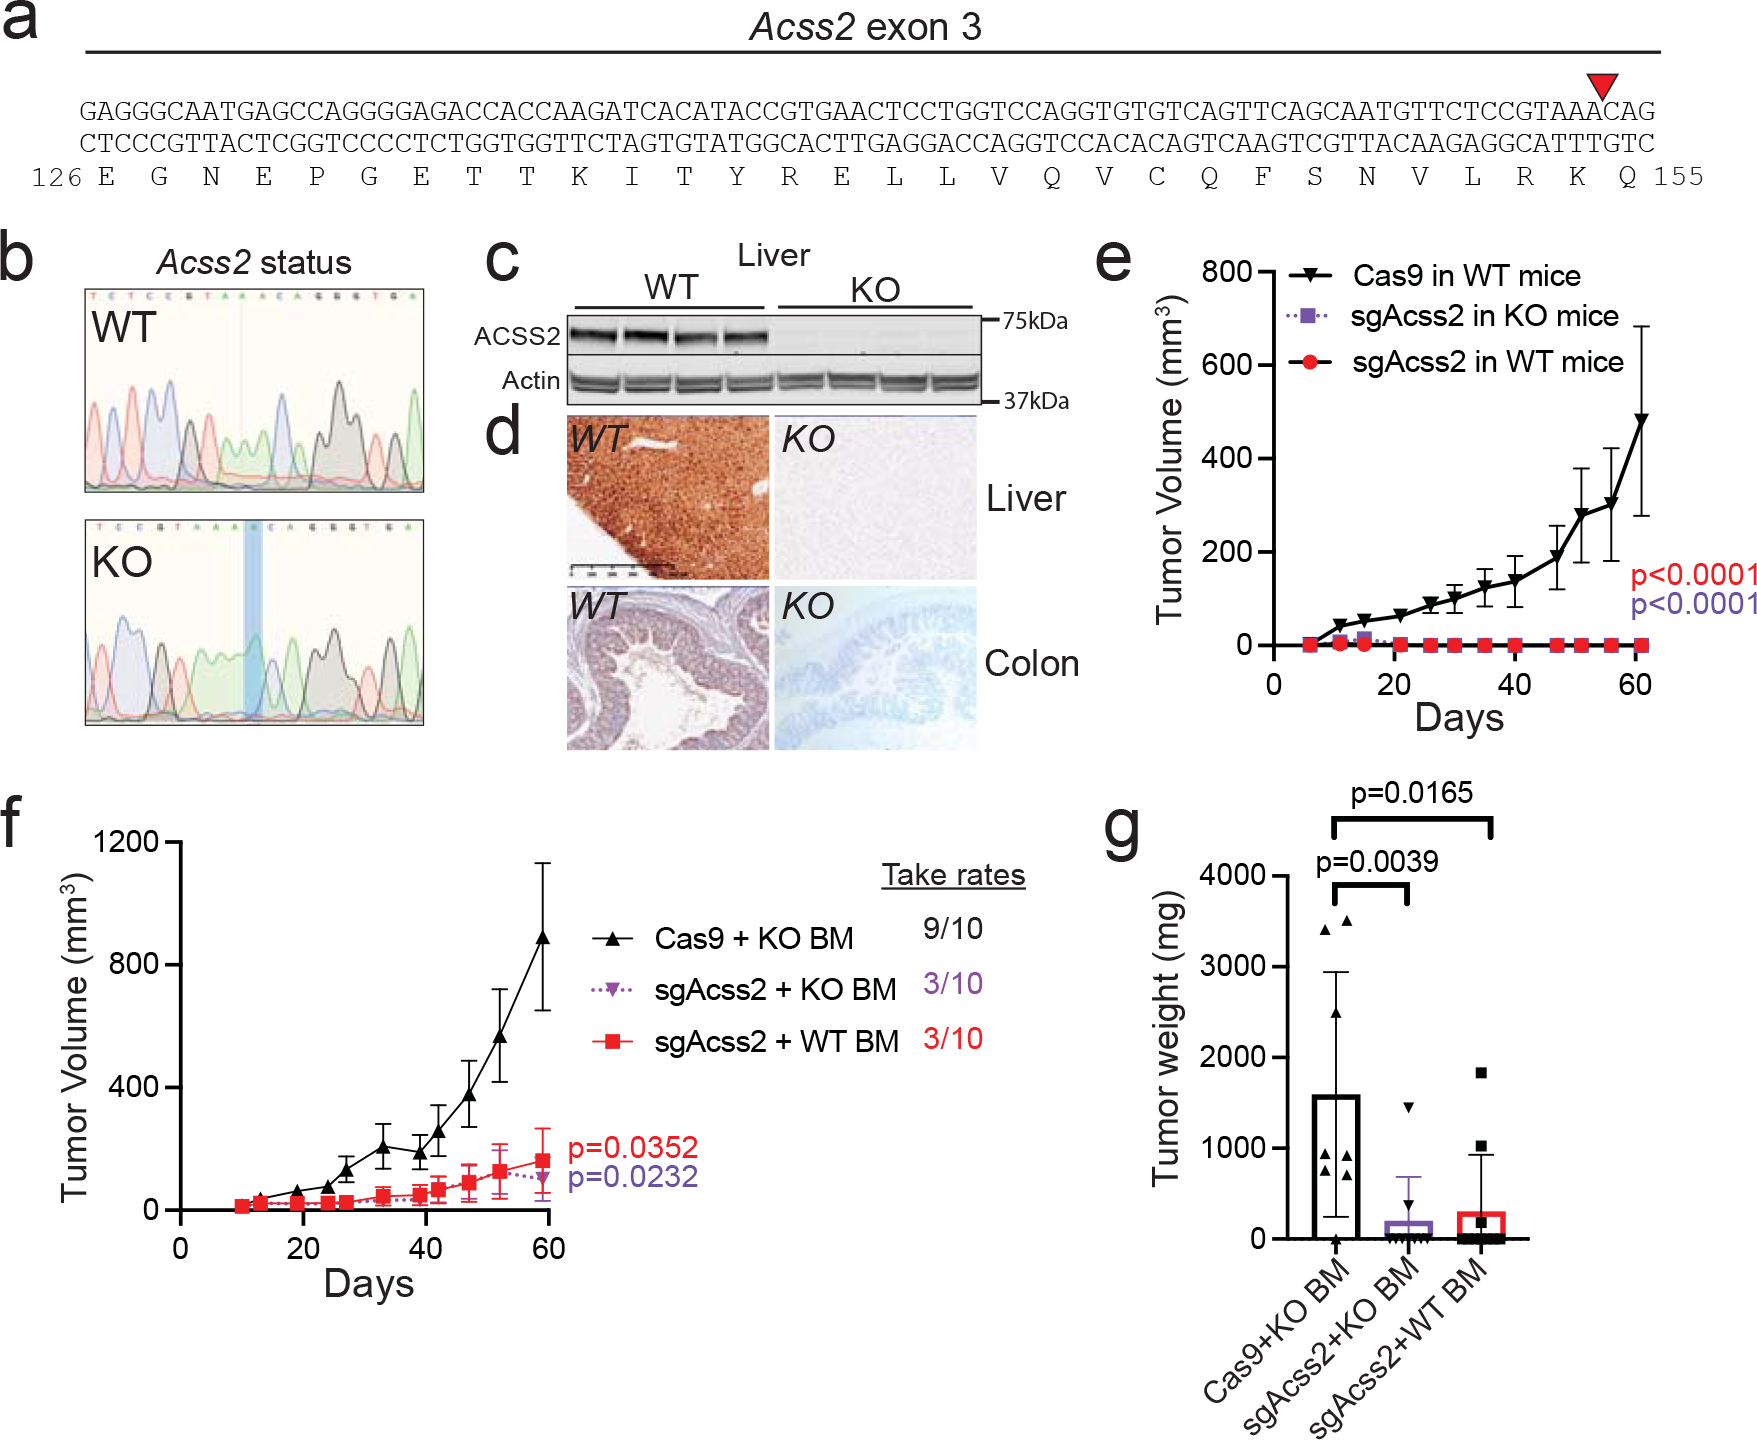
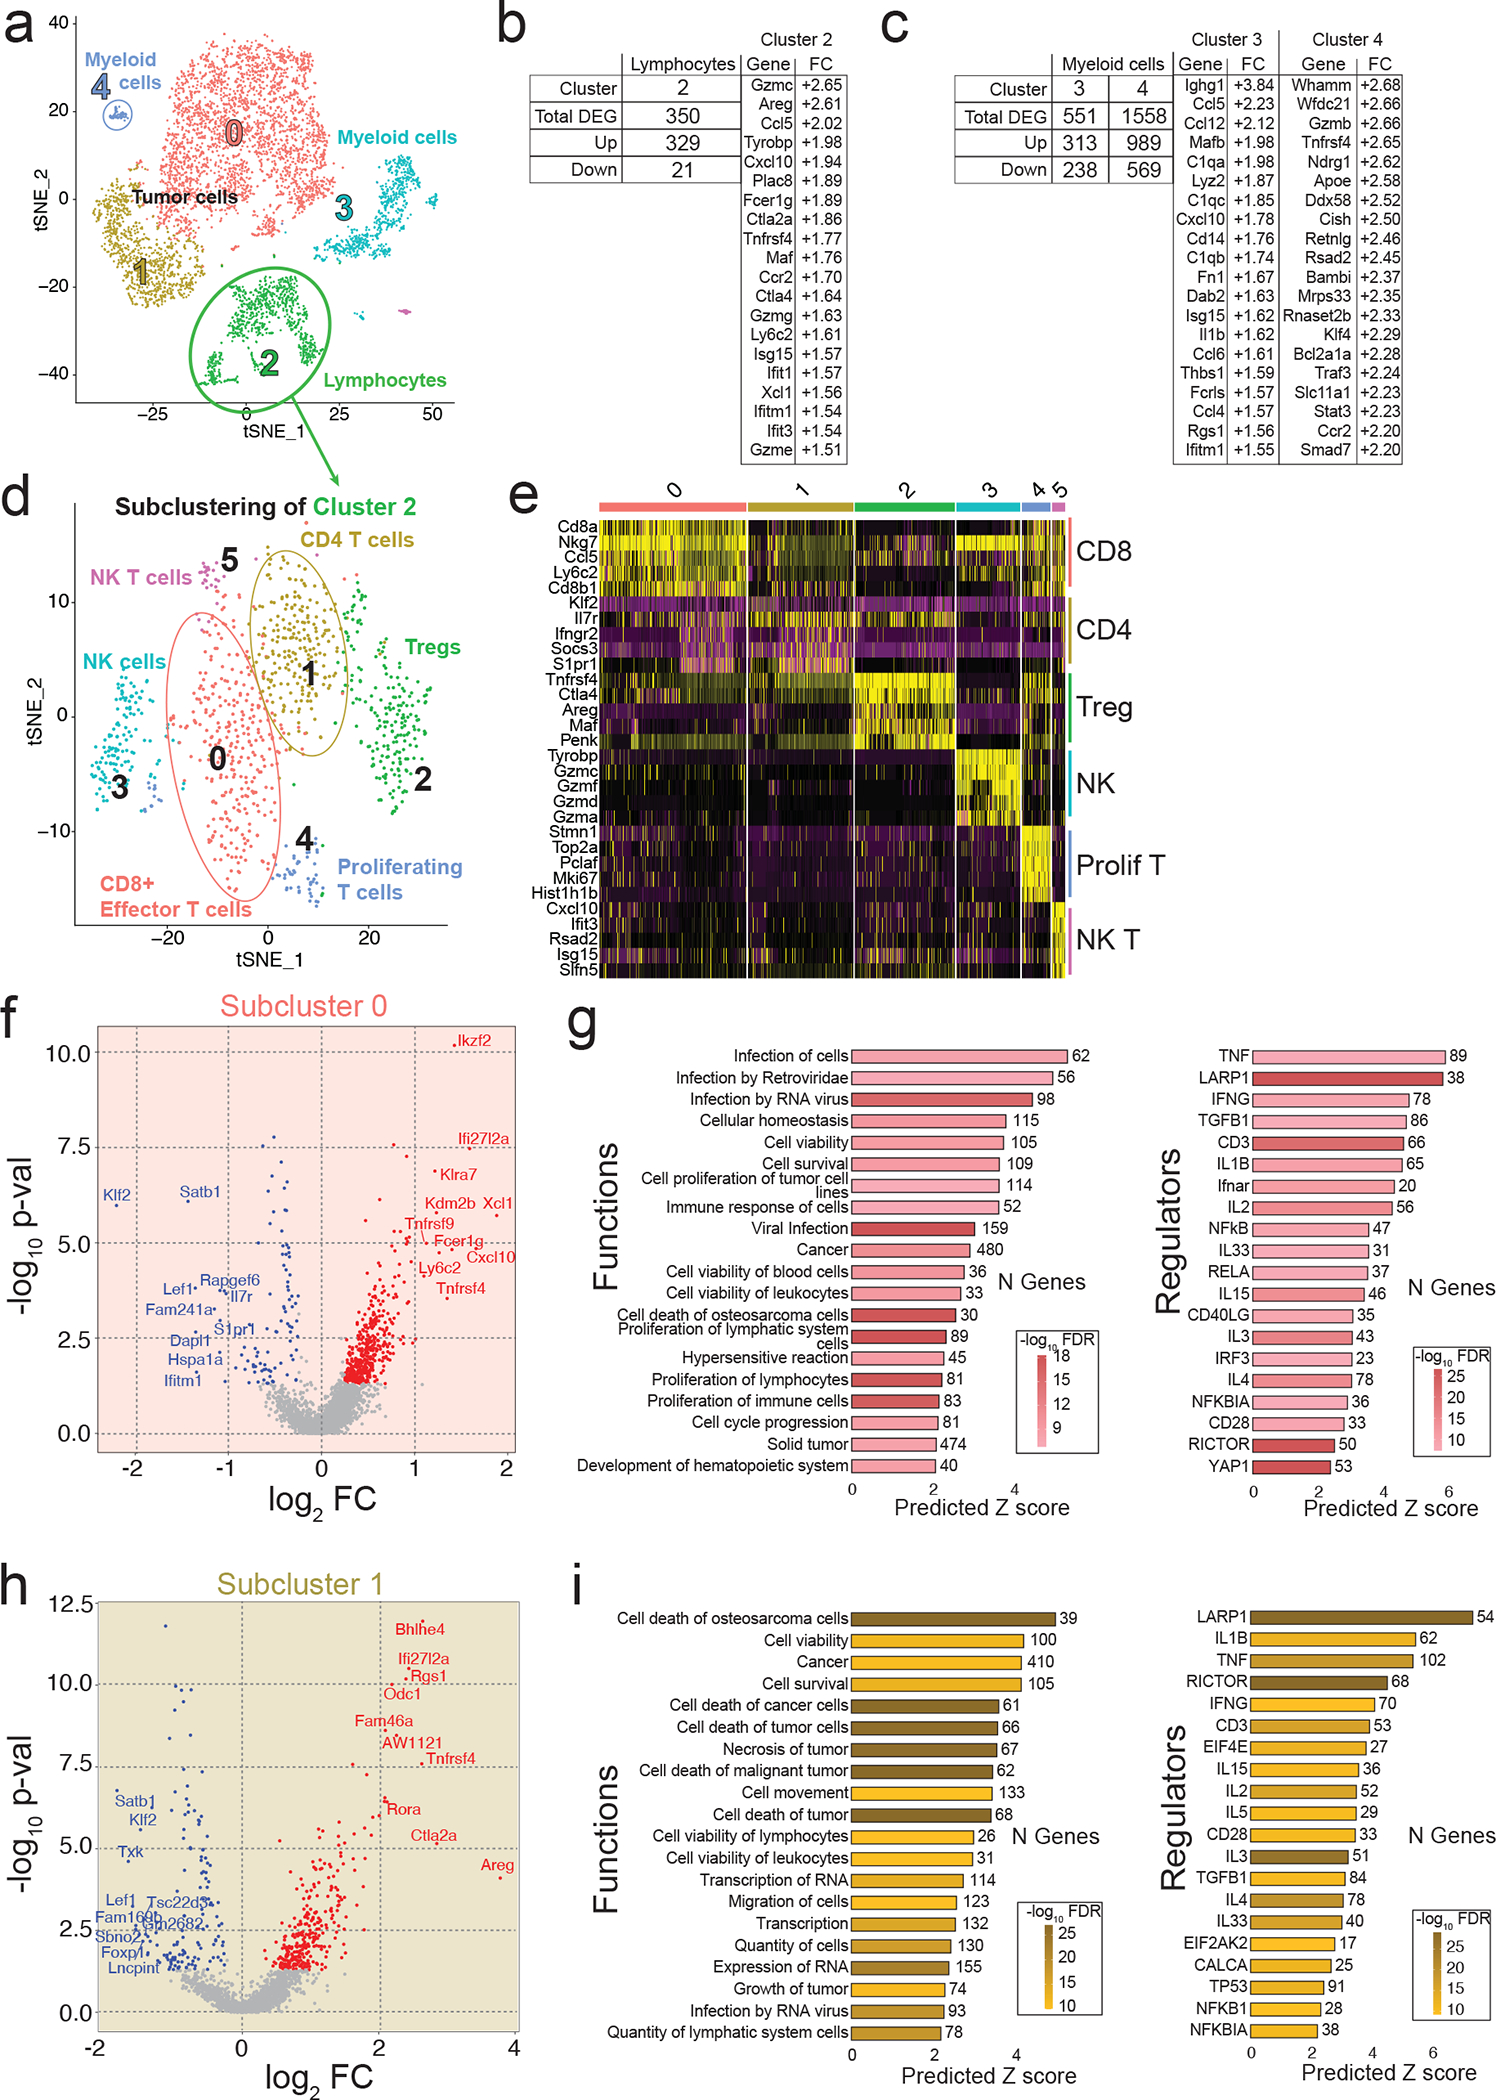
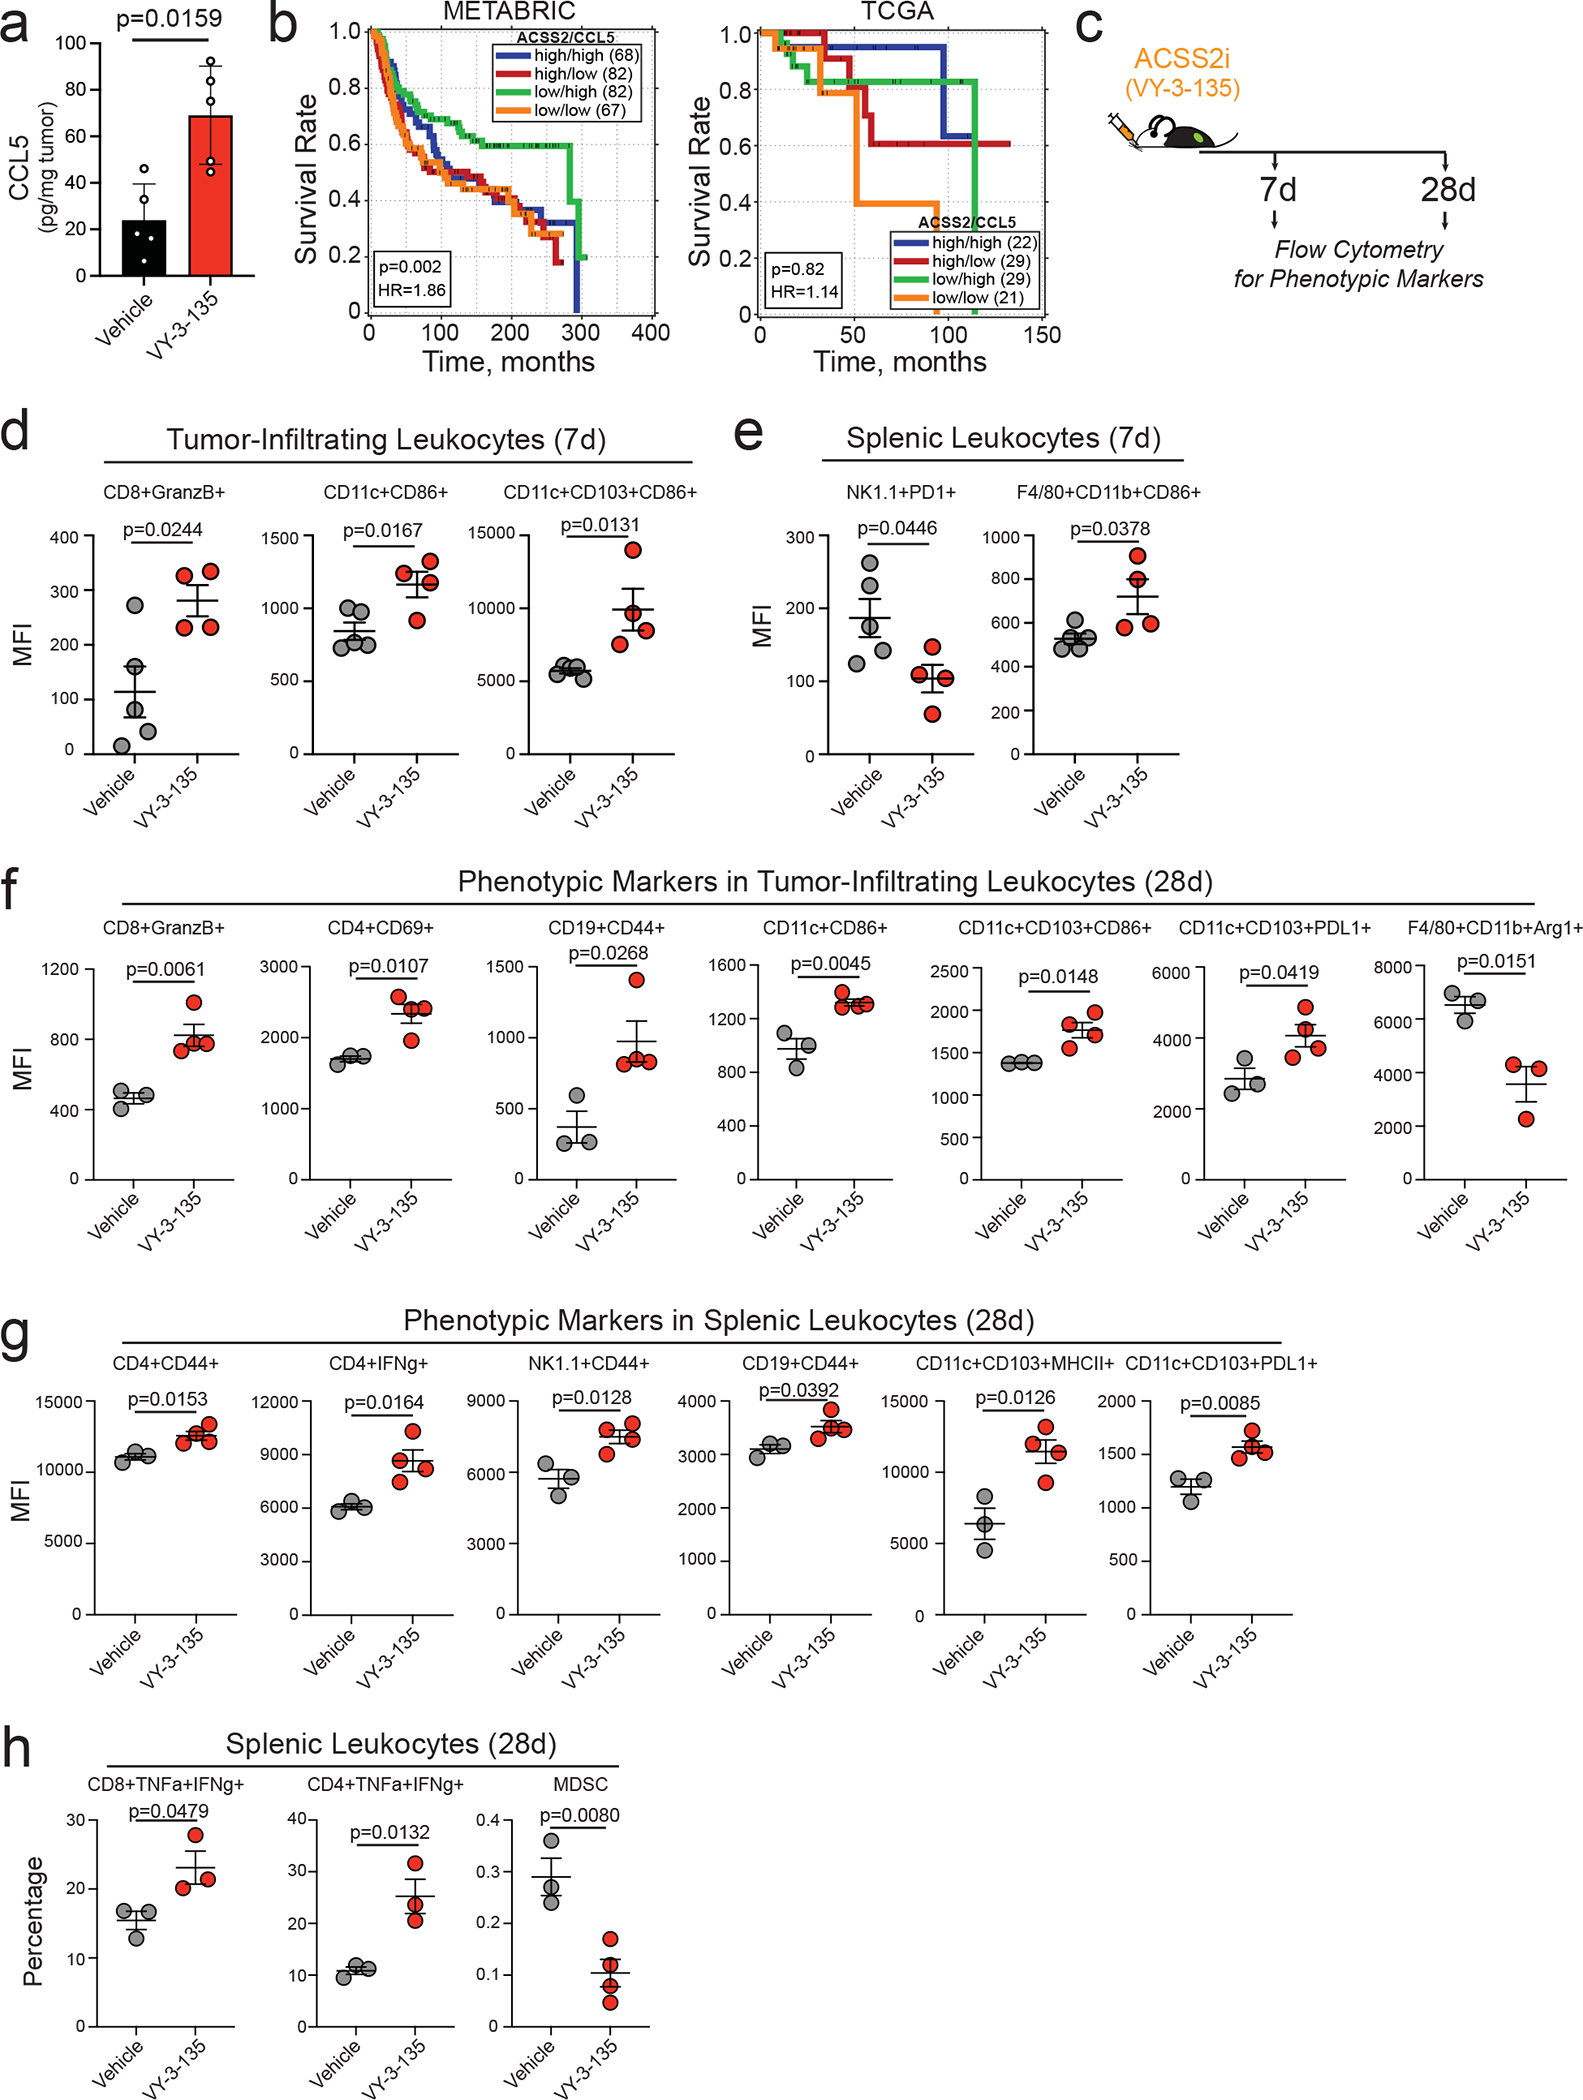
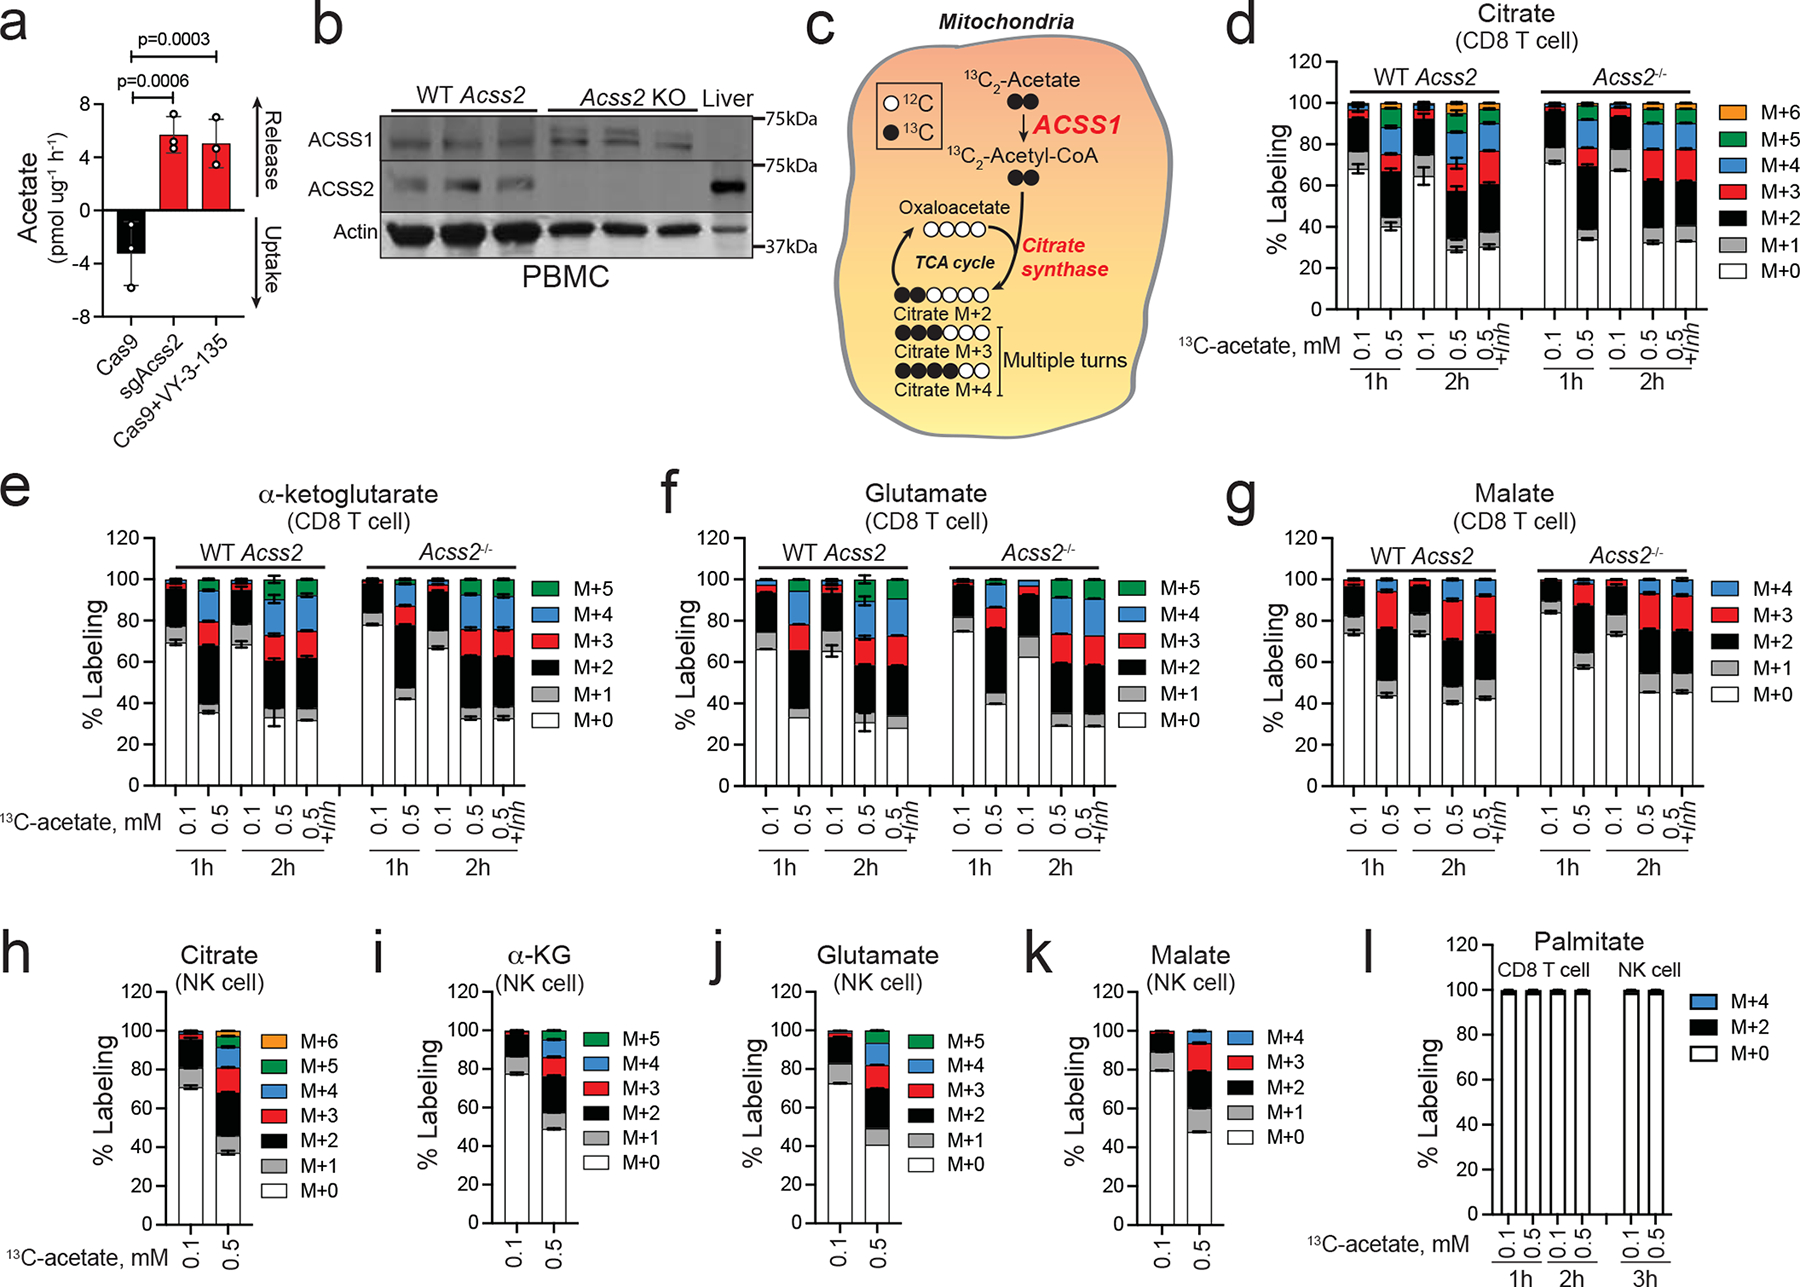
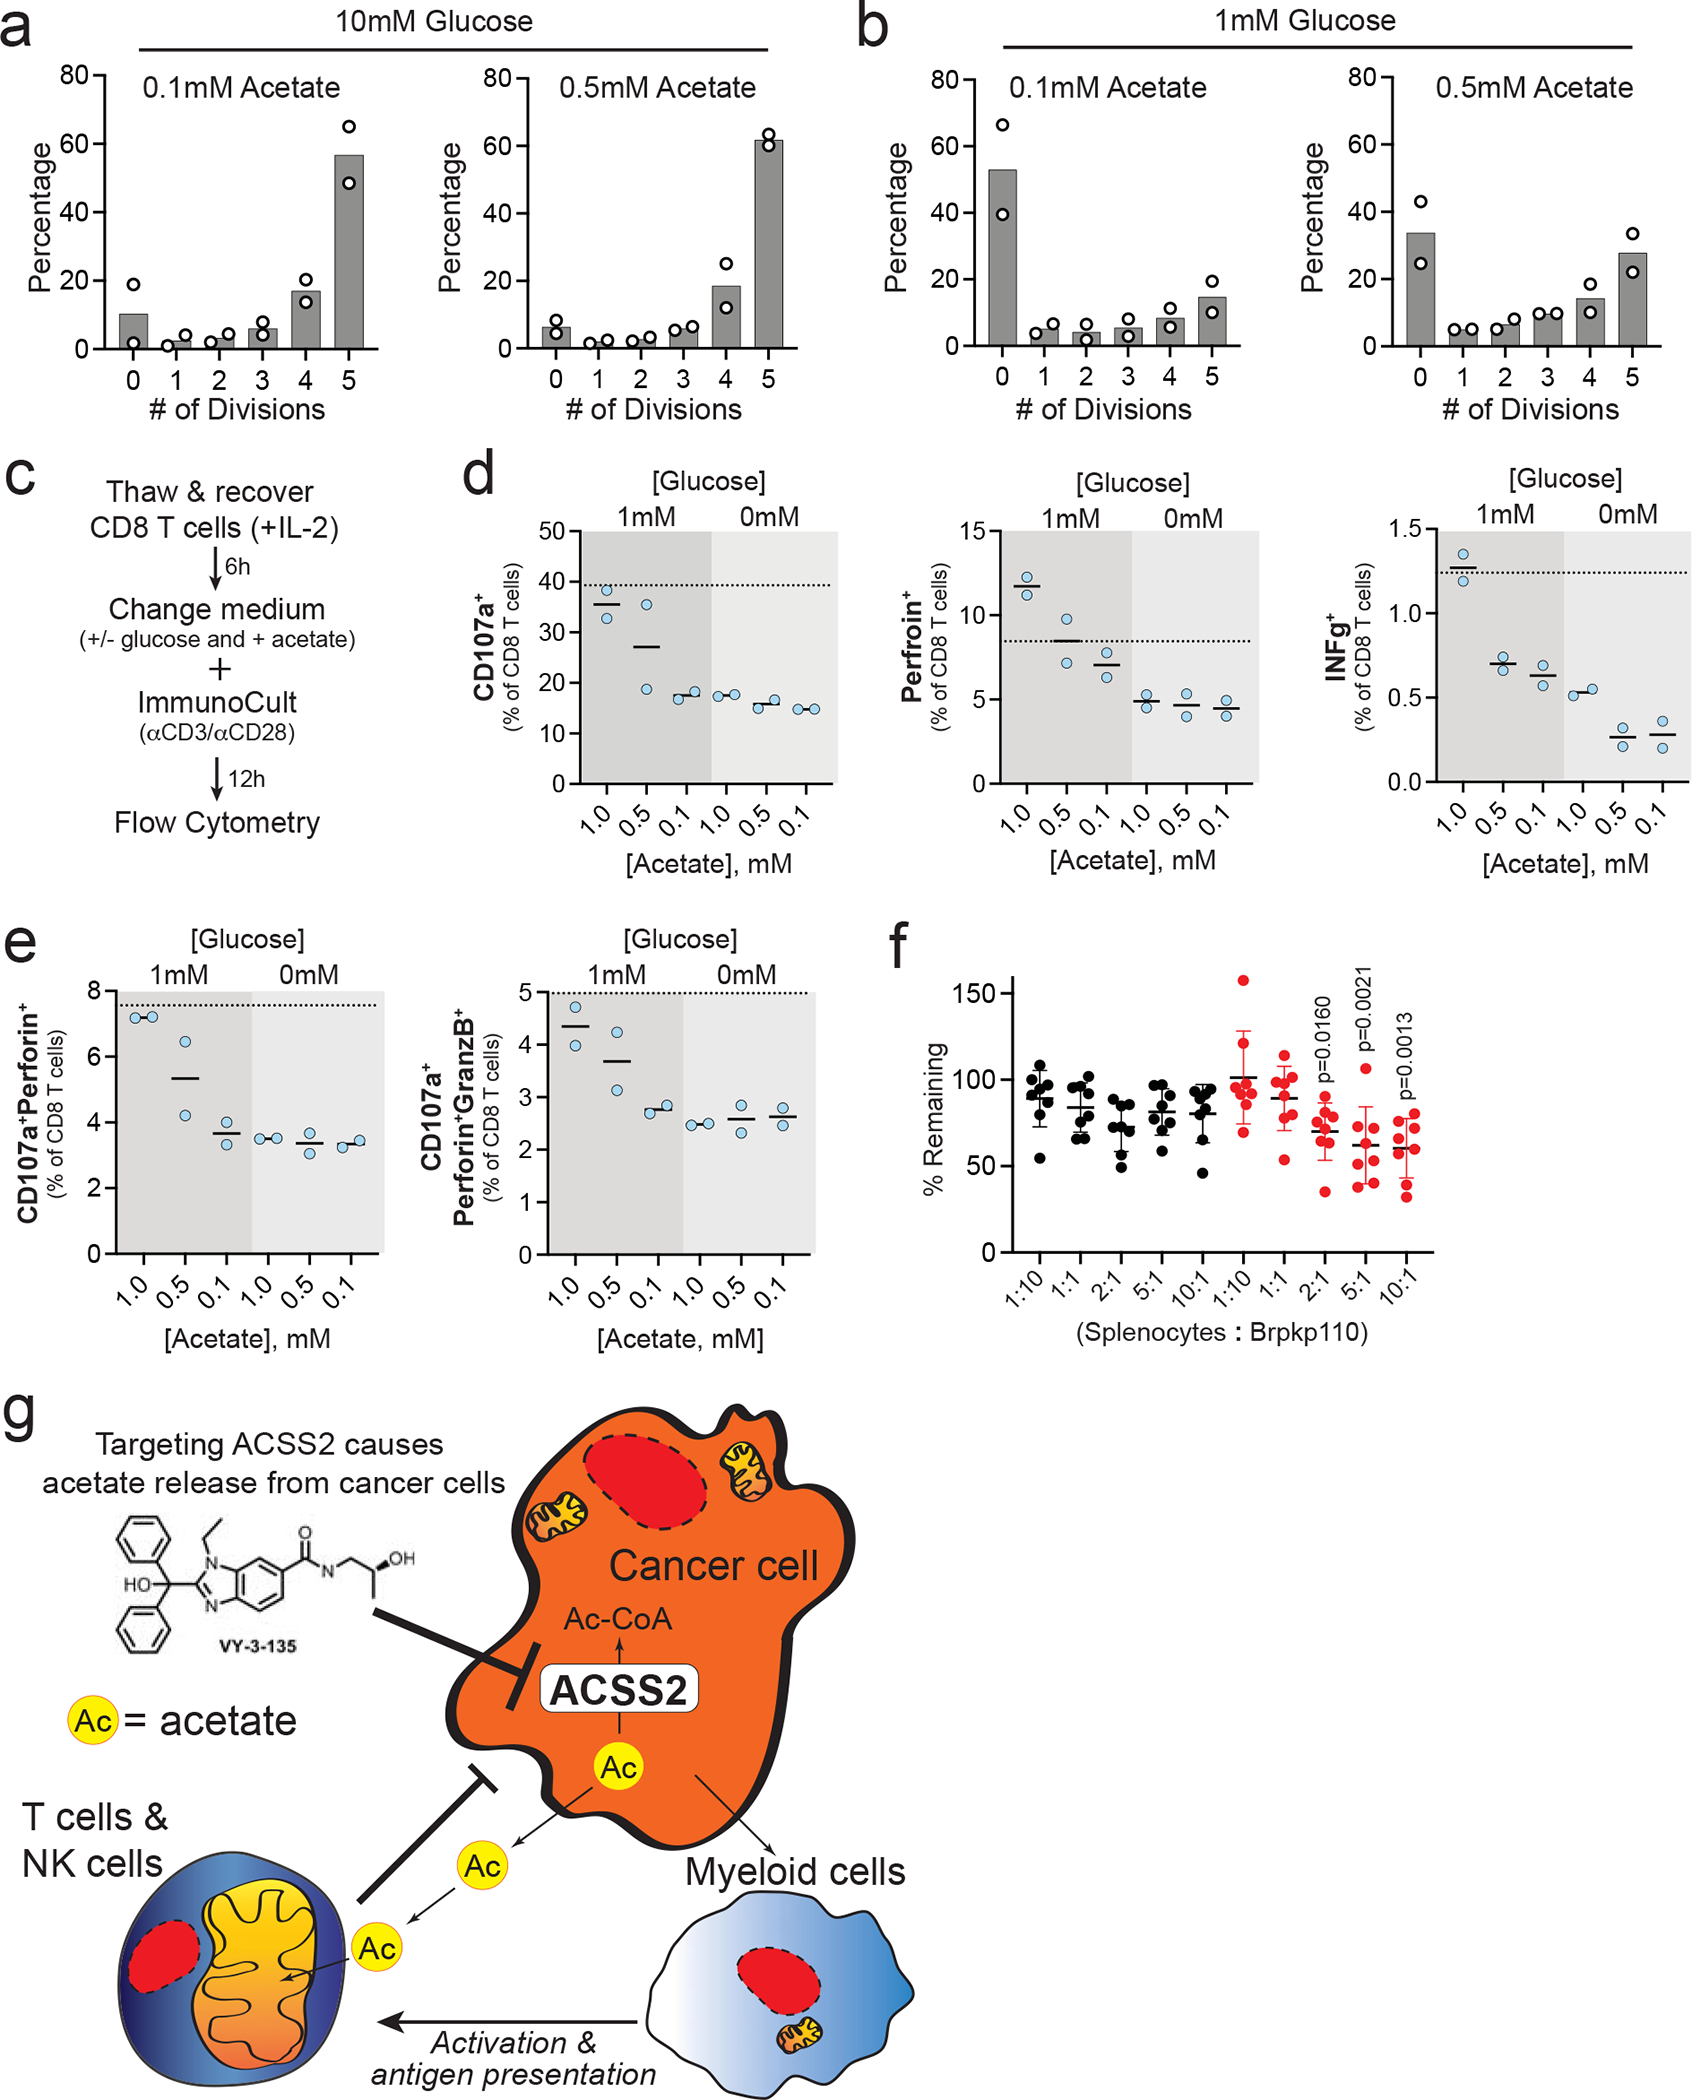
Acetate metabolism is an important metabolic pathway in many cancers and is controlled by acetyl-CoA synthetase 2 (ACSS2), an enzyme that catalyzes the conversion of acetate to acetyl-CoA. While the metabolic role of ACSS2 in cancer is well described, the consequences of blocking tumor acetate metabolism on the tumor microenvironment and antitumor immunity are unknown. We demonstrate that blocking ACSS2, switches cancer cells from acetate consumers to producers of acetate thereby freeing acetate for tumor-infiltrating lymphocytes to use as a fuel source. We show that acetate supplementation metabolically bolsters T-cell effector functions and proliferation. Targeting ACSS2 with CRISPR-Cas9 guides or a small-molecule inhibitor promotes an antitumor immune response and enhances the efficacy of chemotherapy in preclinical breast cancer models. We propose a paradigm for targeting acetate metabolism in cancer in which inhibition of ACSS2 dually acts to impair tumor cell metabolism and potentiate antitumor immunity.


Conflict of interest statement

Competing Interests

J.M.S. and Z.T.S. are scientific co-founders and consultants for Syndeavor Therapeutics. The remaining authors declare no competing interests.

Figures

Extended Data Fig. 1 |
Extended Data Fig. 1 |. Knockout of Acss2 in mouse breast cancer cell lines often leads to tumor clearance.
a, LC-MS analysis of 13C2-acetate labeling of metabolites and fatty acids in T12 tumor tissue from vehicle versus VY-3-135 treated BALB/c mice. Lines represent the mean ± standard deviation (SD). P values were generated using two-sided t-test. n = 5 tumours per group. AU = arbitrary units b, Allograft tumour growth of Cas9 (WT) or sgAcss2 (Acss2- KO) A7C11 cells in C57Bl/6 mice. Adjusted p values were generated using two tailed multiple unpaired Welch t-test. Values represent the mean tumour volume ± SEM. n = 5 mice per group. c, Western blots for ACSS2 expression in T11 and 4T1 sgAcss2 cell lines. d, Allograft tumour growth of Cas9 (WT) or sgAcss2 (Acss2-KO) T11 cells in BALB/c mice. n = 8 mice per group. e, Kaplan-Meier survival plot of C57Bl/6 tumour-bearing mice injected with either wild type (Cas9) or Acss2-KO (sgAcss2) T11 cells. P values were generated using a log-rank (Mantel-Cox) test. n = 16 mice per group. f, Allograft tumour growth of Cas9 (WT) or sgAcss2 (Acss2-KO) 4T1 cells in BALB/c mice. Adjusted p values were generated using multiple two-sided Welch t-test. Values represent the mean tumour volume ± SEM. n = 8 mice per group. g, Syngeneic allograft tumour growth of 4T1 sgAcss2 revertant (sgAcss2 rev) tumours in BALB/c mice. n = 7 to 8 mice per group as indicated on plot. Take rates indicate the number of mice with tumours in each group at the end of the study. h, i, Kaplan-Meier survival plot of C57Bl/6 tumour-bearing mice injected with either wild type (Cas9) or Acss2-KO (sgAcss2) Brpkp110 cells or with wild type (Cas9) Brpkp110 cells that were treated daily from day 4 to day 31 (marked red triangles) with VY-3 135. P values were generated using a log-rank (Mantel-Cox) test. n = 8 mice per group. j, Western blot for ACSS2 expression in Brpkp110 wild type (Cas9 #1), sgAcss2 and sgAcss2 rev. k, Syngeneic allograft tumour growth of Brpkp110 cells from panel j in C57Bl/6 mice. n = 5 mice per group. Western blotting results were independently validated twice.
Extended Data Fig. 2 |
Extended Data Fig. 2 |. Clearance of Acss2-KO tumours depends on the presence of functional T cells.
a, Representative flow plots of peripheral blood mononuclear cells collected from mice depleted of CD4+, CD8+, or CD4+ and CD8+ T cells. b, Final tumour weights of WT or Acss2-KO Brpkp110 tumours grown in C57Bl/6, C57Bl/6 Rag2−/−, or NSG mice. Values represent the mean tumour volume ± SD. P values generated using two-tailed Mann–Whitney U test. c, d, Representative flow plots of peripheral blood mononuclear cells collected from mice treated with IgG control (c) or an NK-cell depleting antibody against NK1.1 (d).
Extended Data Fig. 3 |
Extended Data Fig. 3 |. ACSS2 inhibitor-treated tumours have gene signatures associated with increased immune surveillance and activation.
a, Volcano plots showing differentially expressed genes (DEGs) in tumours from NSG or C57Bl/6 mice treated with VY-3-135. NSG tumour-bearing mice were treated for 15 days. C57Bl/6 mice were treated for 5 days. b, Venn diagram illustrating the overlap of genes differentially regulated by VY-3-135 treatment in tumours grown in NSG versus C57Bl/6 mice. c, Heat map of 64 genes in common from the data in panel a. d, e, GSEA of the top 20 most significantly activated functions in tumours after VY-3-135 treatment in NSG and C57Bl/6 mice. Heat-mapping represents -log10 FDR values. The number of genes within that function that were altered is displayed. The x-axis shows the predicted Z score based on the gene expression differences. f, g, IPA analysis of the top 20 significant regulators enriched by VY-3-135 treatment in NSG or C57Bl/6 mice. Heat-mapping on bar plots represents -log10 FDR values. The number next to the bar displays the number (N) of genes within that regulator or function gene set that were altered. The x-axis is the predicted Z score based on the gene expression differences.
Extended Data Fig. 4 |
Extended Data Fig. 4 |. Single cell RNA sequencing identifies enhanced activation of tumour infiltrating myeloid cells after ACSS2 inhibition.
a, Seurat plot of cell populations following subclustering of myeloid cells from clusters 3 and 4 from Fig. 5a. b, Heat map illustrating gene expression of the top five most highly expressed gene markers within each subcluster. c, Heatmapping of gene marker expression onto the myeloid cell subclusters. d, Volcano plot illustrating DEGs in VY-3-135 treated tumours of subcluster 0. P values were generated with a nonparametric Wilcoxon rank-sum test. e, GSEA of the top 20 functions and regulators in subcluster 0 that were significantly activated in VY-3-135 treated tumours. f, Volcano plot illustrating DEGs in subcluster 1 in VY-3-135 treated tumours. P values were generated with a nonparametric Wilcoxon rank-sum test. g, GSEA of the top 20 functions and regulators in subcluster 1 that were significantly activated in VY-3-135 treated tumours. Heat-mapping on bar plots represents -log10 FDR values. The number next to the bar displays the number (N) of genes within that regulator or function gene set that were altered. The x-axis is the predicted Z score based on the gene expression differences.
Extended Data Fig. 5 |
Extended Data Fig. 5 |. Gene markers used to identify the cell types within the subclusters of T cells and NK cells.
a, b, Heat-mapping of the relative expression of canonical genes used to distinguish T cells and NK cells within all five lymphocyte subclusters from Fig. 5d. c, Predicted distribution of NK, NKT, and Treg cells within the subclusters.
Extended Data Fig. 6 |
Extended Data Fig. 6 |. Lymphocytes express relatively high amounts of ACSS1 and oxidize acetate better than macrophages.
a, Representative dot plots displaying enrichment for CD8+ and CD4+ T cells from total splenocytes collected from mice. b, mRNA expression for macrophage markers of polarization. Data are presented as relative expression normalized to BMDM. n = 1 quantitation of mRNA expression. c, ACSS1 mRNA expression in T cells and macrophages. Data are presented as a mean ± SD. P values generated using two-way ANOVA Dunnett’s multiple comparisons test against CD8+ T cells. n.s. = not significant. n = 3 independent samples for T cells and n = 6 independent samples for macrophages. d, Stable isotope tracing of 0.1 versus 0.5 mM 13C2 acetate into T cells and macrophages for 1 h and LC-MS based analysis of citrate labeling. M + 2, M + 3, and M + 4 plots show the percent labeling of citrate by 13C2-acetate for each isotopologue. n = 2 independent cultures of CD8+ T cells and macrophages.
Extended Data Fig. 7 |
Extended Data Fig. 7 |. Acetate increases expression of cytokines and activation markers in T cells cultured in low glucose.
a, ACSS1, ACSS2 and ACSS3 expression in lymphocytes and monocytes from one male and one female healthy human donor. b, ACSS1 mRNA expression represented as normalized transcripts per kilobase million (nTPM) from a scRNA-seq analysis of normal human breast tissue. Where n ≥ 3 data are presented as a mean ± SEM. c, ACSS1 mRNA expression from a scRNA-seq analysis of human breast tumors. Violin plots with hashed lines representing median and dotted lines mark upper and lower quartiles. P values generated using log-rank test. d, Expression of degranulation and activation markers in human CD8+ T cells after stimulation in the presence of increasing concentrations of acetate and two different concentrations of glucose. Dotted lines represent expression levels in standard culture medium. n = 2 independent CD8+ T cell cultures. Data are presented as a percent of total CD8+ T cells. e, Glucose and acetate consumption by human CD8+ T cells during polyfunctional assay. Data are expressed as change in concentration during overnight stimulation. n.d. = not detected. n = 2 independent CD8+ T-cell cultures. Western blotting results were independently validated at least twice.
Figure 1.
Figure 1.. Inhibition of ACSS2 triggers stronger tumour growth inhibition in immune-competent mice compared to immune-deficient mice.
a, Diagram outlining the approach to testing inhibition of ACSS2 in immune-competent and immune-deficient tumour-bearing mice. VY-3-135 = ACSS2 inhibitor. sgAcss2 = single guide RNA targeting Acss2. NSG = NOD.Cg-Prkdcscid Il2rgtm1Wjl/SzJ. b-g, Allograft tumour growth in NSG, C57Bl/6, or BABL/c mice treated with VY-3-135. n = 8 mice per group. Adjusted p values are displayed on the graph and were generated using multiple two-sided Welch t-test. Values represent the mean tumour volume ± standard error of the means (SEM). h, Orthotopic allograft tumour growth of Brpkp110 cells in C57Bl/6 mice treated with VY-3-135. Adjusted p value is displayed on the graph generated using multiple two-sided Welch t-test. Values represent the mean tumour volume ± SEM. n = 5 mice per group. i and j, Orthotopic allograft tumour growth of Cas9 (WT) or two different sgAcss2 (Acss2-KO) Brpkp110 cell lines in NSG or C57Bl/6. Adjusted p values are displayed on the graph and were generated using multiple unpaired two-sided Welch t-test. Values represent the mean tumour volume ± SEM. NSG, n = 10 mice per group. C57Bl/6, n = 7 mice per group for Cas9 and n = 5 mice per group for each Acss2-KO.
Figure 2.
Figure 2.. T-cells and NK-cells are necessary for suppression of Acss2-KO tumour growth.
a, Syngeneic allograft tumour growth of WT versus Acss2-KO Brpkp110 tumours in C57Bl/6 mice depleted of both CD4+ and CD8+ T-cells or treated with an isotype control IgG antibody. Values represent the mean tumour volume ± SEM. P values generated using two-way ANOVA with Dunnett’s multiple comparisons test comparing all groups to Cas9 + IgG. n = 10 mice per group. b,c, Syngeneic allograft tumour growth of Brpkp110 WT or Acss2-KO cells grown in C57Bl/6 mice individually depleted of CD4+ (b) or CD8+ (c) T-cells or treated with isotype control IgG. n = 5 mice per group. Values represent the mean tumour volume ± SEM. P values generated using two-way ANOVA with Dunnett’s multiple comparisons test against Cas9 + IgG. n = 5 mice per group. d, Syngeneic allograft tumour growth of A7C11 WT or Acss2-KO tumours in C57Bl/6 mice depleted of both CD4+ and CD8+ T-cells or treated with an isotype control IgG antibody. Values represent the mean tumour volume ± SEM. P values generated using two-way ANOVA with Dunnett’s multiple comparisons test against Cas9 + IgG. n = 5 mice per group. e, Syngeneic allograft tumour growth of Brpkp110 WT or Acss2-KO tumours in C57Bl/6 mice depleted of NK-cells or treated with an isotype control IgG antibody. Values represent the mean tumour volume ± SEM. P values generated using two-way ANOVA with Dunnett’s multiple comparisons test against Cas9 + IgG. n = 8 mice per group. f, Final tumour weights from data in (e). Values represent the mean tumour volume ± SEM. P values generated using two-way ANOVA with Dunnett’s multiple comparisons test against Cas9 + IgG. n = 8 tumors for all groups, except Cas9 + αNK n = 6 tumors. g, Schematic detailing tumour rechallenge experiments. h,i, Syngeneic allograft tumour growth of WT Brpkp110 or T11 cells in C57Bl/6 or BALB/c mice that had previously cleared Acss2-KO tumours or age-matched unchallenged mice. Values represent the mean tumour volume ± SEM. P values generated using two-sided Fisher’s exact test. n = 5 Brpkp110 re-challenge mice, n = 4 Brpkp110 naïve mice. T11 tumors n = 8 mice.
Figure 3.
Figure 3.. ACSS2 is dispensable in T-cells for anti-tumour immune responses.
a, Acss2−/− mice possess a one base pair insertion into exon 3 at the indicated (red triangle) position causing a frameshift mutation. b, Representative sequences from WT and KO mice showing the adenine base pair insertion. c, ACSS2 protein expression in liver lysates from WT versus Acss2-KO mice. n = 4 mice per group. d, Immunohistochemistry staining for ACSS2 in WT and Acss2-KO mouse liver and colon. e, sgAcss2 tumours are unable to grow in Acss2-KO mice. Values represent the mean tumour volume ± SEM. P values generated using two-way ANOVA with Dunnett’s multiple comparisons test against Cas9 in WT mice. Cas9 and sgAcss2 in WT n = 8 mice, sgAcss2 in KO n = 5 mice. f, Tumour growth studies in chimaera mice reconstituted with WT or Acss2-KO mouse bone marrow. Values represent the mean tumour volume ± SEM. P values generated using two-way ANOVA with Dunnett’s multiple comparisons test against Cas9 + KO BM. n = 10 mice per group. g, Final tumour weights from the mice in panel f. P values generated using two-tailed Mann-Whitney U test. Values represent the mean tumour volume ± SEM. n = 8 tumors Cas9 + KO BM, n = 9 tumors sgAcss2 + KO BM, n = 10 tumors sgAcss2 WT BM. Western blotting results were independently validated twice. Immunohistochemistry images are representative of an image from five independent tissue samples.
Figure 4.
Figure 4.. Inhibition of ACSS2 synergizes with chemotherapy in breast tumours.
a, Seurat clustering of cell populations within Brpkp110 tumours highlighting the tumour cell clusters 0 and 1. b, All upregulated genes in Brpkp110 tumour cells treated with VY-3-135 versus vehicle. c, Heatmapping of the relative gene expression of proliferation markers across cell populations. d, Heat map illustrating top 10 gene markers for each tumour cell population from panel a. e, Average and percent expression of proliferative markers in cluster 0 versus cluster 1. f, GSEA of different functions between tumour cell cluster 0 and cluster 1. g-i, Syngeneic allograft tumour growth of Brpkp110 cells in C57Bl/6 mice treated with vehicle, palbociclib, doxorubicin, VY-3-135, paclitaxel, and combinations thereof starting at day 10 post injection. Values represent the mean tumour volume ± SEM. P values generated using 2-way ANOVA and Dunnett’s multiple comparisons test compared to vehicle. n = 10 vehicle mice, n = 8 mice in all other groups.
Figure 5.
Figure 5.. Single cell RNA sequencing identifies enhanced activation of tumour-infiltrating T-cells upon ACSS2 inhibition.
a, Seurat clustering of cell populations within Brpkp110 tumours highlighting lymphocyte cluster 2. b,c, Upregulated genes in lymphocytes (b) and myeloid cells (c) from Brpkp110 tumours treated with VY-3-135 for seven days. d, Seurat plot of cell populations following subclustering of lymphocytes from cluster 2. e, Heat map illustrating gene expression of the top five most highly expressed gene markers within each lymphocyte subcluster. f, Volcano plot illustrating DEGs in VY-3-135 treated tumours of subcluster 0. P values were generated with a non-parametric Wilcoxon rank sum test. g, IPA of the top 20 functions and regulators in subcluster 0 that were significantly activated by VY-3-135 treatment. h, Volcano plot illustrating DEGs in subcluster 1 in VY-3-135 treated tumours. P values were generated with a non-parametric Wilcoxon rank sum test. i, GSEA of the top 20 functions and regulators in subcluster 1 that were significantly activated in ACSS2 inhibitor treated tumours. Heat mapping on bar plots represents -log10 FDR values. The number next to the bar displays the number (N) of genes within that regulator or function gene set that were altered. The x-axis is the predicted Z score based on the gene expression differences.
Figure 6.
Figure 6.. Phenotypic marker analysis of tumour-infiltrating leukocytes and splenocytes from VY-3-135 treated tumours.
a, CCL5 protein expression in Brpkp110 tumours treated with VY-3-135. Bars represent the mean tumour volume ± S.D. P values generated using two-tailed Mann-Whitney U test. n = 5 tumor lysates. b, Correlation of ACSS2 and CCL5 expression in TNBC patient survival. Data obtained from METABRIC and TCGA databases. P values generated by a logrank test. c, Schematic of VY-3-135 treatment of tumour-bearing mice for flow cytometry analysis. d-h, Flow cytometry analysis of phenotypic markers on tumour-infiltrating leukocytes and splenic leukocytes from Brpkp110 tumour-bearing mice treated with VY-3-135 for 7 days and 28 days. P values were generated using a two-sided t test. Values represent the mean fluorescence intensity (MFI) ± SEM. Panels d-e n = 5 vehicle mice, n = 4 VY-3-135 mice; Panels f-h n = 3 vehicle mice, n = 4 VY-3-135 mice.
Figure 7.
Figure 7.. CD8+ T-cells and NK-cells readily oxidize acetate in a time and concentration dependent manner.
a, Acetate uptake and release from Cas9 and sgAcss2 Brpkp110 cells and Cas9 Brpkp110 treated with VY-3-135. n = 3 culture medium extracts. P values generated using two-way ANOVA Dunnett’s multiple comparisons test comparing all groups to Cas9. Values represent net acetate exchange ± SEM. b, Immunoblot for ACSS1 and ACSS2 expression in peripheral blood mononuclear cells (PBMC). Mouse liver lysates were used as a loading control for high ACSS2 low ACSS1 expression. n = 3 independent mice per group. c, Diagram displaying ACSS1-dependent 13C2-acetate stable isotope tracing into citrate and expected isotoplogue labelling patterns. d-g, Stable isotope tracing of 0.1 versus 0.5 mM 13C2-acetate into CD8+ T-cells from wild type (WT) versus Acss2-KO mice. Values represent the mass isotopologue distribution ± SEM for 13C2-acetate in metabolites at 1h and 2h after exposure. Where indicated, samples were treated with VY-3-135 (+Inh). n = 3 independent CD8+ T-cell cultures. CD8+ T-cells incubated for 2h at 100μM and 500μM n = 6 independent CD8+ T-cell cultures. h-k, Stable isotope tracing of 0.1 versus 0.5 mM 13C2-acetate into NK-cells from C57Bl/6 mice. Mass isotopologue distribution patterns ± SEM by 13C2-acetate in metabolites at 3h after exposure. n = 3 independent NK-cell cultures. l, Percent labelling of palmitate by 0.1 versus 0.5 mM 13C2-acetate into splenic CD8+ T-cells and NK cells. Values represent the mass isotopologue distribution ± SEM. n = 3 independent CD8+ T-cell and NK cell cultures.
Figure 8.
Figure 8.. Acetate improves human CD8+ T-cell proliferation and functionality when glucose is limited.
a,b, CD8+ T-cell proliferation in the presence of high (10 mM) and low (1 mM) glucose and high (0.5 mM) and low (0.1 mM) acetate. n = 2 CD8+ T-cell cultures. c, Work flow for analysis of polyfunctionality in human CD8+ T-cells. d, Expression of degranulation and activation markers on CD8+ T-cells after stimulation in the presence of increasing concentrations of acetate and two different concentrations of glucose. Dotted line represents expression levels in standard culture medium with 10 mM glucose and 0.1 mM acetate. n = 2 CD8+ T-cell cultures. Values are plotted as percent of total CD8+ T-cells. e, Percent of CD8+ T-cells displaying polyfunctionality after stimulation in different concentrations of acetate and glucose. n = 2 CD8+ T-cell cultures. Values are plotted as percent of total CD8+ T-cells. f, Splenocyte cytotoxicity assay displaying the mean percent of Brpkp110 cells remaining after 3 days of co-culture with total splenocytes at the indicated ratios. Black circles represent WT (Cas9) Brpkp110 cells and red circles represent Acss2-KO (sgAcss2) Brpkp110. n = 8 co-cultures of cells. Data are presented as a mean ± SD. P values generated using one-way ANOVA and Dunnett’s multiple comparisons test compared to 1:10 splenocyte:Brpkp110 ratio. g, Schematic cartoon illustrating how targeting acetate metabolism promotes an anti-tumour immune response.

References

Main References:

    1. Bianchini G, Balko JM, Mayer IA, Sanders ME & Gianni L Triple-negative breast cancer: challenges and opportunities of a heterogeneous disease. Nat Rev Clin Oncol 13, 674–690 (2016). - PMC - PubMed
    1. Atezolizumab Combo Approved for PD-L1-positive TNBC. Cancer Discov 9, OF2 (2019). - PubMed
    1. Emens LA et al. First-line atezolizumab plus nab-paclitaxel for unresectable, locally advanced, or metastatic triple-negative breast cancer: IMpassion130 final overall survival analysis. Ann Oncol 32, 983–993 (2021). - PubMed
    1. Nanda R et al. Pembrolizumab in Patients With Advanced Triple-Negative Breast Cancer: Phase Ib KEYNOTE-012 Study. J Clin Oncol 34, 2460–2467 (2016). - PMC - PubMed
    1. Adams S et al. Pembrolizumab monotherapy for previously treated metastatic triple-negative breast cancer: cohort A of the phase II KEYNOTE-086 study. Ann Oncol 30, 397–404 (2019). - PubMed

Methods Only References

    1. Mocikat R et al. Natural killer cells activated by MHC class I(low) targets prime dendritic cells to induce protective CD8 T cell responses. Immunity 19, 561–569 (2003). - PubMed
    1. Allegrezza MJ et al. Trametinib Drives T-cell-Dependent Control of KRAS-Mutated Tumors by Inhibiting Pathological Myelopoiesis. Cancer Res 76, 6253–6265 (2016). - PMC - PubMed
    1. Rutkowski MR et al. Initiation of metastatic breast carcinoma by targeting of the ductal epithelium with adenovirus-cre: a novel transgenic mouse model of breast cancer. J Vis Exp (2014). - PMC - PubMed
    1. Rutkowski MR et al. Microbially driven TLR5-dependent signaling governs distal malignant progression through tumor-promoting inflammation. Cancer Cell 27, 27–40 (2015). - PMC - PubMed
    1. Sheen MR et al. Constitutively activated PI3K accelerates tumor initiation and modifies histopathology of breast cancer. Oncogenesis 5, e267 (2016). - PMC - PubMed

Publication types

LinkOut - more resources