. 2023 Nov;17(11):2047-2057.
doi: 10.1038/s41396-023-01515-9. Epub 2023 Sep 18.

Frequency of change determines effectiveness of microbial response strategies

Affiliations

Frequency of change determines effectiveness of microbial response strategies

Shengjie Li et al. ISME J. 2023 Nov.

Abstract

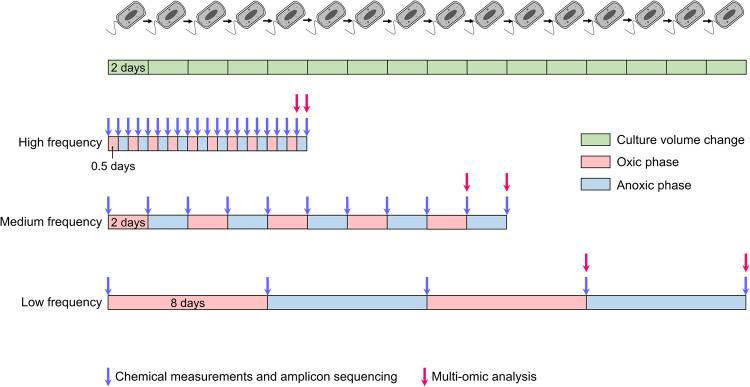
Nature challenges microbes with change at different frequencies and demands an effective response for survival. Here, we used controlled laboratory experiments to investigate the effectiveness of different response strategies, such as post-translational modification, transcriptional regulation, and specialized versus adaptable metabolisms. For this, we inoculated replicated chemostats with an enrichment culture obtained from sulfidic stream microbiomes 16 weeks prior. The chemostats were submitted to alternatingly oxic and anoxic conditions at three frequencies, with periods of 1, 4 and 16 days. The microbial response was recorded with 16S rRNA gene amplicon sequencing, shotgun metagenomics, transcriptomics and proteomics. Metagenomics resolved provisional genomes of all abundant bacterial populations, mainly affiliated with Proteobacteria and Bacteroidetes. Almost all these populations maintained a steady growth rate under both redox conditions at all three frequencies of change. Our results supported three conclusions: (1) Oscillating oxic/anoxic conditions selected for generalistic species, rather than species specializing in only a single condition. (2) A high frequency of change selected for strong codon usage bias. (3) Alignment of transcriptomes and proteomes required multiple generations and was dependent on a low frequency of change.


Conflict of interest statement

The authors declare no competing interests.

Figures

Fig. 1
Fig. 1. Experimental design of this study.
Alternating phases of oxic and anoxic conditions were established in the three sets of triplicated chemostats. The phases differed in length for each set, but the dilution rate was the same for all chemostats.
Fig. 2
Fig. 2. Concentrations of acetate, ammonia, sulfate and sulfide during oxic and anoxic phases at different frequencies.
Triplicates are indicated by black, red and blue lines and symbols. The green bar at the top shows chemostat dilutions. In the second bar, oxic and anoxic phases are shown in red and blue respectively.
Fig. 3
Fig. 3. Community dynamics in the chemostats.
a Change in relative sequence abundances of the ten most abundant populations (amplicon sequence variants, ASVs) in chemostat incubations, based on 16S rRNA gene amplicon sequencing. Outcomes of triplicated experiments are shown individually for each frequency. The green bar at the top enumerates chemostat dilutions. In the second bar, oxic and anoxic phases are shown in red and blue respectively. b Non-metric multidimensional scaling (NMDS) (based on Bray–Curtis distances) of all samples collected along the chemostat incubations and (c) only samples collected during the final oxic and the final anoxic phases. Colored ellipses show variation among samples of the two phases of each treatment obtained with the “ordiellipse” function from the “vegan” package in R.
Fig. 4
Fig. 4. Enriched populations associated with metagenome-assembled genomes (MAGs) in the three sets of chemostats during the final oxic phase and the final anoxic phase.
a Metabolic potential, taxonomy and relative sequence abundance of the populations (Supplementary Tables 5–31). R1, R2 and R3 represent the chemostat triplicates. Fast copiotrophs, slow copiotrophs and oligotrophs are indicated by blue, yellow and pink taxon names respectively. “d” represents the minimum doubling time predicted by gRodon [40] (Supplementary Table 33). b iRep values (Supplementary Table 32) of the populations. c Relative abundance of fast copiotrophs, slow copiotrophs and oligotrophs in the three sets of chemostats. Horizontal lines show significant differences determined in two-sample two-sided t-tests, with p values < 0.01 indicated with “**” and <0.001 indicated with “***”.
Fig. 5
Fig. 5. Change in transcriptomes and proteomes in the three sets of chemostats.
a Fold change in activity of genes associated with key metabolic subsystems (Supplementary Tables 35–42) from the final oxic phase to the final anoxic phase. Each data point is associated with one of 26 MAGs. Results are shown for transcriptomes (left) and proteomes (right), each at the three different frequencies of change. Significances, determined with one-sample two-sided t-tests, are indicated, with p values < 0.05 as “*”, <0.01 as “**” and <0.001 as “***”. The enzymes involved in the analysis of each metabolism were indicated below the figure. b Turnover of transcriptomes across phases and replicates (Supplementary Table 43). Each dot shows overall transcriptome turnover between phases and replicates for a single MAG. c Turnover of proteomes across phases and replicates (Supplementary Table 43). Each dot shows overall proteome turnover between phases and replicates for a single MAG. d Pearson correlation coefficients of transcriptome differences and proteome differences between phases for a single MAG (Supplementary Table 44). Each dot shows the correlation between the transcriptome and the proteome for a single MAG. Horizontal lines in (bd) show significant differences determined with two-sample two-sided t-tests.

References

    1. Thaiss CA, Zeevi D, Levy M, Zilberman-Schapira G, Suez J, Tengeler AC, et al. Transkingdom control of microbiota diurnal oscillations promotes metabolic homeostasis. Cell. 2014;159:514–29. - PubMed
    1. Zarrinpar A, Chaix A, Yooseph S, Panda S. Diet and feeding pattern affect the diurnal dynamics of the gut microbiome. Cell Metab. 2014;20:1006–17. - PMC - PubMed
    1. Mitsui A, Kumazawa S, Takahashi A, Ikemoto H, Cao S, Arai T. Strategy by which nitrogen-fixing unicellular cyanobacteria grow photoautotrophically. Nature. 1986;323:720–2.
    1. Golden SS, Canales SR. Cyanobacterial circadian clocks—timing is everything. Nat Rev Microbiol. 2003;1:191–9. - PubMed
    1. Diao M, Sinnige R, Kalbitz K, Huisman J, Muyzer G. Succession of bacterial communities in a seasonally stratified lake with an anoxic and sulfidic hypolimnion. Front Microbiol. 2017;8:2511. - PMC - PubMed

Publication types

Substances