. 2023 Sep 18;24(1):549.
doi: 10.1186/s12864-023-09639-0.

Identification, characterization and expression profiles of E2 and E3 gene superfamilies during the development of tetrasporophytes in Gracilariopsis lemaneiformis (Rhodophyta)

Affiliations

Identification, characterization and expression profiles of E2 and E3 gene superfamilies during the development of tetrasporophytes in Gracilariopsis lemaneiformis (Rhodophyta)

Qiong Wu et al. BMC Genomics. .

Abstract

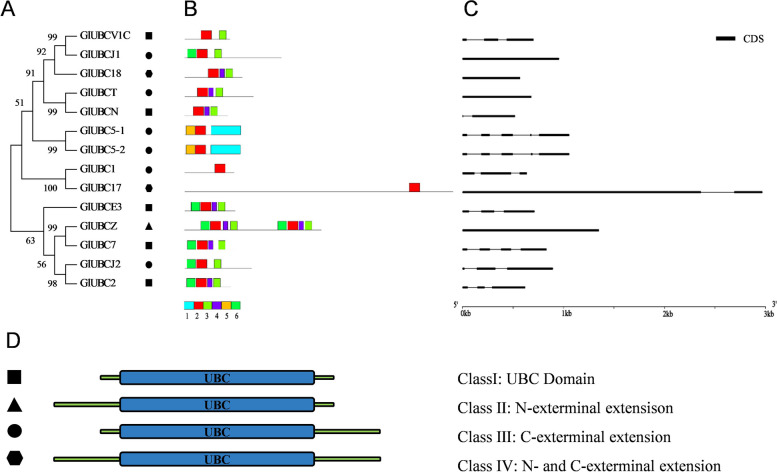
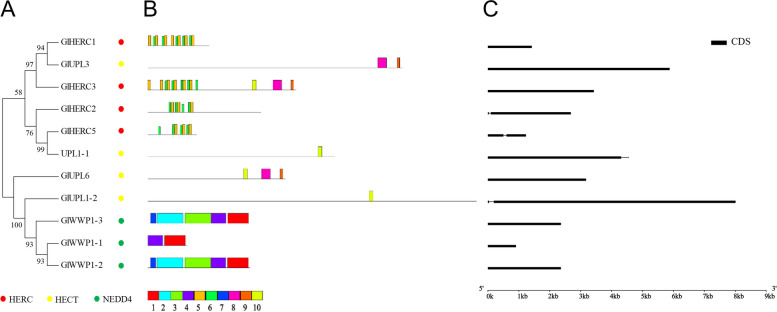
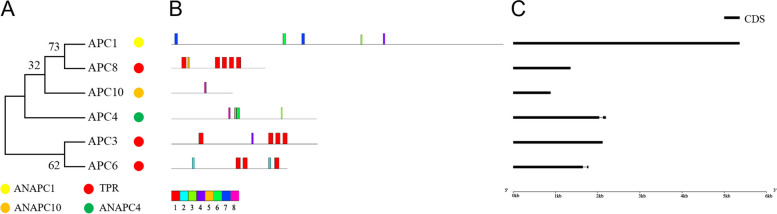
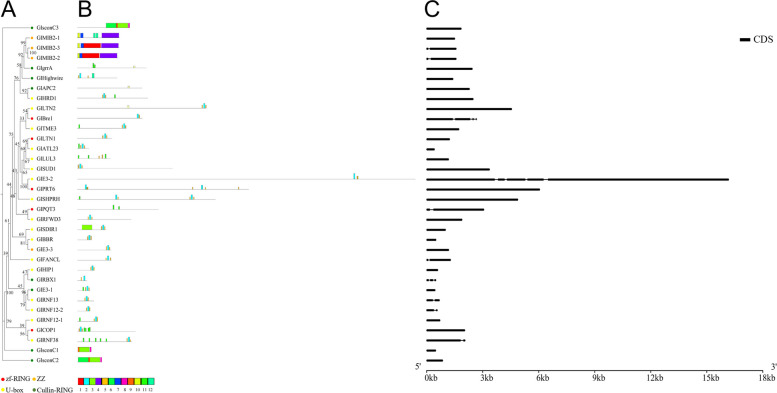
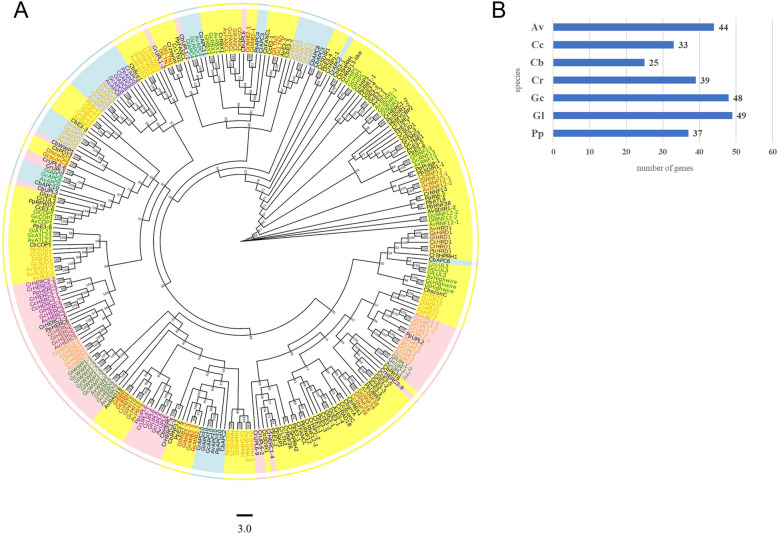
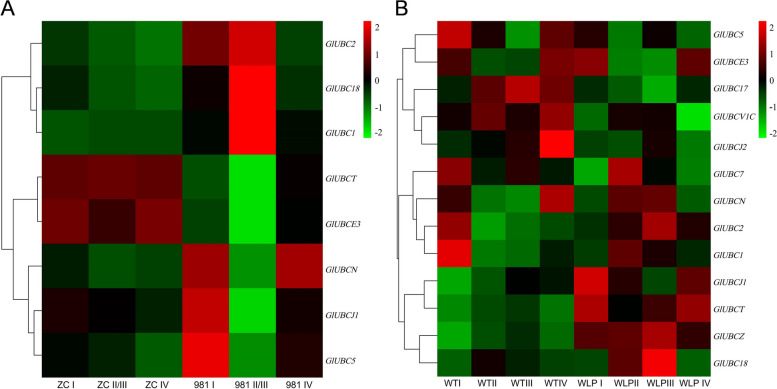
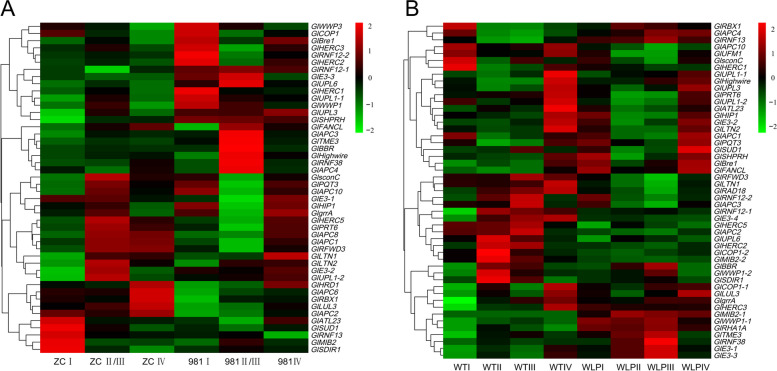
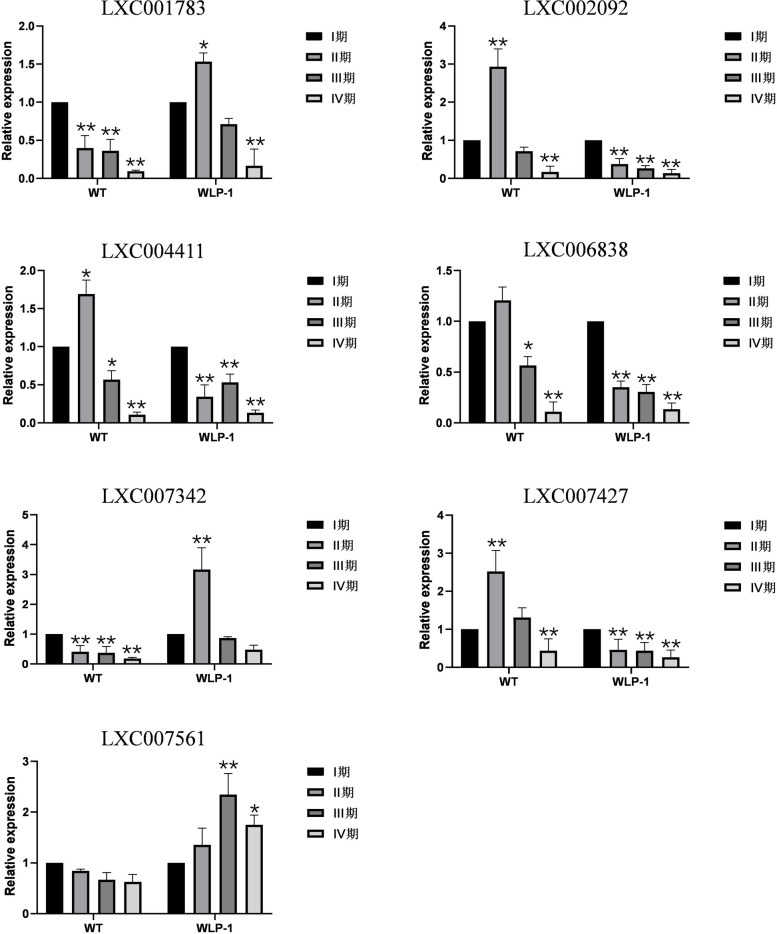
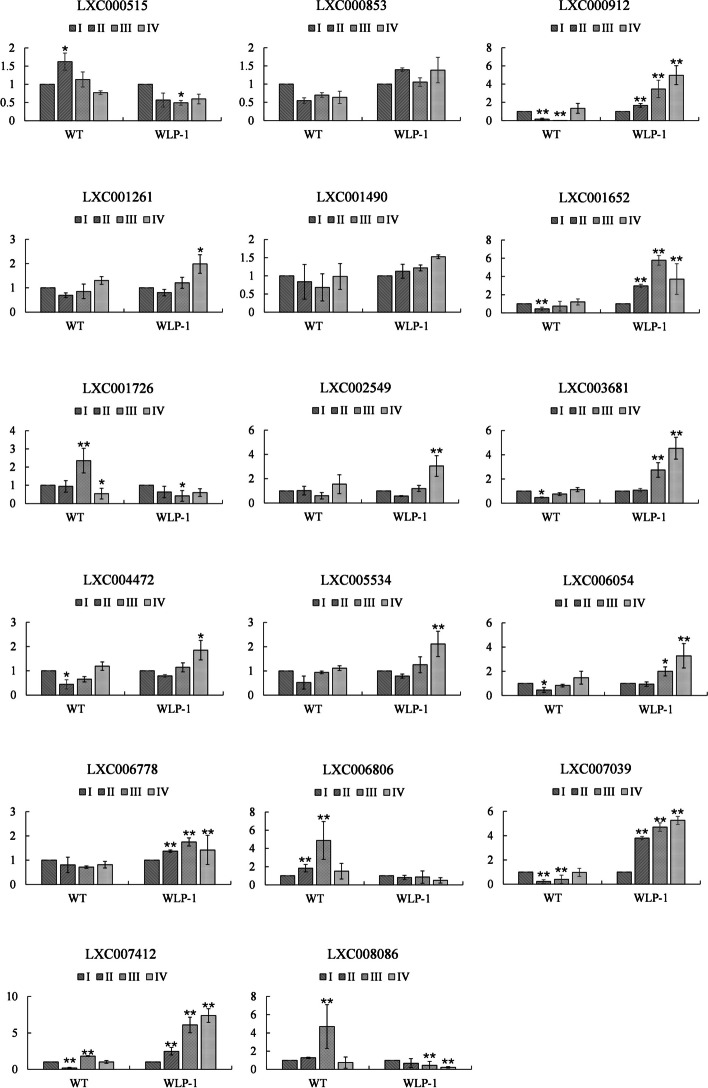
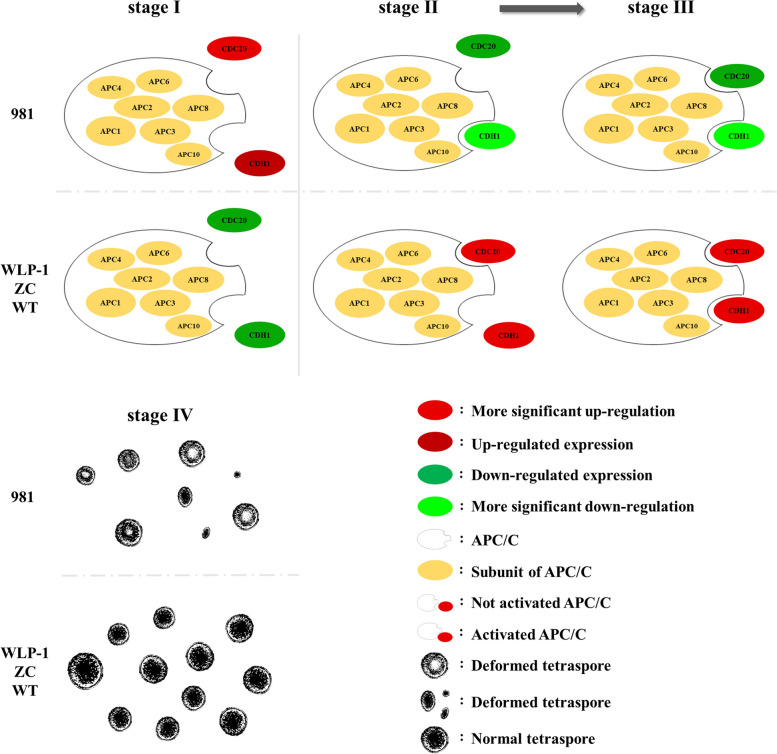
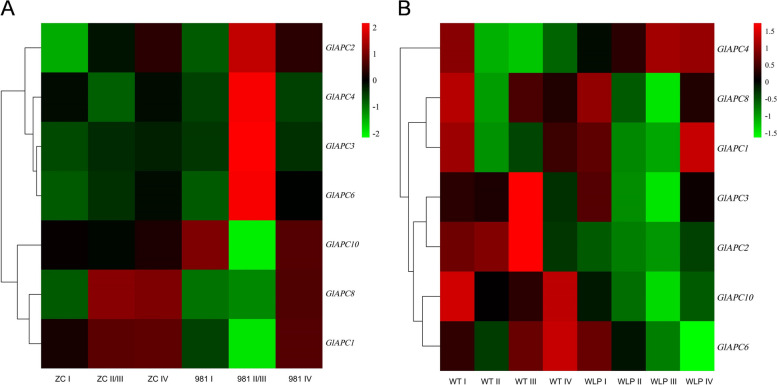
E2 ubiquitin conjugating enzymes and E3 ubiquitin ligases play important roles in the growth and development of plants and animals. To date, the systematic analysis of E2 and E3 genes in Rhodophyta is limited. In this study, 14 E2 genes and 51 E3 genes were identified in Gracilariopsis lemaneiformis, an economically important red alga. E2 genes were classified into four classes according to the structure of the conserved domain, UBC. E3 genes were classified into 12 subfamilies according to individual conserved domains. A phylogenetic tree of seven algae species showed that functional differentiation of RING-type E3s was the highest, and the similarity between orthologous genes was high except in Chlamydomonas reinhardtii and Chara braunii. RNA-seq data analysis showed significant differential expression levels of E2 and E3 genes under the life stages of tetraspore formation and release, especially GlUBCN and GlAPC3. According to GO and KEGG analysis of two transcriptomes, GlUBCN and GlAPC3 were involved in ubiquitin-mediated proteolysis, and other subunits of the anaphase promoting complex or cyclosome (APC/C) and its activators GlCDC20 and GlCDH1 were also enriched into this process. The CDH1 and CDC20 in 981 were down-regulated during tetraspores formation and release, with the down-regulation of CDH1 being particularly significant; CDH1 and CDC20 in WLP-1, ZC, and WT were up-regulated during tetraspores formation and release, with CDC20 being more significantly up-regulated. Therefore, GlCDH1, rather than GlCDC20, in '981' might play the leading role in the activation of the APC/C, and GlCDC20 might play the leading role rather than GlCDH1 in strains WLP-1, ZC and wild type. The low fertility of cultivar 981 might be highly correlated with the inactivity of activators CDH1 and CDC20. This study provided a basic and comprehensive understanding of characteristic of E2 and E3 genes in Gp. lemaneiformis and set a foundation for further understanding of E2 ubiquitin conjugating enzymes and E3 ubiquitin ligase in regulating tetrasporophytes development of Gp. lemaneiformis.

Keywords: E2 ubiquitin conjugating enzymes; E3 ubiquitin ligases; Gracilariopsis lemaneiformis; Tetrasporophytes development and tetraspores release.


Conflict of interest statement

The authors declare no competing interests.

Figures

Fig. 1
Fig. 1
The life story of Gp. lemaneiformis
Fig. 2
Fig. 2
PCR amplification products of 13 E2 genes of wild type of Gp. lemaneiformis. M: marker. Number 1–13 indicated different E2 ubiquitin activating enzyme genes, and the left were DNA sequences, and the right were cDNA sequences
Fig. 3
Fig. 3
PCR amplification products of 48 E3 genes’ cDNA of wild type of Gp. lemaneiformis. M: marker. Number 1–48 indicated cDNA sequences of different E3 ubiquitin ligase genes
Fig. 4
Fig. 4
E2 (A) and E3 (B) gene localization on chromosomes of Gp. lemaneiformis. The scale bar beside the chromosome indicated the length in megabases (Mb)
Fig. 5
Fig. 5
The phylogenetic tree, gene structures and protein motifs of Gp. lemaneiformis E2 ubiquitin conjugating enzymes. A The phylogenetic tree. B Protein motifs. The colorful boxes delineated different motifs. C Gene structures. Exons were displayed using black bars. Black lines denoted introns. D Classification of E2 ubiquitin conjugating enzymes. The proteins were divided into four classes: class I, class II, class III, class IV, and represented by different shapes. The tree was constructed by MEGA7 using ML with 1000 bootraps
Fig. 6
Fig. 6
The phylogenetic tree, protein motifs and gene structures of HECT-type E3 ubiquitin ligases in Gp. lemaneiformis. A The phylogenetic tree. B Protein motifs. The colorful boxes delineated different motifs. C Gene structures. Exons were displayed using black bars. Black lines denoted introns
Fig. 7
Fig. 7
The phylogenetic tree, protein motifs and gene structures of APC/C-type E3 ubiquitin ligases in Gp. lemaneiformis. A The phylogenetic tree. B Protein motifs. The colorful boxes delineated different motifs. C Gene structures. Exons were displayed using black bars. Black lines denoted introns
Fig. 8
Fig. 8
The phylogenetic tree, protein motifs and gene structures of RING-type E3 ubiquitin ligases in Gp. lemaneiformis. A The phylogenetic tree. B Protein motifs. The colorful boxes delineated different motifs. C Gene structures. Exons were displayed using black bars. Black lines denoted introns
Fig. 9
Fig. 9
Phylogenetic and evolutionary analysis of E3 genes family in seven species of algae. A The phylogenetic tree. B The number of E3 genes in the seven algae. Av, Agarophyton vermiculophylla, Cb, Chara braunii, Cc, Chondrus crispus, Cr, Chlamydomonas reinhardtii, Gc, Gracilariopsis chorda, Gl, Gracilariopsis lemaneiformis, Pp, Porphyridium purpureum. The background of yellow, pink and blue represented RING-type, HECT-type, and APC/C E3 ubiquitin ligases, respectively. The clustering analysis was based on 1000 replications for increasing the credibility of the bootstrap value
Fig. 10
Fig. 10
The cis-elements of promoter region (A) and quantity statistics (B) of E2 genes in Gp. lemaneiformis. The 2 kb upstream of coding sequence of 14 E2 genes were predicted by the PlantCARE. The different colored blocks denoted different type of cis-elements
Fig. 11
Fig. 11
The cis-elements of promoter region (A) and quantity statistics (B) of E3 genes in Gp. lemaneiformis. The 2 kb upstream of coding sequence of 51 E3 genes were predicted by the PlantCARE. The different colored blocks denoted different typical of cis-elements
Fig. 12
Fig. 12
Analysis of the expression patterns of E2 genes in Gp. lemaneiformis during different stages of tetrasporophytes development. A The heatmap of 981 and ZC on three stages (stage II and III were merged) of tetrasporophytes development. B The heatmap of WLP-1 and WT on four stages of tetrasporophytes development. The color bar represents log2 expression levels (FPKM), and the lower expression of genes was shown with green shades as well as higher expression of genes was shown using red shades. The tree on the left represents clustering result of genes expression pattern
Fig. 13
Fig. 13
Analysis of the expression patterns of E3 genes in Gp. lemaneiformis during different stages of tetrasporophytes development. A The heatmap of 981 and ZC on three stages (stage II and III were merged) of tetrasporophytes development. B The heatmap of WLP-1 and WT on four stages of tetrasporophytes development. The color bar represents log2 expression levels (FPKM), and the lower expression of genes was shown with green shades as well as higher expression of genes was shown using red shades. The tree on the left represents clustering result of genes expression pattern
Fig. 14
Fig. 14
Gene expression level verification of E2 genes based on qRT-PCR. Error bars were standard deviations from the biologic replicates
Fig. 15
Fig. 15
Gene expression level verification of E3 genes based on qRT-PCR. Error bars are standard deviations from the biologic replicates
Fig. 16
Fig. 16
Expression patterns of CDH1 and CDC20 in Gp. lemaneiformis during different stages of tetrasporophytes development. The color bar represented log2 expression levels (FPKM). A Heatmap of CDH1 and CDC20 in cultivars 981 and ZC (stage II and III were merged). B Heatmap of CDH1 and CDC20 in strains WLP-1 and WT. The color bar represented log2 expression levels (FPKM), and the lower expression of genes was shown with green shades as well as higher expression of genes was shown using red shades. The tree on the left represented clustering result of genes expression pattern
Fig. 17
Fig. 17
The putative regulation of APC/C CD20/CDH1 during tetrasporophyte development in Gp. lemaneiformis
Fig. 18
Fig. 18
Expression patterns of APC/C subunits in Gp. lemaneiformis during different stages of tetrasporophytes development. A Heatmap of CDH1 and CDC20 in cultivars 981 and ZC (stage II and III were merged). B Heatmap of CDH1 and CDC20 in strains WLP-1 and WT. The color bar represented log2 expression levels (FPKM), and the lower expression of genes was shown with green shades as well as higher expression of genes was shown using red shades. The tree on the left represented clustering result of genes expression pattern

Similar articles

Cited by

References

    1. Pickart CM. Mechanisms underlying ubiquitination. Annu Rev Biochem. 2001;70:503–533. - PubMed
    1. Hershko A, Ciechanover A. The ubiquitin system. Annu Rev Biochem. 1998;67:425–479. - PubMed
    1. Finley D. Recognition and processing of ubiquitin-protein conjugates by the proteasome. Annu Rev Biochem. 2009;78:477–513. - PMC - PubMed
    1. Williamson A, Banerjee S, Zhu X, Philipp I, Iavarone AT, Rape M. Regulation of ubiquitin chain initiation to control the timing of substrate degradation. Mol Cell. 2011;42:744–757. - PMC - PubMed
    1. O'Connor HF, Huibregtse JM. Enzyme-substrate relationships in the ubiquitin system: approaches for identifying substrates of ubiquitin ligases. Cell Mol Life Sci. 2017;74(18):3363–3375. - PMC - PubMed

LinkOut - more resources