. 2024 Feb;20(2):311-328.
doi: 10.1080/15548627.2023.2256135. Epub 2024 Jan 25.

CSNK1A1/CK1α suppresses autoimmunity by restraining the CGAS-STING1 signaling

Affiliations

CSNK1A1/CK1α suppresses autoimmunity by restraining the CGAS-STING1 signaling

Mingyu Pan et al. Autophagy. 2024 Feb.

Abstract

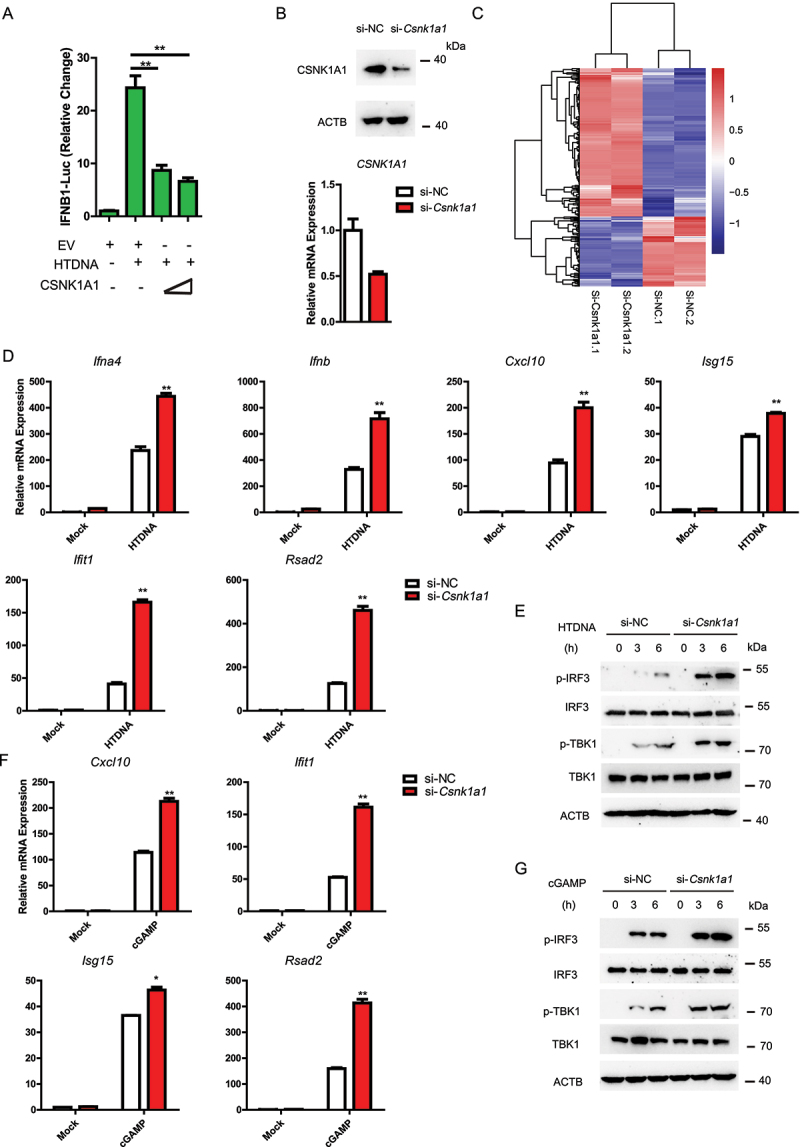
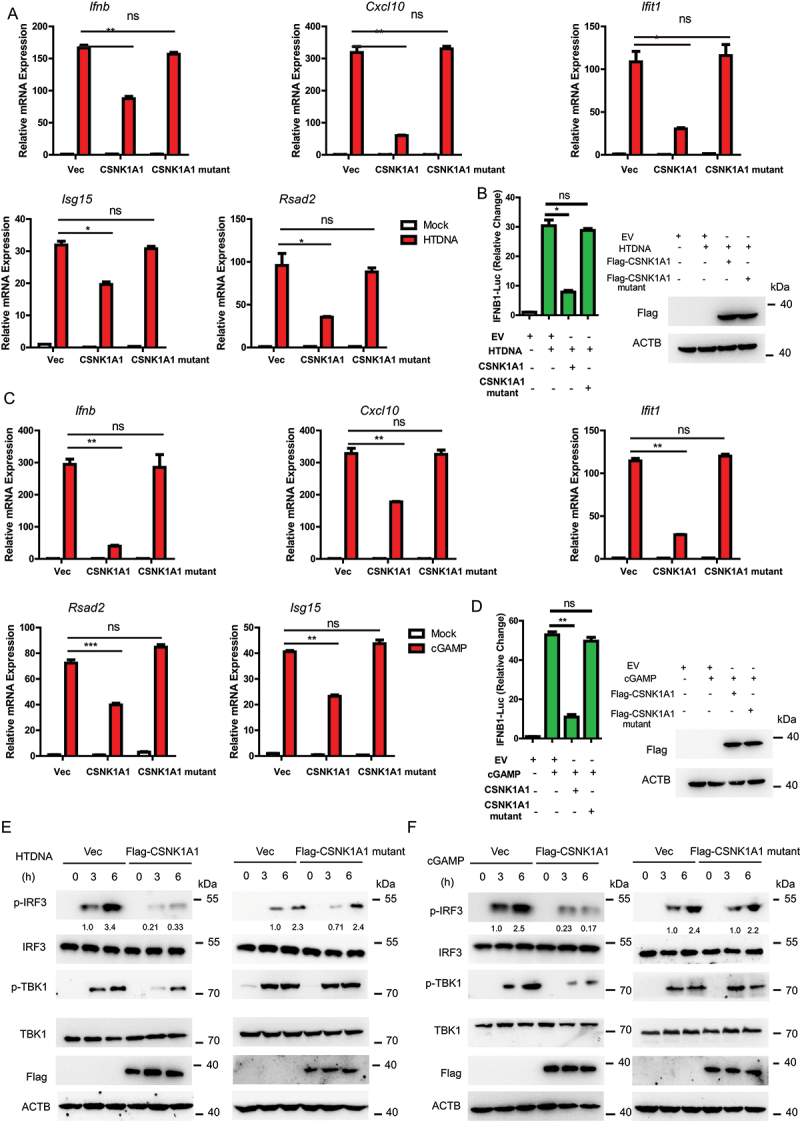
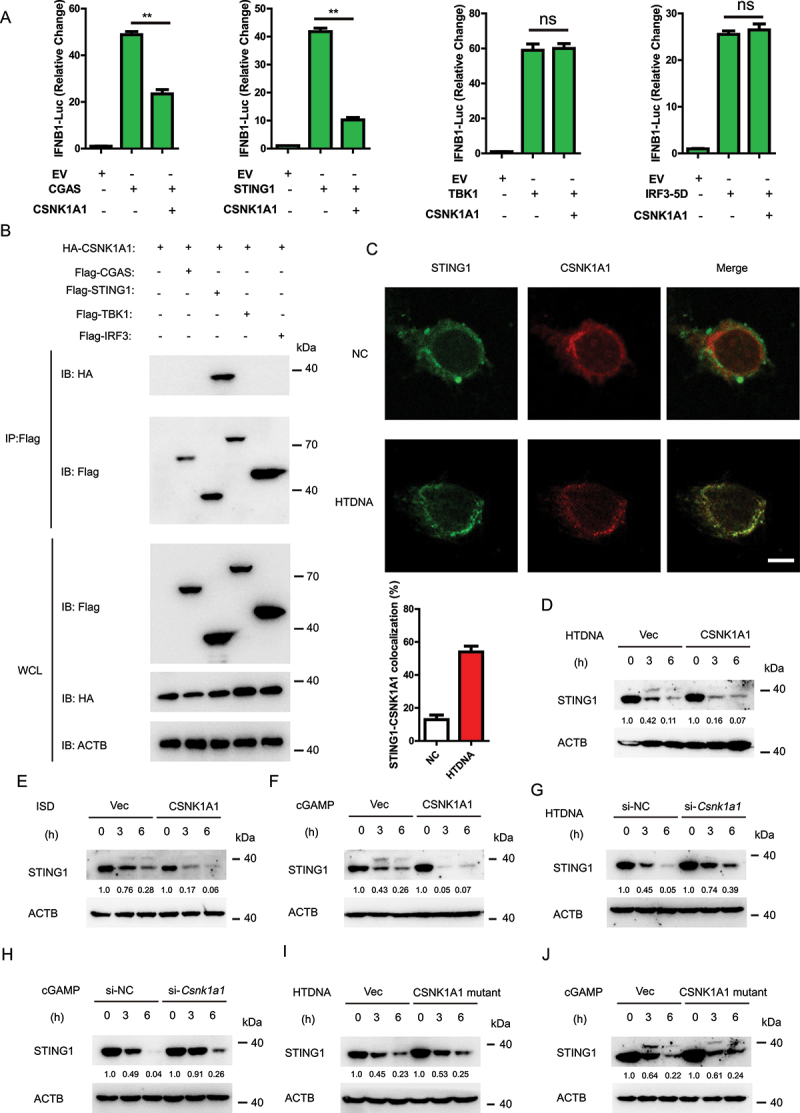
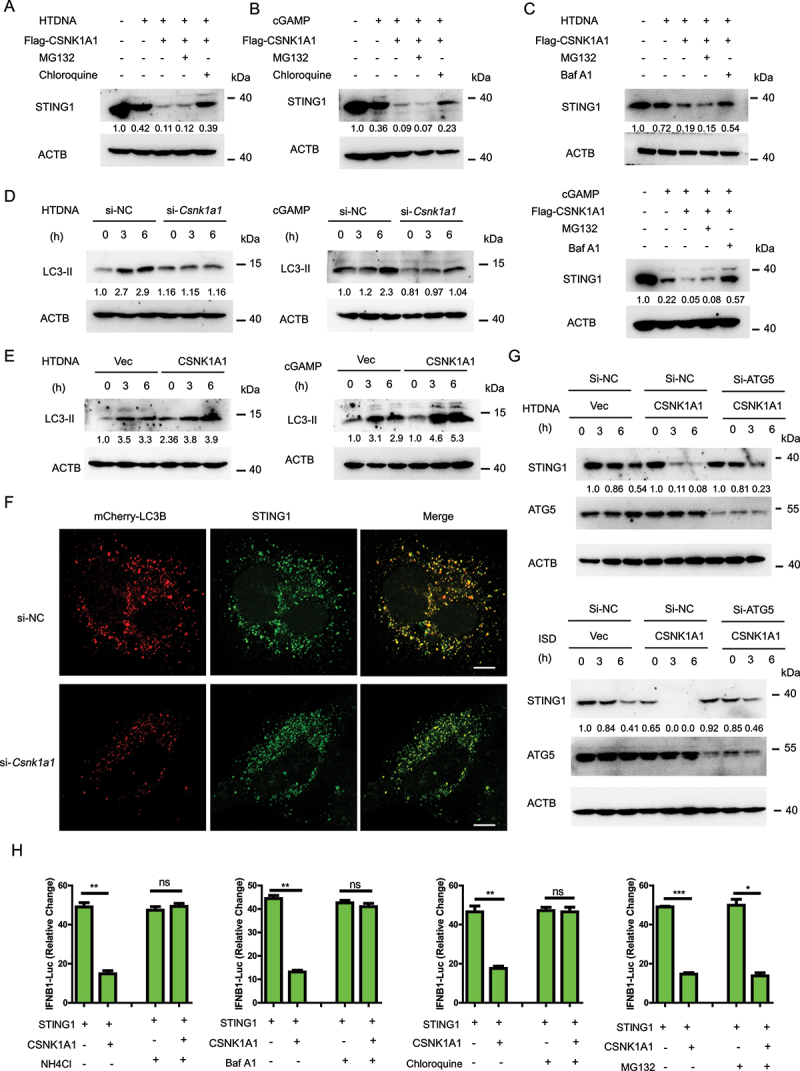
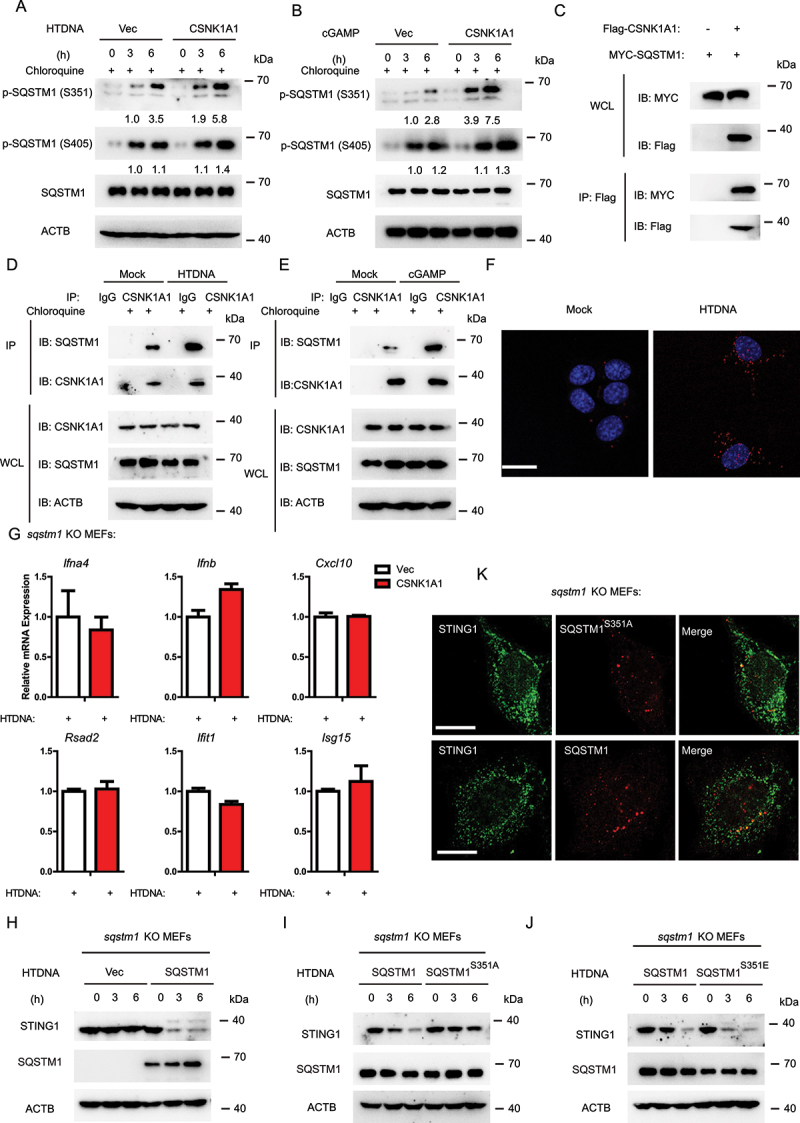
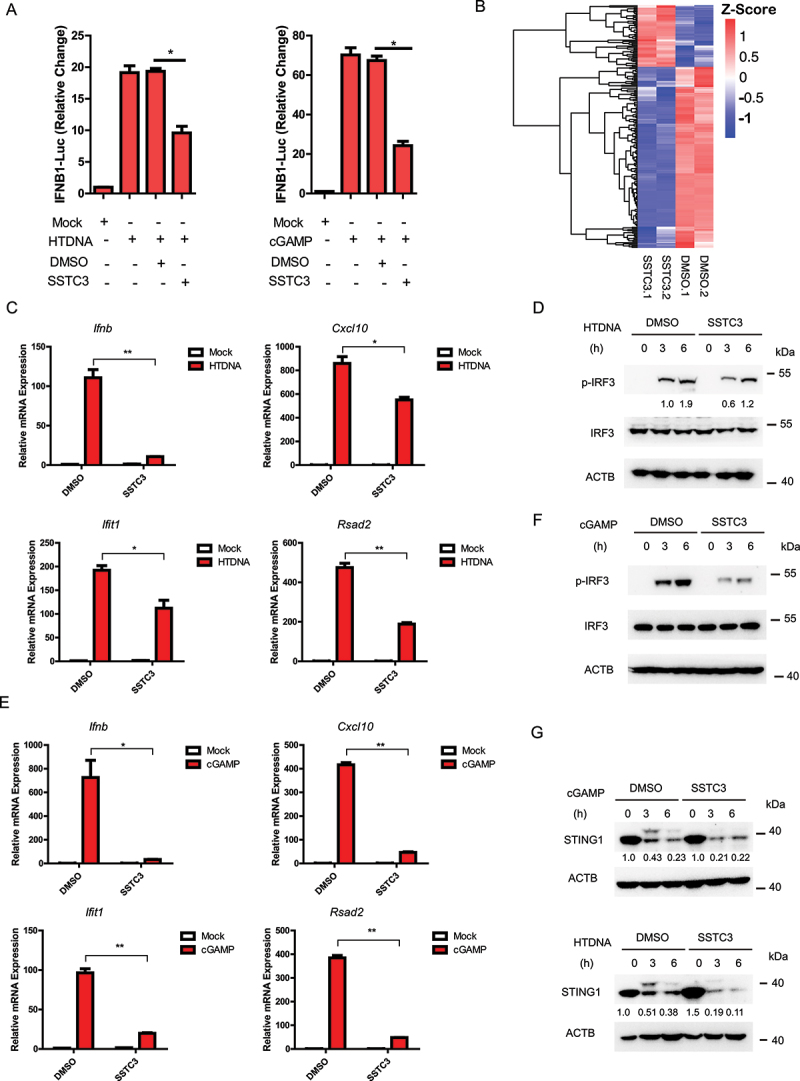
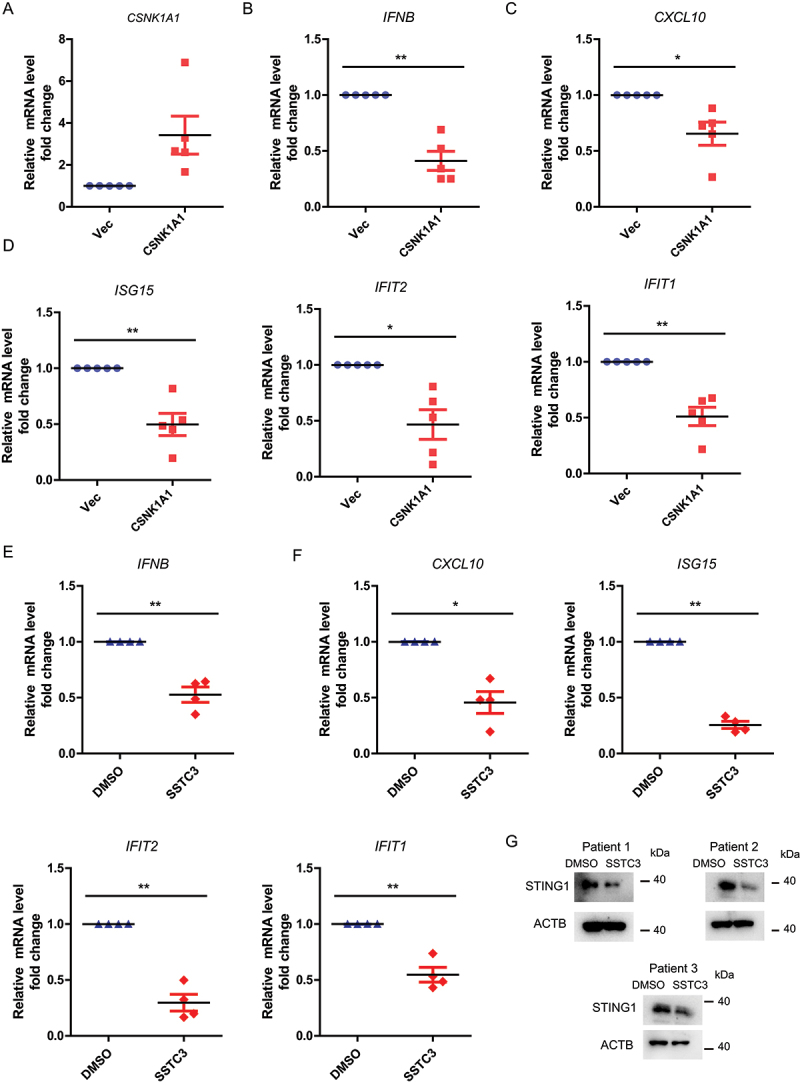
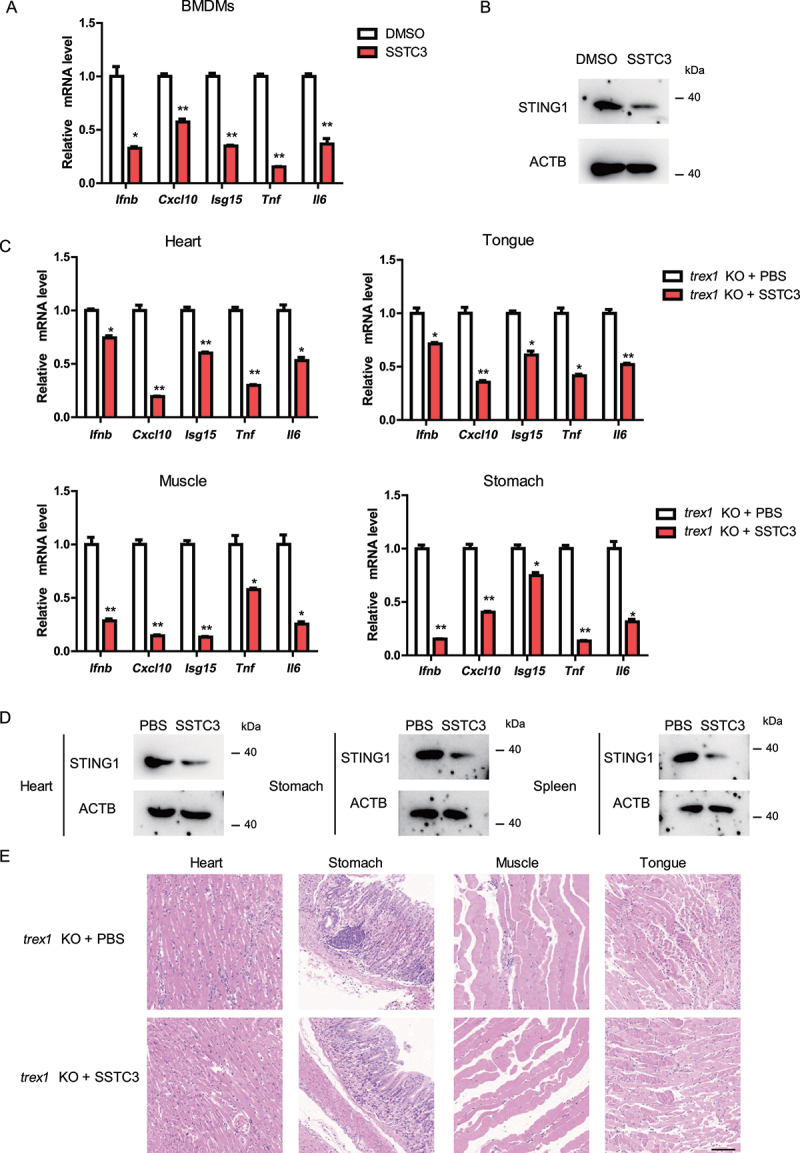
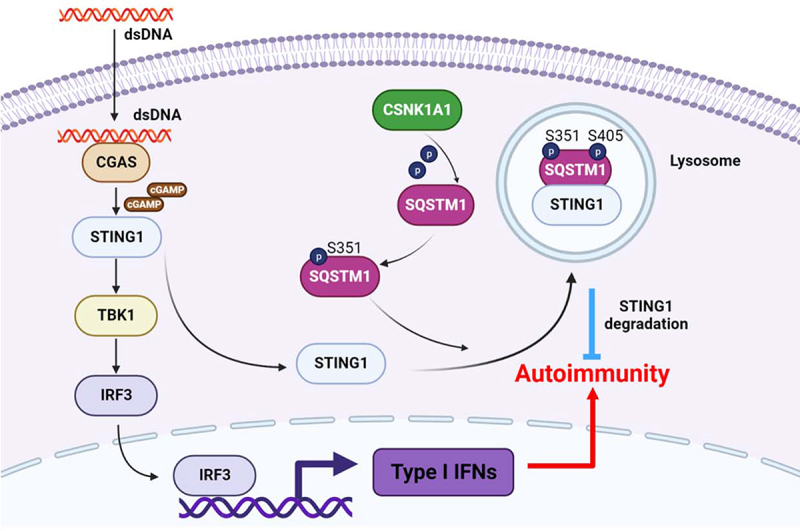
STING1 (stimulator of interferon response cGAMP interactor 1) is the quintessential protein in the CGAS-STING1 signaling pathway, crucial for the induction of type I IFN (interferon) production and eliciting innate immunity. Nevertheless, the overactivation or sustained activation of STING1 has been closely associated with the onset of autoimmune disorders. Notably, the majority of these disorders manifest as an upregulated expression of type I interferons and IFN-stimulated genes (ISGs). Hence, strict regulation of STING1 activity is paramount to preserve immune homeostasis. Here, we reported that CSNK1A1/CK1α, a serine/threonine protein kinase, was essential to prevent the overactivation of STING1-mediated type I IFN signaling through autophagic degradation of STING1. Mechanistically, CSNK1A1 interacted with STING1 upon the CGAS-STING1 pathway activation and promoted STING1 autophagic degradation by enhancing the phosphorylation of SQSTM1/p62 at serine 351 (serine 349 in human), which was critical for SQSTM1-mediated STING1 autophagic degradation. Consistently, SSTC3, a selective CSNK1A1 agonist, significantly attenuated the response of the CGAS-STING1 signaling by promoting STING1 autophagic degradation. Importantly, pharmacological activation of CSNK1A1 using SSTC3 markedly repressed the systemic autoinflammatory responses in the trex1-/- mouse autoimmune disease model and effectively suppressed the production of IFNs and ISGs in the PBMCs of SLE patients. Taken together, our study reveals a novel regulatory role of CSNK1A1 in the autophagic degradation of STING1 to maintain immune homeostasis. Manipulating CSNK1A1 through SSTC3 might be a potential therapeutic strategy for alleviating STING1-mediated aberrant type I IFNs in autoimmune diseases.Abbreviations: BMDMs: bone marrow-derived macrophages; cGAMP: cyclic GMP-AMP; CGAS: cyclic GMP-AMP synthase; HTDNA: herring testes DNA; IFIT1: interferon induced protein with tetratricopeptide repeats 1; IFNA4: interferon alpha 4; IFNB: interferon beta; IRF3: interferon regulatory factor 3; ISD: interferon stimulatory DNA; ISGs: IFN-stimulated genes; MEFs: mouse embryonic fibroblasts; PBMCs: peripheral blood mononuclear cells; RSAD2: radical S-adenosyl methionine domain containing 2; SLE: systemic lupus erythematosus; STING1: stimulator of interferon response cGAMP interactor 1; TBK1: TANK binding kinase 1.

Keywords: Autoimmunity; CSNK1A1; STING1; autophagy; type I IFN.


Conflict of interest statement

No potential conflict of interest was reported by the authors.

Figures

Figure 1.
Figure 1.
CSNK1A1 is a novel regulator of the CGAS-STING1 signaling pathway. (A) luciferase activity in HEK293 cells transfected with an IFNB luciferase reporter, together with an empty vector or increasing amount of plasmid expressing CSNK1A1, activated by HTDNA. The firefly- and renilla luciferase signals were detected with Dual Glo® luciferase assay (Promega). (B) MEF cells were transfected with the indicated siRnas. Cell lysates were collected for western blot analysis of CSNK1A1 and ACTB. Also, CSNK1A1 mRnas was measured by real-time PCR. (C) the heatmap of expression changes of differentially expressed ISGs between negative control (NC) or Csnk1a1 siRnas transfected MEFs stimulated with HTDNA (2 μg per well) for 3 h. For each gene, the expression level was normalized (Z-score) across samples. (D) MEFs transfected negative control (NC) or Csnk1a1 siRnas were stimulated with HTDNA (2 μg per well) for 3 h. Then, the induction of Ifnb, Ifna4, Cxcl10, Isg15, Ifit1, and Rsad2 mRnas was measured by real-time PCR. (E) MEFs transfected negative control (NC) or Csnk1a1 siRnas were stimulated with HTDNA for 0, 3, 6 h, respectively. Then, cell lysates were collected for western blot analysis of indicated protein. (F) MEFs transfected negative control (NC) or Csnk1a1 siRnas were stimulated with cGAMP (1 μg per well) for 3 h. Then, the induction of Cxcl10, Isg15, Ifit1, and Rsad2 mRnas was measured by real-time PCR. (G) MEFs transfected negative control (NC) or Csnk1a1 siRnas were stimulated with cGAMP for 0, 3, 6 h, respectively. Then, cell lysates were collected for western blot analysis of indicated protein. Graphs show the mean ± SEM, and the data shown are representative of three independent experiments. *p < 0.05; **p < 0.01; ***p < 0.001 (two-tailed t-test).
Figure 2.
Figure 2.
CSNK1A1 represses the CGAS-STING1 signaling responses and functions dependently its kinase activity. (A) MEFs transfected control vectors (Vec) or CSNK1A1 expression plasmids (CSNK1A1) or CSNK1A1 mutant expression plasmids (CSNK1A1 mutant) were stimulated with HTDNA (2 μg per well) for 3 h. Then, the induction of Ifnb, Cxcl10, Isg15, Ifit1, and Rsad2 mRnas was measured by real-time PCR. (B) luciferase activity in HEK293 cells transfected with an IFNB luciferase reporter, together with an empty vector or increasing amount of plasmid expressing CSNK1A1 or CSNK1A1 mutant, activated by HTDNA. The firefly- and renilla luciferase signals were detected with Dual Glo® luciferase assay (Promega). (C) MEFs transfected control vectors (Vec) or CSNK1A1 expression plasmids (CSNK1A1) or CSNK1A1 mutant expression plasmids (CSNK1A1 mutant) were stimulated with cGAMP (1 μg per well) for 3 h. Then, the induction of Ifnb, Cxcl10, Isg15, Ifit1, and Rsad2 mRnas was measured by real-time PCR. (D) luciferase activity in HEK293 cells transfected with an IFNB luciferase reporter, together with an empty vector or increasing amount of plasmid expressing CSNK1A1 or CSNK1A1 mutant, activated by cGAMP. The firefly- and renilla luciferase signals were detected with Dual Glo® luciferase assay (Promega). (E) MEFs transfected control vectors (Vec) or CSNK1A1 expression plasmids (CSNK1A1) or CSNK1A1 mutant expression plasmids (CSNK1A1 mutant) were stimulated with HTDNA for 0, 3,6 h, respectively. Then, cell lysates were collected for western blot analysis of indicated protein. (F) MEFs transfected control vectors (Vec) or CSNK1A1 expression plasmids (CSNK1A1) or CSNK1A1 mutant expression plasmids (CSNK1A1 mutant) were stimulated with cGAMP for 0, 3,6 h, respectively. Then, cell lysates were collected for western blot analysis of indicated protein. Graphs show the mean ± SEM, and the data shown are representative of three independent experiments. *p < 0.05; **p < 0.01; ***p < 0.001 (two-tailed t-test).
Figure 3.
Figure 3.
CSNK1A1 interacts STING1 and targets STING1 for degradation. (A) luciferase activity in HEK293 cells transfected with an IFNB luciferase reporter, together with an empty vector or increasing amount of plasmid expressing CSNK1A1, activated by CGAS, STING1, TBK1 or IRF3 5D. The firefly- and renilla luciferase signals were detected with Dual Glo® luciferase assay (Promega). (B) HEK293T cells were transfected with the indicated plasmids. Then, cell lysates were immunoprecipitated with an anti-flag antibody and then immunoblotted with the indicated antibodies. (C) MEFs were stimulated with HTDNA for 3 h, then stained with the indicated antibodies before imaging by confocal microscopy. Scale bars: 10 μm. (D) MEFs transfected control vectors (Vec) or CSNK1A1 expression plasmids (CSNK1A1) were stimulated with HTDNA (2 μg per well) for 0, 3, 6 h respectively. Then, Cell lysates were collected for western blot analysis of STING1 and ACTB. (E) MEFs transfected control vectors (Vec) or CSNK1A1 expression plasmids (CSNK1A1) were stimulated with ISD (2 μg per well) for 0, 3, 6 h respectively. Then, Cell lysates were collected for western blot analysis of STING1 and ACTB. (F) MEFs transfected control vectors (Vec) or CSNK1A1 expression plasmids (CSNK1A1) were stimulated with cGAMP (1 μg per well) for 0, 3, 6 h respectively. Then, Cell lysates were collected for western blot analysis of STING1 and ACTB. (G) MEFs transfected negative control (NC) or Csnk1a1 siRnas were stimulated with HTDNA (2 μg per well) for 0, 3, 6 h respectively. Then, Cell lysates were collected for western blot analysis of STING1 and ACTB. (H) MEFs transfected negative control (NC) or Csnk1a1 siRnas were stimulated with cGAMP (1 μg per well) for 0, 3, 6 h respectively. Then, Cell lysates were collected for western blot analysis of STING1 and ACTB. (I) MEFs transfected control vectors (Vec) or CSNK1A1 mutant expression plasmids (CSNK1A1 mutant) were stimulated with HTDNA (2 μg per well) for 0, 3, 6 h respectively. Then, Cell lysates were collected for western blot analysis of STING1 and ACTB. (J) MEFs transfected control vectors (Vec) or CSNK1A1 mutant expression plasmids (CSNK1A1 mutant) were stimulated with cGAMP (1 μg per well) for 0, 3, 6 h respectively. Then, Cell lysates were collected for western blot analysis of STING1 and ACTB.
Figure 4.
Figure 4.
CSNK1A1 promotes STING1 autophagic degradation. (A) MEFs transfected control vectors (Vec) or CSNK1A1 expression plasmids (CSNK1A1) were stimulated with HTDNA (2 μg per well) for 0, 3 h respectively, followed by the treatment of mock, MG132 (10 μM), chloroquine (CQ; 50 μM). Then, Cell lysates were collected for western blot analysis of STING1 and ACTB. (B) MEFs transfected control vectors (Vec) or CSNK1A1 expression plasmids (CSNK1A1) were stimulated with cGAMP (1 μg per well) for 0, 3 h respectively, followed by the treatment of mock, MG132 (10 μM), chloroquine (CQ; 50 μM). Then, Cell lysates were collected for western blot analysis of STING1 and ACTB. (C) MEFs transfected control vectors (Vec) or CSNK1A1 expression plasmids (CSNK1A1) were stimulated with HTDNA (2 μg per well) for 0, 3 h respectively, followed by the treatment of mock, MG132 (10 μM), baf A1 (0.2 μM). Then, Cell lysates were collected for western blot analysis of STING1 and ACTB. MEFs transfected control vectors (Vec) or CSNK1A1 expression plasmids (CSNK1A1) were stimulated with cGAMP (1 μg per well) for 0, 3 h respectively, followed by the treatment of mock, MG132 (10 μM), baf A1 (0.2 μM). Then, Cell lysates were collected for western blot analysis of STING1 and ACTB. (D) MEFs transfected negative control (NC) or Csnk1a1 siRnas were stimulated with HTDNA (2 μg per well) or cGAMP (1 μg per well) for 0, 3, 6 h respectively. Then, Cell lysates were collected for western blot analysis of LC3-II and ACTB. (E) MEFs transfected control vectors (Vec) or CSNK1A1 expression plasmids (CSNK1A1) were stimulated with HTDNA (2 μg per well) or cGAMP (1 μg per well) for 0, 3, 6 h respectively. Then, Cell lysates were collected for western blot analysis of LC3-II and ACTB. (F) MEFs were transfected indicated siRNA or plasmids and then stimulated with HTDNA for 3 h, then stained with the indicated antibodies before imaging by confocal microscopy. Scale bars: 10 μm. (G) MEFs were transfected indicated siRNA or plasmids and then stimulated with HTDNA (2 μg per well) or ISD (2 μg per well) for 0, 3, 6 h respectively. Then, Cell lysates were collected for western blot analysis of ATG5, STING1 and ACTB. (H) luciferase activity in HEK293 cells transfected with an IFNB luciferase reporter, together with STING1 and an empty vector or CSNK1A1-expressing plasmids, followed by the treatment of mock, MG132 (10 μM), chloroquine (CQ; 50 μM), NH4Cl (10 mM), or baf A1 (0.2 μM). The firefly- and renilla luciferase signals were detected with Dual Glo® luciferase assay (Promega). Graphs show the mean ± SEM, and the data shown are representative of three independent experiments. *p < 0.05; **p < 0.01; ***p < 0.001 (two-tailed t-test).
Figure 5.
Figure 5.
CSNK1A1 accelerates STING1 autophagic degradation by promoting phosphorylation of SQSTM1 at Ser351. (A) MEFs transfected control vectors (Vec) or CSNK1A1 expression plasmids (CSNK1A1) were treated with chloroquine and then stimulated with HTDNA (2 μg per well) for 0, 3, 6 h respectively. Then, Cell lysates were collected for western blot analysis of p-SQSTM1, SQSTM1 and ACTB. (B) MEFs transfected control vectors (Vec) or CSNK1A1 expression plasmids (CSNK1A1) were treated with chloroquine and then stimulated with cGAMP (1 μg per well) for 0, 3, 6 h respectively. Then, Cell lysates were collected for western blot analysis of p-SQSTM1, SQSTM1 and ACTB. (C) HEK293T cells were transfected with the indicated plasmids. Then, cell lysates were immunoprecipitated with an anti-flag antibody and then immunoblotted with the indicated antibodies. (D) MEFs were treated with chloroquine and then stimulated with HTDNA for 3 h, and the cell lysates were immunoprecipitated with an anti-CSNK1A1 antibody or normal IgG, and then immunoblotted with the indicated antibodies. (E) MEFs were treated with chloroquine and then stimulated with cGAMP for 3 h, and the cell lysates were immunoprecipitated with an anti-CSNK1A1 antibody or normal IgG, and then immunoblotted with the indicated antibodies. (F) MEFs were stimulated with HTDNA for 3 h, then PLA analysis was applied to detect the interaction between CSNK1A1 and SQSTM1. Scale bars: 20 μm. (G) sqstm1 KO MEFs transfected control vectors (Vec) or CSNK1A1 expression plasmids (CSNK1A1) were stimulated with HTDNA (2 μg per well) for 3 h respectively. Then, the induction of Ifnb, Ifna4, Cxcl10, Isg15, Ifit1, and Rsad2 mRnas was measured by real-time PCR. (H) sqstm1 KO MEFs transfected control vectors (Vec) or SQSTM1 expression plasmids (SQSTM1) were stimulated with HTDNA (2 μg per well) for 0, 3, 6 h respectively. Then, Cell lysates were collected for western blot analysis of STING1, SQSTM1 and ACTB. (I) sqstm1 KO MEFs transfected SQSTM1 expression plasmids (SQSTM1) or SQSTM1 S351A mutant expression plasmids (SQSTM1S351A) were stimulated with HTDNA (2 μg per well) for 0, 3, 6 h respectively. Then, Cell lysates were collected for western blot analysis of STING1, SQSTM1 and ACTB. (J) sqstm1 KO MEFs transfected SQSTM1 expression plasmids (SQSTM1) or SQSTM1S351E mutant expression plasmids (SQSTM1S351E) were stimulated with HTDNA (2 μg per well) for 0, 3, 6 h respectively. Then, Cell lysates were collected for western blot analysis of STING1, SQSTM1 and ACTB. (K) SQSTM1 KO MEFs transfected SQSTM1 expression plasmids (SQSTM1) or SQSTM1S351A mutant expression plasmids (SQSTM1S351A) were stimulated with HTDNA (2 μg per well) for 3 h respectively. Then stained with the indicated antibodies before imaging by confocal microscopy. Scale bars: 20 μm.
Figure 6.
Figure 6.
SSTC3 is a potent the CGAS-STING1 signaling inhibitor by targeting STING1 for degradation. (A) luciferase activity in HEK293 cells transfected with an IFNB luciferase reporter, stimulated with DMSO or SSTC3, activated by HTDNA or cGAMP. The firefly- and renilla luciferase signals were detected with Dual Glo® luciferase assay (Promega). (B) the heatmap of expression changes of differentially expressed ISGs between DMSO or SSTC3 treated MEFs stimulated with HTDNA (2 μg per well) for 3 h. For each gene, the expression level was normalized (Z-score) across samples. (C) MEFs treated by DMSO or SSTC3 were stimulated with HTDNA (2 μg per well) for 3 h. Then, the induction of Ifnb, Cxcl10, Ifit1, and Rsad2 mRnas was measured by real-time PCR. (D) MEFs treated by DMSO or SSTC3 were stimulated with HTDNA for 0, 3, 6 h, respectively. Then, cell lysates were collected for western blot analysis of IRF3, IRF3 phosphorylation, and ACTB. (E) MEFs treated by DMSO or SSTC3 were stimulated with cGAMP for 3 h. Then, the induction of Ifnb, Cxcl10, Ifit1, and Rsad2 mRnas was measured by real-time PCR. (F) MEFs treated by DMSO or SSTC3 were stimulated with cGAMP for 0, 3, 6 h, respectively. Then, cell lysates were collected for western blot analysis of IRF3, IRF3 phosphorylation, and ACTB. (G) MEFs treated by DMSO or SSTC3 were stimulated with HTDNA or cGAMP for 0, 3, 6 h, respectively. Then, cell lysates were collected for western blot analysis of STING1 and ACTB.
Figure 7.
Figure 7.
CSNK1A1 suppresses aberrant type I IFNs in SLE patients. (A, B, C and D) PBMCs were isolated from the blood samples of SLE patients (n = 5). PBMCs were transfected with control vectors (Vec) or CSNK1A1 expression plasmids (CSNK1A1) by electroporation. Then, CSNK1A1, IFNB, CXCL10, ISG15, IFIT2, and IFIT1 mRNA were measured by real-time PCR. (E and F) PBMCs were isolated from the blood samples of SLE patients (n = 4). PBMCs were treated with DMSO or SSTC3. Then, IFNB, CXCL10, ISG15, IFIT2, and IFIT1 mRNA were measured by real-time PCR. (G) PBMCs were isolated from the blood sample of SLE patients (n = 3). PBMCs were treated with DMSO or SSTC3. Then, cell lysates were collected for western blot analysis of STING1 and ACTB.
Figure 8.
Figure 8.
SSTC3-mediated CSNK1A1 activation alleviates autoimmunity in trex1−/− mice. (A) real-time PCR analysis of Ifnb, Cxcl10, Isg15, Tnf and Il6 mRNA level in BMDMs from trex1−/− mice treated with DMSO or SSTC3. (B) western blot analysis of STING1 and ACTB in BMDMs from trex1−/− mice treated with DMSO or SSTC3. (C) real-time PCR analysis of Ifnb, Cxcl10, Isg15, Tnf and Il6 mRNA level in heart, muscle, stomach, and tongue from trex1−/− mice treated with PBS or SSTC3 (20 mg/kg). (D) western blot analysis of STING1 and ACTB in heart, stomach and spleen from trex1−/− mice treated with PBS or SSTC3. (E) Hematoxylin and eosin staining of heart, muscle, stomach, and tongue sections isolated from trex1−/− mice treated with PBS or SSTC3 (scale bar: 100 μm).
Figure 9.
Figure 9.
The schematic diagram of the negative regulation of CGAS-STING1 signaling pathway by CSNK1A1.

Similar articles

Cited by

References

    1. Cheng Z, Dai T, He X, et al. The interactions between cGAS-STING pathway and pathogens. Sig Transduct Target Ther. 2020;5(1):91. doi: 10.1038/s41392-020-0198-7 - DOI - PMC - PubMed
    1. Ergun SL, Li L.. Structural insights into STING signaling. Trends Cell Biol. 2020;30(5):399–407. doi: 10.1016/j.tcb.2020.01.010 - DOI - PubMed
    1. Xu Y, Li P, Li K, et al. Pathological mechanisms and crosstalk among different forms of cell death in systemic lupus erythematosus. J Autoimmun. 2022;132: 102890. doi: 10.1016/j.jaut.2022.102890 - DOI - PubMed
    1. Nündel K, Marshak-Rothstein A, The role of nucleic acid sensors and type I IFNs in patient populations and animal models of autoinflammation. Curr Opin Immunol. 2019;61:74–79. doi: 10.1016/j.coi.2019.08.003 - DOI - PubMed
    1. Kumar V. A STING to inflammation and autoimmunity. J Leukocyte Biol. 2019;106(1):171–185. doi: 10.1002/JLB.4MIR1018-397RR - DOI - PubMed

Publication types