. 2023 Sep 19:12:e83737.
doi: 10.7554/eLife.83737.

Selective loss of CD107a TIGIT+ memory HIV-1-specific CD8+ T cells in PLWH over a decade of ART

Affiliations

Selective loss of CD107a TIGIT+ memory HIV-1-specific CD8+ T cells in PLWH over a decade of ART

Oscar Blanch-Lombarte et al. Elife. .

Abstract

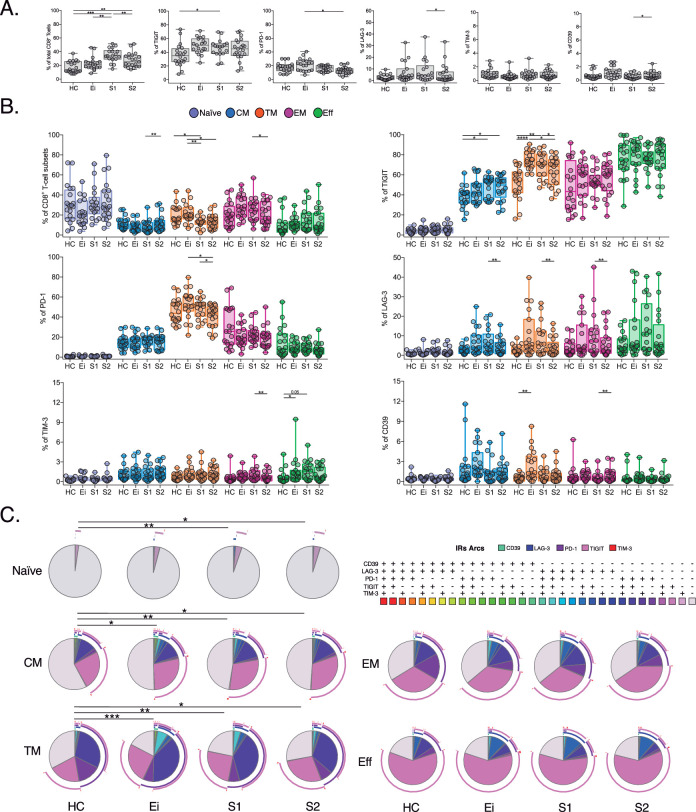
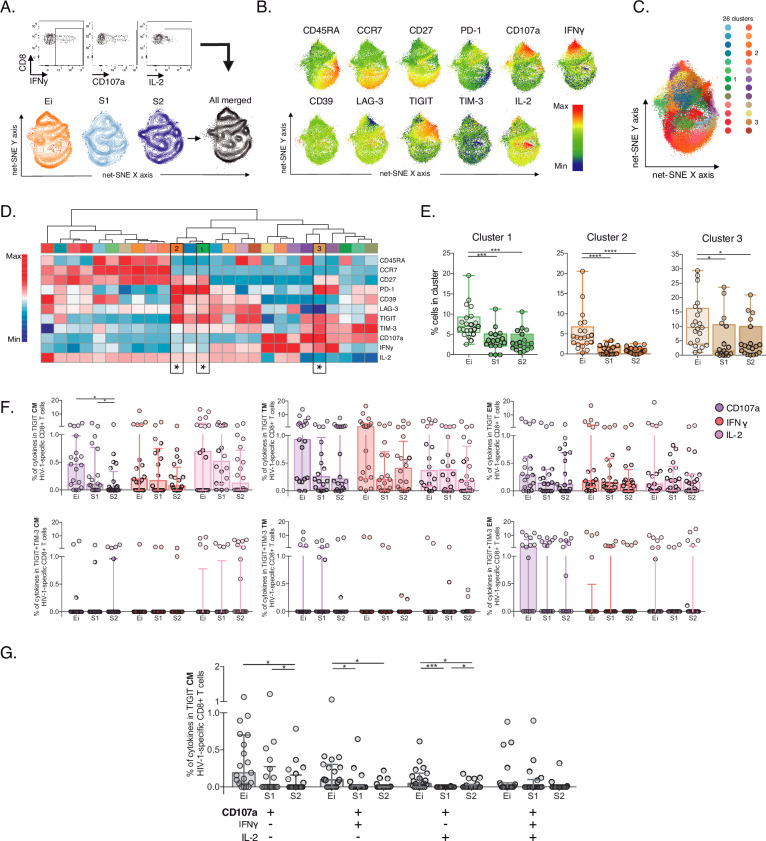
The co-expression of inhibitory receptors (IRs) is a hallmark of CD8+ T-cell exhaustion (Tex) in people living with HIV-1 (PLWH). Understanding alterations of IRs expression in PLWH on long-term antiretroviral treatment (ART) remains elusive but is critical to overcoming CD8+ Tex and designing novel HIV-1 cure immunotherapies. To address this, we combine high-dimensional supervised and unsupervised analysis of IRs concomitant with functional markers across the CD8+ T-cell landscape on 24 PLWH over a decade on ART. We define irreversible alterations of IRs co-expression patterns in CD8+ T cells not mitigated by ART and identify negative associations between the frequency of TIGIT+ and TIGIT+ TIM-3+ and CD4+ T-cell levels. Moreover, changes in total, SEB-activated, and HIV-1-specific CD8+ T cells delineate a complex reshaping of memory and effector-like cellular clusters on ART. Indeed, we identify a selective reduction of HIV-1 specific-CD8+ T-cell memory-like clusters sharing TIGIT expression and low CD107a that can be recovered by mAb TIGIT blockade independently of IFNγ and IL-2. Collectively, these data characterize with unprecedented detail the patterns of IRs expression and functions across the CD8+ T-cell landscape and indicate the potential of TIGIT as a target for Tex precision immunotherapies in PLWH at all ART stages.

Keywords: CD107a; HIV-1-specific CD8+ T cells; TIGIT; immunology; inflammation; inhibitory receptors; people living with HIV-1; single-cell CD8+ dynamics; viruses.


Conflict of interest statement

OB, DO, EJ, JC, MM, RP, AP, AT, AS, JD, JS, RS, BC, JP No competing interests declared

Figures

Figure 1.
Figure 1.. Patterns of IRs co-expression and correlations with CD4+ T-cell counts in PLWH.
(A) Overview of study design and study groups, healthy controls (HC), PLWH in early HIV-1 infection (Ei), and PLWH on fully suppressive ART (S) in S1 and S2 time points. (B) The expression of IRs summarized in the pie chart is none, one, two, or more than three IRs expressed in CD8+ T-cell subsets. For statistical analysis, we used permutation tests using SPICE software. (C) Scatter plots showing the median and interquartile ranges of IR combinations in CD8+ T- cell subsets. (D) Scatter plots of the frequencies of single TIGIT+ expression in CM and TIGIT+TIM-3+ expression in EM and effector EFF CD8+ T cells. (E–G) Correlations between CD4+ T-cell counts as a function of TIGIT+, TIGIT+TIM-3+, and combinations of IRs from total CD8+ T-cells and subsets in Ei (E), S1 (F), and S2 (G). The data in B to D represent the mean of two technical replicates. We used the Mann-Whitney U test for intergroup comparison (HC, Ei, S1, and S2) and the signed-rank test for intragroup comparison (S1 and S2). Holm’s method was used to adjust statistical tests for multiple comparisons. All possible correlations of the 32 Boolean IRs combinations are not shown. p-values: *<0.05, **<0.005 and ***<0.0005. Sample sizes in A: HC (24), Ei (24), S1(24), S2 (24). Sample sizes in B–G: HC (20), Ei (21), S1(18), S2 (21).
Figure 1—figure supplement 1.
Figure 1—figure supplement 1.. Gating strategy for identifying total CD8+ T-cell subsets and IRs expression levels.
(A) Zebra dot plots showing the gating strategy used for the identification of total CD8+ and cellular using lineage markers (CD45RA, CCR7, and CD27) subsets as follow; naive (CD45RA+ CCR7+ CD27+), Eff (CD45RA+ CCR7- CD27-), CM (CD45RA- CCR7+ CD27+), TM (CD45RA- CCR7- CD27+), and EM (CD45RA-, CCR7-, and CD27-). (B) Zebra dot plots of FMO and IRs staining demonstrating TIGIT, PD-1, LAG-3, TIM-3, and CD39 expression in cryopreserved PBMCs. Sample sizes: HC (20), Ei (21), S1(18), S2 (21).
Figure 1—figure supplement 2.
Figure 1—figure supplement 2.. Expression profile of IRs in total and CD8+ T-cell subsets across study groups.
(A) Frequency of CD8+ T-cells and IRs expression in total CD8+ T cells across study groups (HC, Ei, S1 and S2) (B) Frequency of IRs expression in CD8+ T-cell subsets. Scatter plots represent median and interquartile ranges. (C) Co-expression profile of IRs across CD8+ T-cell subset. Pie charts represent the frequency for the 32 possible combinations for TIGIT, PD-1, LAG-3, TIM-3, and CD39 expression. The pie charts represent the frequency of expression according to the color code, and the arcs indicate the frequency of each IR. We used permutation tests of SPICE software for statistical analysis of IRs co-expression data. We used the Mann-Whitney U test for intergroup analyses and the signed-rank test for intragroup analyses. Holm’s method was used to adjust statistical tests for multiple comparisons. p-values: *<0.05, **<0.005, ***<0.0005, ****<0.00001. Sample sizes: HC (20), Ei (21), S1(18), S2 (21).
Figure 2.
Figure 2.. Unsupervised net-SNE analyses of total CD8+ T-cells.
(A) Gating strategy for selecting total CD8+ T-cells (top), net-SNE plots of HC, Ei, S1, S2 and all merge groups. (B) Representative net-SNE visualization of surface markers. The colour gradient displays the relative marker expression. (C) Unsupervised KNN algorithm of 38 clusters colored according to the legend. Only clusters with statistical differences are represented in the legend. (D) Heatmap of the median biexponential-transformed marker expression normalized to a –3–3 range of respective markers. Asterisks represent the clusters with statistical differences. (E–F) Scatter plots of intergroup (HC, Ei, S1 and S2) and intragroup (S1 and S2) cluster comparisons. Data represent the median and interquartile ranges of cluster cell frequency. We used the Mann-Whitney U test for intergroup analyses and the signed-rank test for intragroup analyses. Holm’s method was used to adjust statistical tests for multiple comparisons. p-values: *<0.05, **<0.005 and ***<0.0005. Sample sizes for A–F: HC (20), Ei (21), S1(18), S2 (21).
Figure 3.
Figure 3.. Unsupervised net-SNE analyses of SEB-activated CD8+ T-cells.
(A) Gating representation of CD107a, IFNγ and IL-2 expression in HIV-1-specific CD8+ T-cells (top), net-SNE plots of HC, Ei, S1, S2 and merge groups of SEB-activated CD8+ T-cells (bottom). (B) Representative net-SNE visualization of IR expression, lineage, and functional markers. The color gradient displays relative marker expression. (C) Unsupervised KNN algorithm for 29 polyclonal clusters color-coded according to the legend. Clusters with statistical differences between groups are represented in the legend. (D) Heatmap of the median biexponential-transformed marker expression normalized to a –3–3 range of respective markers. Asterisks represent the clusters with intergroup statistical differences. (E–F) Scatter plots of intergroup (HC, Ei, S1 and S2) and intragroup (S1 and S2) cluster comparisons. Data represent the median and interquartile ranges of cluster cell frequency. We used the Mann-Whitney U test for intergroup analyses and the signed-rank test for intragroup analyses. Holm’s method was used to adjust statistical tests for multiple comparisons. p-values: *<0.05, **<0.005, ***<0.0005. Sample sizes: HC (20), Ei (21), S1(18), S2 (21).
Figure 3—figure supplement 1.
Figure 3—figure supplement 1.. Supervised analyses of SEB-activated CD8+ T-cells.
(A) The total frequency of CD107a, IFNγ and IL-2 SEB-activated CD8+ T-cells in HC, Ei, S1, and S2. Data represent median and interquartile ranges. (B) Table of median frequencies of CD107a, IFNγ and IL-2 SEB-activated CD8+ T-cells. (C) Frequency of IL-2 SEB-activated CD8+ T-cell subsets in S1 and S2. We used the Mann-Whitney U test for independent median intergroup comparison and the signed-rank test for paired median changes between S1 and S2. The Holm’s method was used to adjust statistical tests for multiple comparisons. p-values: *<0.05, **<0.005, ***<0.0005. Sample sizes: HC (20), Ei (21), S1(18), S2 (21).
Figure 4.
Figure 4.. Unsupervised and supervised analyses of HIV-1-specific CD8+ T-cells.
(A) Gating representation of CD107a, IFNγ, and IL-2 expression in HIV-1-specific CD8+ T-cells (top), net-SNE plots of Ei, S1, S2 and merge groups for HIV-1-specific CD8+ T-cells (bottom). (B) Representative net-SNE plots for surface and functional markers. The color gradient displays relative marker expression. (C) Unsupervised KNN algorithm for 26 HIV-1-specific clusters color-coded according to the legend. Only clusters with statistical differences are represented in the legend. (D) Heatmap of the median biexponential-transformed marker expression normalized to a –3–3 range of respective markers. Asterisks represent the clusters with intergroup statistical differences. (E) Scatter plots of intergroup (Ei, S1 and S2) cluster comparisons with significant statistical differences. Data represent the median and interquartile ranges of cluster cell frequency. (F) CD107a, IFNγ, and IL-2 frequency of expression in TIGIT+ (upper panel) and TIGIT +TIM-3+ (bottom panel) HIV-1-specific memory CD8+ T-cell subsets. Scatter plots represent the median and interquartile ranges. (G) Polyfunctional analyses of CD107a, IFNγ, and IL-2 expression in CM TIGIT HIV-1-specific CD8+ T-cells. Scatter plots represent median and interquartile ranges. We used the Mann-Whitney U test for intergroup analyses and the signed-rank test for intragroup analyses. Holm’s method was used to adjust statistical tests for multiple comparisons. p-values: *<0.05, ***<0.0005, and ****<0.0001. Sample sizes: Ei (21), S1(18), S2 (21).
Figure 4—figure supplement 1.
Figure 4—figure supplement 1.. Supervised analyses of HIV-1-specific CD8+ T-cell responses.
(A) Frequency of CD107a, IFNγ and IL-2 HIV-1-specific CD8+ T-cells in Ei, S1 and S2. Data represent median and interquartile ranges. (B) Table of median frequencies of CD107a, IFNγ and IL-2 HIV-1-specific CD8+ T-cells. We used the Mann-Whitney U test for intergroup analyses and the signed-rank test for intragroup analyses. Holm’s method was used to adjust statistical tests for multiple comparisons. Sample sizes: HC (20), Ei (21), S1(18), S2 (21).
Figure 5.
Figure 5.. Effect of TIGIT, TIM-3, and TIGIT +TIM-3 mAb blockade in HIV-1-specific CD8+ T-cell responses in PLWH on ART.
(A) Representative flow cytometry plots gated on CD8+ T-cells, in the absence of HIV-1 Gag stimulation (basal condition) and presence of HIV-1 Gag stimulation with isotype control, αTIGIT, αTIM-3, and αTIGIT+αTIM-3 antibodies for CD107a, IFNγ and IL-2 expression. (B) Representative net-SNE plots for HIV-1-specific CD8+ T-cells from PLWH concatenated and merged according to the condition. (C–E) Frequency of CD107a, IFNγ, and IL-2 expression in total and HIV-1-specific CD8+ T-cell subsets for the various conditions tested. The Wilcoxon matched-pairs signed ranked test calculated statistical differences. The data represent the mean of two technical replicates. p-values:=0.05, *<0.05, **<0.005 and ***<0.0005. Sample sizes: S1(10), S2 (10).
Author response image 1.
Author response image 1.. Graphs represent paired comparisons of the frequency of live cells in PBMC samples in short-term ICB studies.
A. Graphs indicate the percentage of live cells in HIV-1 condition (Gag peptide pool) compared to HIV-1 + IgG2 isotype, HIV-1 + IgG1 isotype and HIV-1 + IgG2a+IgG1. B. Graphs indicate the % of live cells in HIV-1 compared to HIV-1 + aTIGIT, HIV-1 + aTIM-3 and HIV-1 + aTIGIT+ aTIM-3.

Update of

  • doi: 10.1101/2022.07.13.499924

References

    1. Akdis M, Aab A, Altunbulakli C, Azkur K, Costa RA, Crameri R, Duan S, Eiwegger T, Eljaszewicz A, Ferstl R, Frei R, Garbani M, Globinska A, Hess L, Huitema C, Kubo T, Komlosi Z, Konieczna P, Kovacs N, Kucuksezer UC, Meyer N, Morita H, Olzhausen J, O’Mahony L, Pezer M, Prati M, Rebane A, Rhyner C, Rinaldi A, Sokolowska M, Stanic B, Sugita K, Treis A, van de Veen W, Wanke K, Wawrzyniak M, Wawrzyniak P, Wirz OF, Zakzuk JS, Akdis CA. Interleukins (from IL-1 to IL-38), interferons, transforming growth factor β, and TNF-α: Receptors, functions, and roles in diseases. Journal of Allergy and Clinical Immunology. 2016;138:984–1010. doi: 10.1016/j.jaci.2016.06.033. - DOI - PubMed
    1. Aktas E, Kucuksezer UC, Bilgic S, Erten G, Deniz G. Relationship between CD107a expression and cytotoxic activity. Cellular Immunology. 2009;254:149–154. doi: 10.1016/j.cellimm.2008.08.007. - DOI - PubMed
    1. Anderson AC, Joller N, Kuchroo VK. Lag-3, Tim-3, and TIGIT: Co-inhibitory receptors with specialized functions in immune regulation. Immunity. 2016;44:989–1004. doi: 10.1016/j.immuni.2016.05.001. - DOI - PMC - PubMed
    1. Andrews LP, Yano H, Vignali DAA. Inhibitory receptors and ligands beyond PD-1, PD-L1 and CTLA-4: breakthroughs or backups. Nature Immunology. 2019;20:1425–1434. doi: 10.1038/s41590-019-0512-0. - DOI - PubMed
    1. Attanasio J, Wherry EJ. HIV infection is associated with downregulation of btla expression on mycobacterium tuberculosis-specific CD4 T cells in active tuberculosis disease. Frontiers in Immunology. 2017;44:1052–1068. doi: 10.3389/fimmu.2019.01983. - DOI - PMC - PubMed

Publication types