. 2023 Dec;22(12):e13995.
doi: 10.1111/acel.13995. Epub 2023 Sep 18.

Association of biological age with health outcomes and its modifiable factors

Affiliations

Association of biological age with health outcomes and its modifiable factors

Wei-Shi Liu et al. Aging Cell. 2023 Dec.

Abstract

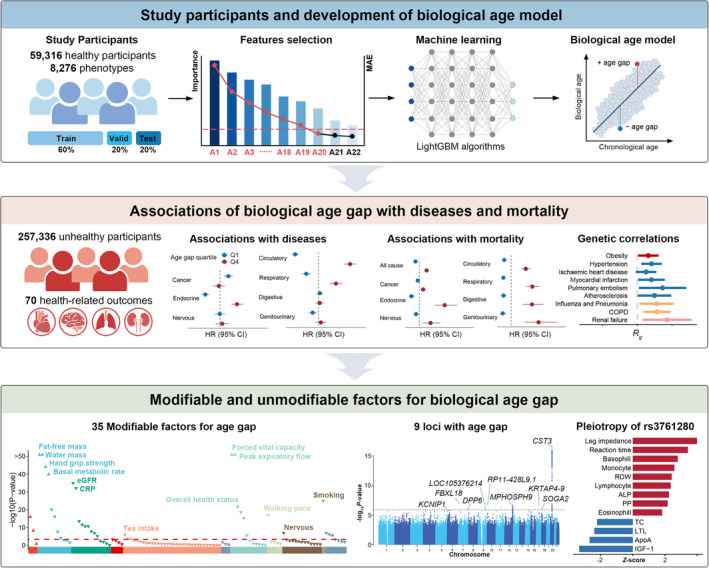
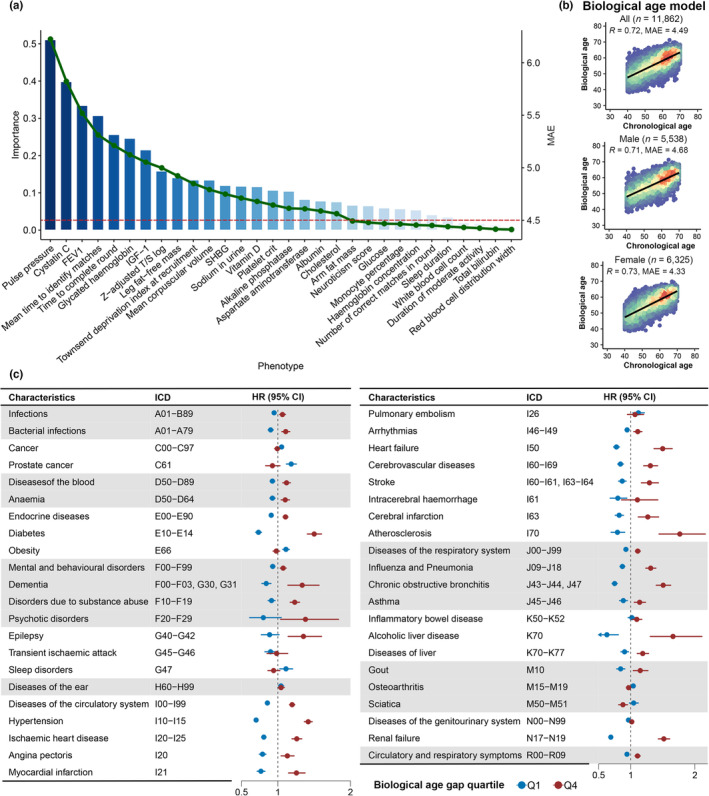
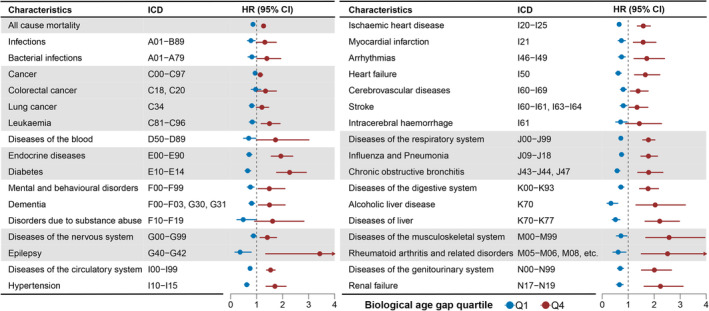
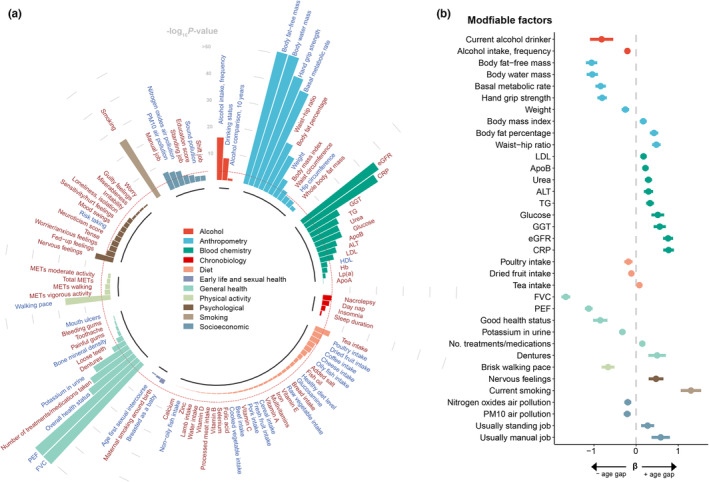
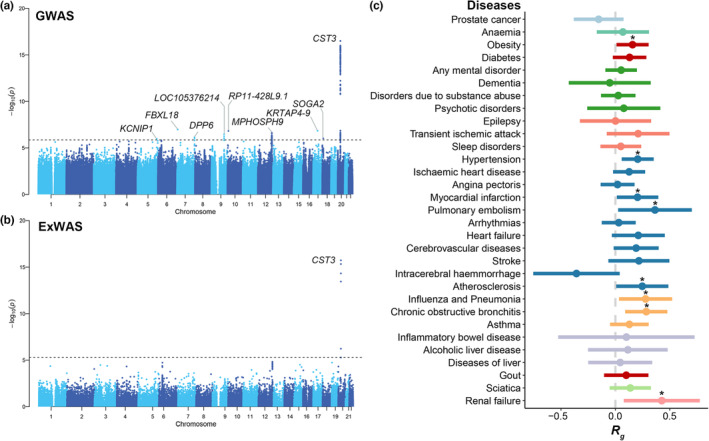
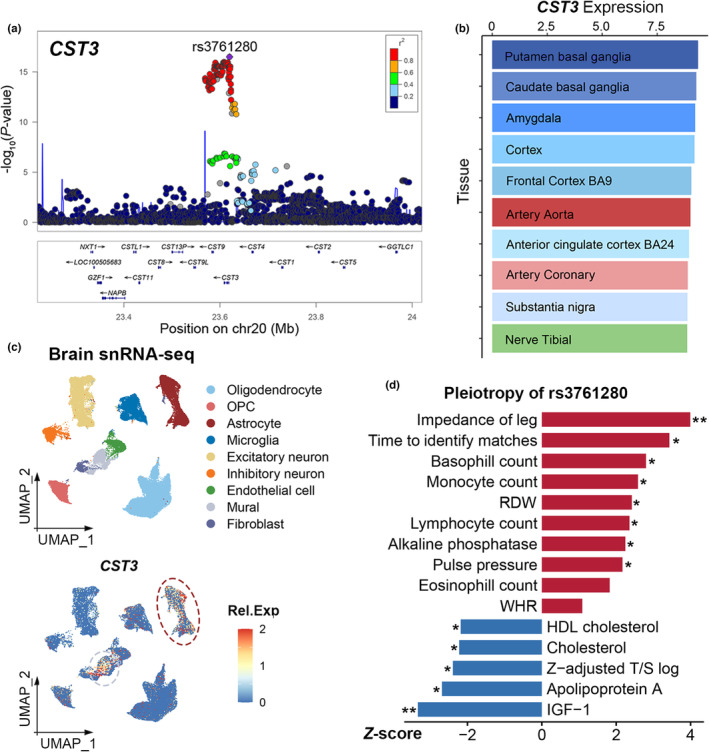
Identifying the clinical implications and modifiable and unmodifiable factors of aging requires the measurement of biological age (BA) and age gap. Leveraging the biomedical traits involved with physical measures, biochemical assays, genomic data, and cognitive functions from the healthy participants in the UK Biobank, we establish an integrative BA model consisting of multi-dimensional indicators. Accelerated aging (age gap >3.2 years) at baseline is associated incident circulatory diseases, related chronic disorders, all-cause, and cause-specific mortality. We identify 35 modifiable factors for age gap (p < 4.81 × 10⁻⁴ ), where pulmonary functions, body mass, hand grip strength, basal metabolic rate, estimated glomerular filtration rate, and C-reactive protein show the most significant associations. Genetic analyses replicate the possible associations between age gap and health-related outcomes and further identify CST3 as an essential gene for biological aging, which is highly expressed in the brain and is associated with immune and metabolic traits. Our study profiles the landscape of biological aging and provides insights into the preventive strategies and therapeutic targets for aging.

Keywords: Aging; biological age; disease; modifiable factor; mortality; unmodifiable factor.


Conflict of interest statement

The authors declared no conflicts of interest in the article.

Figures

FIGURE 1
FIGURE 1
Graphical abstract of the study. Top part, the study participants and development of biological age model. The study included 59,316 healthy participants in the UK Biobank and considered 8276 phenotypes for developing biological age model. All healthy participants were further divided into training set (60%), validation set (20%), and testing set (20%). LightGBM algorithm was conducted to identify the most important predictors for biological age and build the model and the top 20 predictors were selected. Then the age gap, the difference between the estimated biological age and chronological age, was calculated within the participants. Middle part, the associations of age gap with diseases and mortality. We tested the longitudinal associations of age gap with 70 common health‐related outcomes, all‐cause mortality and cause‐specific mortality, and the genetic correlations of age gap with common health‐related outcomes. Bottom part, the modifiable and unmodifiable factors for age gap. We identified 34 modifiable factors and 9 genomic risk loci for age gap and profiled the pleiotropy of rs3761280 in the UK Biobank. ALP, alkaline phosphatase; ApoA, apolipoprotein A; CI, confidence interval; COPD, chronic obstructive pulmonary disease; CRP, C‐reactive protein; eGFR, estimated glomerular filtration rate; HR, hazard ratio; IGF‐1, insulin growth factor 1; LightGBM, Light Gradient Boosting Machine; LTL, leukocyte telomere length; PP, pulse pressure; RDW, red blood cell distribution width; TC, total cholesterol.
FIGURE 2
FIGURE 2
Predictor selection, performance, and implications of biological age. (a) The barplot showed the importance of phenotypes, which was the square root of the gain value generated from the LightGBM algorithm. The line chart showed the MAE when adding the phenotypes into the biological age model. (b) The scatter plot shows the distributions of biological age and chronological age of the participants. Each scatter indicated a single participant. The MAE and correlation coefficient of the model are shown in the left top part of the plot. (c) Associations of age gap with common health‐related outcomes. The forest plot shows the results of Cox proportional hazards regression analyses. Only the outcomes with nominally statistical significance (p < 0.05) are shown in the figure with the corresponding ICD‐10 codes. The Cox proportional model was adjusted for age at the recruitment, gender, ethnicity, education score, smoking status, alcohol drinking status, Townsend deprivation index, overall health rating, and number of medications/treatments taken. The second and the third quartiles of age gap (Q2 and Q3) are set as the reference, and other quartiles are marked with different colors. CI, confidence interval; HR, hazard ratio; ICD, international classification of diseases; IGF‐1, insulin growth factor; MAE, mean absolute error; SHBG, sex hormone binding globulin.
FIGURE 3
FIGURE 3
Associations of age gap with all‐cause and cause‐specific mortality. The forest plot shows the results of Cox proportional hazards regression analyses. Only the outcomes with nominally statistical significance (p < 0.05) were shown in the figure with the corresponding ICD‐10 codes. The Cox proportional model was adjusted for age at the recruitment, gender, ethnicity, education score, smoking status, alcohol drinking status, Townsend deprivation index, overall health rating, and number of medications/treatments taken. The lowest quantile of age gap (Q1) is set as the reference, and other quantiles are marked with different colors. CI, confidence interval; HR, hazard ratio; ICD, international classification of diseases.
FIGURE 4
FIGURE 4
The associations of the modifiable factors and biological age gap in healthy participants. (a) The circular barplot shows the associations of the modifiable factors with biological age gap. The association with a p‐value of <1 × 10−50 was rounded to 1 × 10−50. The red dashed line indicates the threshold of adjusted p‐value (4.81 × 10−4). The modifiable factors were filled with different colors based on the categories. The red text indicates positive associations with age gap (β > 0), and the light blue text indicated negative association with age gap (β < 0). (b) The forest plot showed the estimated effects of the factors significantly associated with biological age gap. The x‐axis indicates the β coefficient of the traits. The bar indicated the 95% CI. Continuous traits were estimated for 1‐SD increase in the trait. Binary traits were estimated as yes versus no. Good health status was compared with fair or poor. A brisk walking pace was compared with a steady or slow pace. Usually standing and manual jobs were compared with sometimes, rarely, or never. ALT, alanine aminotransferase; ApoA, apolipoprotein A; ApoB, apolipoprotein B; CRP, C‐reactive protein; eGFR, estimated glomerular filtration rate; FVC, forced vital capacity; GGT, gamma glutamyltransferase; Hb, hemoglobin concentration; HDL, high‐density lipoprotein cholesterol; LDL, low‐density lipoprotein cholesterol; Lp(a), lipoprotein A; MET, metabolic equivalent task; PEF, peak expiratory flow; PM10, particulate matter with diameter less than or equal to 10 micrometers; TG, triglycerides.
FIGURE 5
FIGURE 5
The genetic determinants and correlations of biological age gap. (a)The Manhattan plot shows the results of GWAS analysis of biological age gap in healthy participants. The y‐axis indicated the associations of the association of the locus with biological age gap. The loci with FDR < 0.05 were marked. (b) The Manhattan plot shows the results of ExWAS common variant analysis of biological age gap in healthy participants. The y‐axis indicated the associations of the association of the locus with biological age gap. The loci with FDR < 0.05 were marked. (c) The forest plot shows the results of LDSC analysis of biological age gap with the common health‐related outcomes that age gap was associated with the longitudinal survival analysis. The health‐related outcomes were filled with different colors based on the category. The outcomes that biological age gap nominally associated were marked with an asterisk. ExWAS, exomewide association study; GWAS, genome‐wide association study; LDSC, linkage disequilibrium score correlation.
FIGURE 6
FIGURE 6
Expression analysis and pleiotropy of CST3. (a) Regional association plot of CST3 in healthy White British participants. The region covering CST3 ± 0.4 Mb was shown in the locus zoom plot. The SNP rs3761280 was highlighted and filed with purple color. The colors within the dots indicated the levels of linkage disequilibrium. (b) Tissue expression levels of CST3. The barplot shows the top 10 most CST3‐expressed tissues in GTEx v7. The x‐axis indicates the relative expression levels [log2(TPM + 1)]. (c) Cell type expression of CST3. The top section shows the UMAP of brain single‐nucleus transcriptomic data. Each dot represented an individual cell and was filled with different colors based on the result of clustering and annotation. The bottom section shows the expression level of CST3 in the brain. (d) The pleiotropy of rs3761280 in the UK Biobank. The x‐axis indicated the z‐score of the association between rs3761280 and the characteristics. GTEx, genotype tissue expression; HDL, high‐density lipoprotein; OPC, oligodendrocyte progenitor cell; RDW, red blood cell distribution width; Rel.Exp, relative expression; snRNA‐seq, single‐nucleus RNA sequencing; TPM, transcripts per million; UMAP, uniform manifold approximation and projection; WHR, waist–hip ratio. *p < 0.05, **p < 0.01.

References

    1. Adzhubei, I. , Jordan, D. M. , & Sunyaev, S. R. (2013). Predicting functional effect of human missense mutations using PolyPhen‐2. Current Protocols in Human Genetics Chapter, 7, Unit7.20. - PMC - PubMed
    1. Aging Biomarker Consortium , Bao, H. , Cao, J. , Chen, M. , Chen, M. , Chen, W. , Chen, X. , Chen, Y. , Chen, Y. , Chen, Y. , Chen, Z. , Chhetri, J. K. , Ding, Y. , Feng, J. , Guo, J. , Guo, M. , He, C. , Jia, Y. , Jiang, H. , … Liu, G.‐H. (2023). Biomarkers of aging. Science China. Life Sciences, 66, 893–1066. - PMC - PubMed
    1. Anatürk, M. , Kaufmann, T. , Cole, J. H. , Suri, S. , Griffanti, L. , Zsoldos, E. , Filippini, N. , Singh‐Manoux, A. , Kivimäki, M. , Westlye, L. T. , Ebmeier, K. P. , & de Lange, A.‐M. G. (2021). Prediction of brain age and cognitive age: Quantifying brain and cognitive maintenance in aging. Human Brain Mapping, 42, 1626–1640. - PMC - PubMed
    1. Aunan, J. R. , Cho, W. C. , & Søreide, K. (2017). The biology of aging and cancer: A brief overview of shared and divergent molecular hallmarks. Aging and Disease, 8, 628–642. - PMC - PubMed
    1. Baecker, L. , Garcia‐Dias, R. , Vieira, S. , Scarpazza, C. , & Mechelli, A. (2021). Machine learning for brain age prediction: Introduction to methods and clinical applications. eBioMedicine, 72, 103600. - PMC - PubMed

Publication types