. 2023 Nov 13;228(Suppl 7):S522-S535.
doi: 10.1093/infdis/jiad400.

Ebola Virus Uses Tunneling Nanotubes as an Alternate Route of Dissemination

Affiliations

Ebola Virus Uses Tunneling Nanotubes as an Alternate Route of Dissemination

Marija A Djurkovic et al. J Infect Dis. .

Abstract

Ebola virus (EBOV) disease is marked by rapid virus replication and spread. EBOV enters the cell by macropinocytosis and replicates in the cytoplasm, and nascent virions egress from the cell surface to infect neighboring cells. Here, we show that EBOV uses an alternate route to disseminate: tunneling nanotubes (TNTs). TNTs, an actin-based long-range intercellular communication system, allows for direct exchange of cytosolic constituents between cells. Using live, scanning electron, and high-resolution quantitative 3-dimensional microscopy, we show that EBOV infection of primary human cells results in the enhanced formation of TNTs containing viral nucleocapsids. TNTs promote the intercellular transfer of nucleocapsids in the absence of live virus, and virus could replicate in cells devoid of entry factors after initial stall. Our studies suggest an alternate model of EBOV dissemination within the host, laying the groundwork for further investigations into the pathogenesis of filoviruses and, importantly, stimulating new areas of antiviral design.

Keywords: Ebola virus; spread; tunneling nanotubes.


Conflict of interest statement

Potential conflicts of interest. All authors: No reported conflicts. All authors have submitted the ICMJE Form for Disclosure of Potential Conflicts of Interest. Conflicts that the editors consider relevant to the content of the manuscript have been disclosed.

Figures
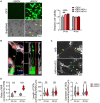
Figure 1.
Figure 1.
EBOV infection triggers TNT formation. A, MΦs were infected with EBOV-GFP at MOI = 1 for 24 hours and then imaged. Arrowheads point to connections between infected cells. In cell viability tests, MΦs were infected with EBOV at the indicated MOI and time. Cell viability was determined by CellTiter-Glo reagent, and the values for each time point were normalized to values of uninfected cells and are shown as means (±SDs) of 3 independent experiments. B, MΦs infected with EBOV at MOI = 1 for 48 hours were stained with phalloidin (pseudocolored gray, here and all subsequent phalloidin staining), RedDot2 dye (blue), and antibodies to TNFAIP2 and EBOV NP. Confocal images were acquired as Z-stacks and converted to 3-dimensional images. The maximum intensity projection of a Z-stack is shown in the larger image on the left. The arrowhead indicates an intercellular connection. The images on the right are a side view of the merged and individual channels of the sample. C, MΦ or MΦ-HUVEC cultures were infected with EBOV at MOI = 5 or left untreated for 24 or 48 hour and then imaged by scanning electron microscopy. Representative images of TNTs in infected cells are shown. HUVECs and MΦs were identified by cell morphology. MΦs are marked by stars in the coculture image. Examples of MΦ and HUVEC-MΦ connections are marked with yellow and blue-yellow arrowheads, respectively. D, The number of MΦs with TNTs at combined 24- and 48-hour time points in homologous cultures in electron micrographs was counted manually in ≥100 cells/sample and is reported as a ratio to the total number of cells (left panel). The length and width of TNTs in the micrographs were determined by ImageJ software in ≥50 TNTs/sample (middle and right graphs, respectively). *P < .05. ***P < .001. ****P < .0001. EBOV, Ebola virus; GFP, green fluorescent protein; hpi, hours postinfection; HUVEC, human umbilical vein endothelial cell; MΦ, monocyte-derived macrophage; MOI, multiplicity of infection; NP, nucleoprotein; ns, nonsignificant; TNT, tunneling nanotube.
Figure 2.
Figure 2.
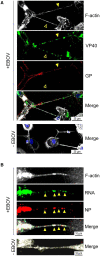
EBOV proteins and RNA localize to TNTs during infection. MΦs infected with EBOV at MOI = 1 for 48 hours were stained with phalloidin, RedDot2 dye (blue), and either (A) antibodies to VP40 and GP or (B) antibody to NP and a probe binding NP RNA. Samples were analyzed as in Figure 1B. The solid arrowheads point to TNTs positive for all tested viral factors. The hollow arrowhead points to a TNT containing only VP40. EBOV, Ebola virus; GP, glycoprotein; MOI, multiplicity of infection; NP, nucleoprotein; TNT, tunneling nanotube.
Figure 3.
Figure 3.
EBOV nucleocapsids traffic through TNTs in the absence of infection. A, HUVECs were transfected to express NP/VP35/VP24 proteins, VP40/GP proteins, or GFP or left untransfected. After 48 hours, cells were stained with phalloidin, RedDot2 (blue), and antibodies detecting NP or VP40/GP. The arrowhead points to nucleocapsids within the TNT. The maximum intensity projection of Z-stacks are shown. B, The ratio of transfected cells with TNTs in each sample was determined as follows: number of cells with TNTs / total number of transfected cells, and the data distribution are shown as a violin plot. C (left), HUVECs coexpressing NP/VP35/VP24/VP30-GFP for 48 hours were imaged by live-cell microscopy. Images were acquired in the brightfield and fluorescence modes for up to 120 frames. Each frame was photographed every 10 seconds for 20 minutes. Magnified images of the boxed region in the fluorescent mode are shown as selected frames in the right-side panels. The arrowhead points to a nucleocapsid trafficking through the TNT. C (right), Cells coexpressing NP/VP35/VP24/VP30-GFP for 48 hours were stained with phalloidin, sdAb ZE antibody, and VP35 antibody. The arrowhead points to a nucleocapsid within a TNT. D, HUVECs coexpressing either NP/VP35/VP24 or RFP for 24 hours were cocultured at the 1:1 ratio. After 48 hours, the samples were stained with phalloidin, RedDot2 (blue), and antibody detecting NP. A section through the middle of the cell and TNTs is shown. The dotted line marks the boundaries of an RFP-expressing cell. The blue and white arrowheads point to TNTs and nucleocapsids transferred to the RFP-expressing cell, respectively. ****P < .0001. EBOV, Ebola virus; GFP, green fluorescent protein; GP, glycoprotein; HUVEC, human umbilical vein endothelial cell; NP, nucleoprotein; ns, nonsignificant; RFP, red fluorescent protein; TNT, tunneling nanotube.
Figure 4.
Figure 4.
EBOV localizes to wide TNTs. MΦs infected with EBOV (MOI = 1) for 48 hours were stained with phalloidin and antibodies to (A) NP, Lamp-1, and LC3B or (B) NP and α-tubulin. Samples were imaged and analyzed as in Figure 1B. The solid arrowheads point to TNTs positive for a tested host factor. The hollow arrowheads point to TNTs containing F-actin only. C, The ratio of NP-positive TNTs containing the tested host factor was determined in >100 TNTs/sample and is shown as a mean (±SD) of 3 independent experiments. D, Infected MΦs were stained with phalloidin, RedDot2 dye (blue), and antibodies to NP and COX IV, and imaged as previously indicated. ****P < .0001. EBOV, Ebola virus; MΦ, monocyte-derived macrophage; MOI, multiplicity of infection; NP, nucleoprotein; TNT, tunneling nanotube.
Figure 5.
Figure 5.
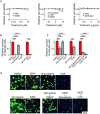
EBOV replicates in the presence of treatments targeting virus entry. A, MΦs were left untreated or were treated with EIPA, nocodazole, cytD, DMSO, GP KZ52 neutralizing antibody, or IgG isotype control at indicated concentrations for 72 hours. Cell viability was determined with CellTiter-Glo reagent. Nonlinear regression analysis was performed to select a nontoxic concentration (≥95% of cell viability) for each treatment relative to the untreated samples. B, MΦs were incubated with EIPA (25 µM), nocodazole (10 µM), cytD (5 µM), or an equal amount of DMSO or were left untreated for 1 hour. Cells were challenged with EBOV-GFP at MOI = 0.01 with treatments present. In the neutralization assay, 500 infectious particles of EBOV-GFP were incubated with GP KZ52 antibody or IgG isotype control (20 µg/mL) or medium for 30 minutes and then overlaid onto cells for 24 hours. Samples were stained with Hoechst dye, photographed, and analyzed by CellProfiler to quantify infected cells and nuclei (GFP positive). Infection efficiency in each sample was determined as number of infected cells / number of nuclei and reported relative to untreated samples. Mean infection efficiencies (±SDs) from 3 different experiments are shown. C, MΦs incubated with EBOV-GFP (MOI = 0.01) for 1 hour were overlaid with a medium containing EIPA, nocodazole, cytD, GP KZ52, GP KZ52/nocodazole, or GP KZ52/cytD treatments and appropriate controls, as previously indicated. The treatments were repeated 24 and 48 hours postinfection and analyzed as in panel B. D, Representative images of samples obtained in panel C. Samples were analyzed 72 hours postinfection as in panel B. ****P < .0001. cytD, cytochalasin D; DMSO, dimethylsufoxide; EBOV, Ebola virus; GFP, green fluorescent protein; GP, glycoprotein; MΦ, monocyte-derived macrophage; MOI, multiplicity of infection; TNT, tunneling nanotube.
Figure 6.
Figure 6.
LASV does not trigger TNT development. A, MΦs infected with EBOV-GFP or LASV-GFP (MOI = 1) for 48 hours were stained with antibodies to NP. Maximum intensity projections of Z-stacks are shown in the left panel. The number of infected cells with TNTs was counted manually in >100 cells/sample and is reported as a ratio to the total number of infected cells (graph on the right). The bars are averages (±SD) of 3 independent experiments. B, LASV-GFP–infected MΦs were processed and imaged as in panel A. The arrowhead points to a TNT between infected cells. C, MΦs infected with SUDV, REST, or MARV (MOI = 1) for 48 hours were stained with phalloidin and either sdAb ZE antibody (SUDV and RESTV samples) or sdAb A antibody (MARV sample). *P < .05. EBOV, Ebola virus; GFP, green fluorescent protein; LASV, Lassa virus; MΦ, monocyte-derived macrophage; MARV, Marburg virus; MOI, multiplicity of infection; NP, nucleoprotein; RESTV, Reston virus; SUDV, Sudan virus; TNT, tunneling nanotube.

References

    1. Feldmann H, Sprecher A, Geisbert TW. Ebola. N Engl J Med 2020; 382:1832–42. - PubMed
    1. Saeed MF, Kolokoltsov AA, Albrecht T, Davey RA. Cellular entry of Ebola virus involves uptake by a macropinocytosis-like mechanism and subsequent trafficking through early and late endosomes. PLoS Pathog 2010; 6:e1001110. - PMC - PubMed
    1. Nanbo A, Imai M, Watanabe S, et al. . Ebolavirus is internalized into host cells via macropinocytosis in a viral glycoprotein-dependent manner. PLoS Pathog 2010; 6:e1001121. - PMC - PubMed
    1. Yu DS, Weng TH, Wu XX, et al. . The lifecycle of the Ebola virus in host cells. Oncotarget 2017; 8:55750–9. - PMC - PubMed
    1. Takamatsu Y, Kolesnikova L, Becker S. Ebola virus proteins NP, VP35, and VP24 are essential and sufficient to mediate nucleocapsid transport. Proc Natl Acad Sci U S A 2018; 115:1075–80. - PMC - PubMed

Publication types

Substances