. 2023 Oct;601(20):4539-4556.
doi: 10.1113/JP285104. Epub 2023 Sep 19.

Structural and functional analysis of salivary intercalated duct cells reveals a secretory phenotype

Affiliations

Structural and functional analysis of salivary intercalated duct cells reveals a secretory phenotype

Amanda M Wahl et al. J Physiol. 2023 Oct.

Abstract

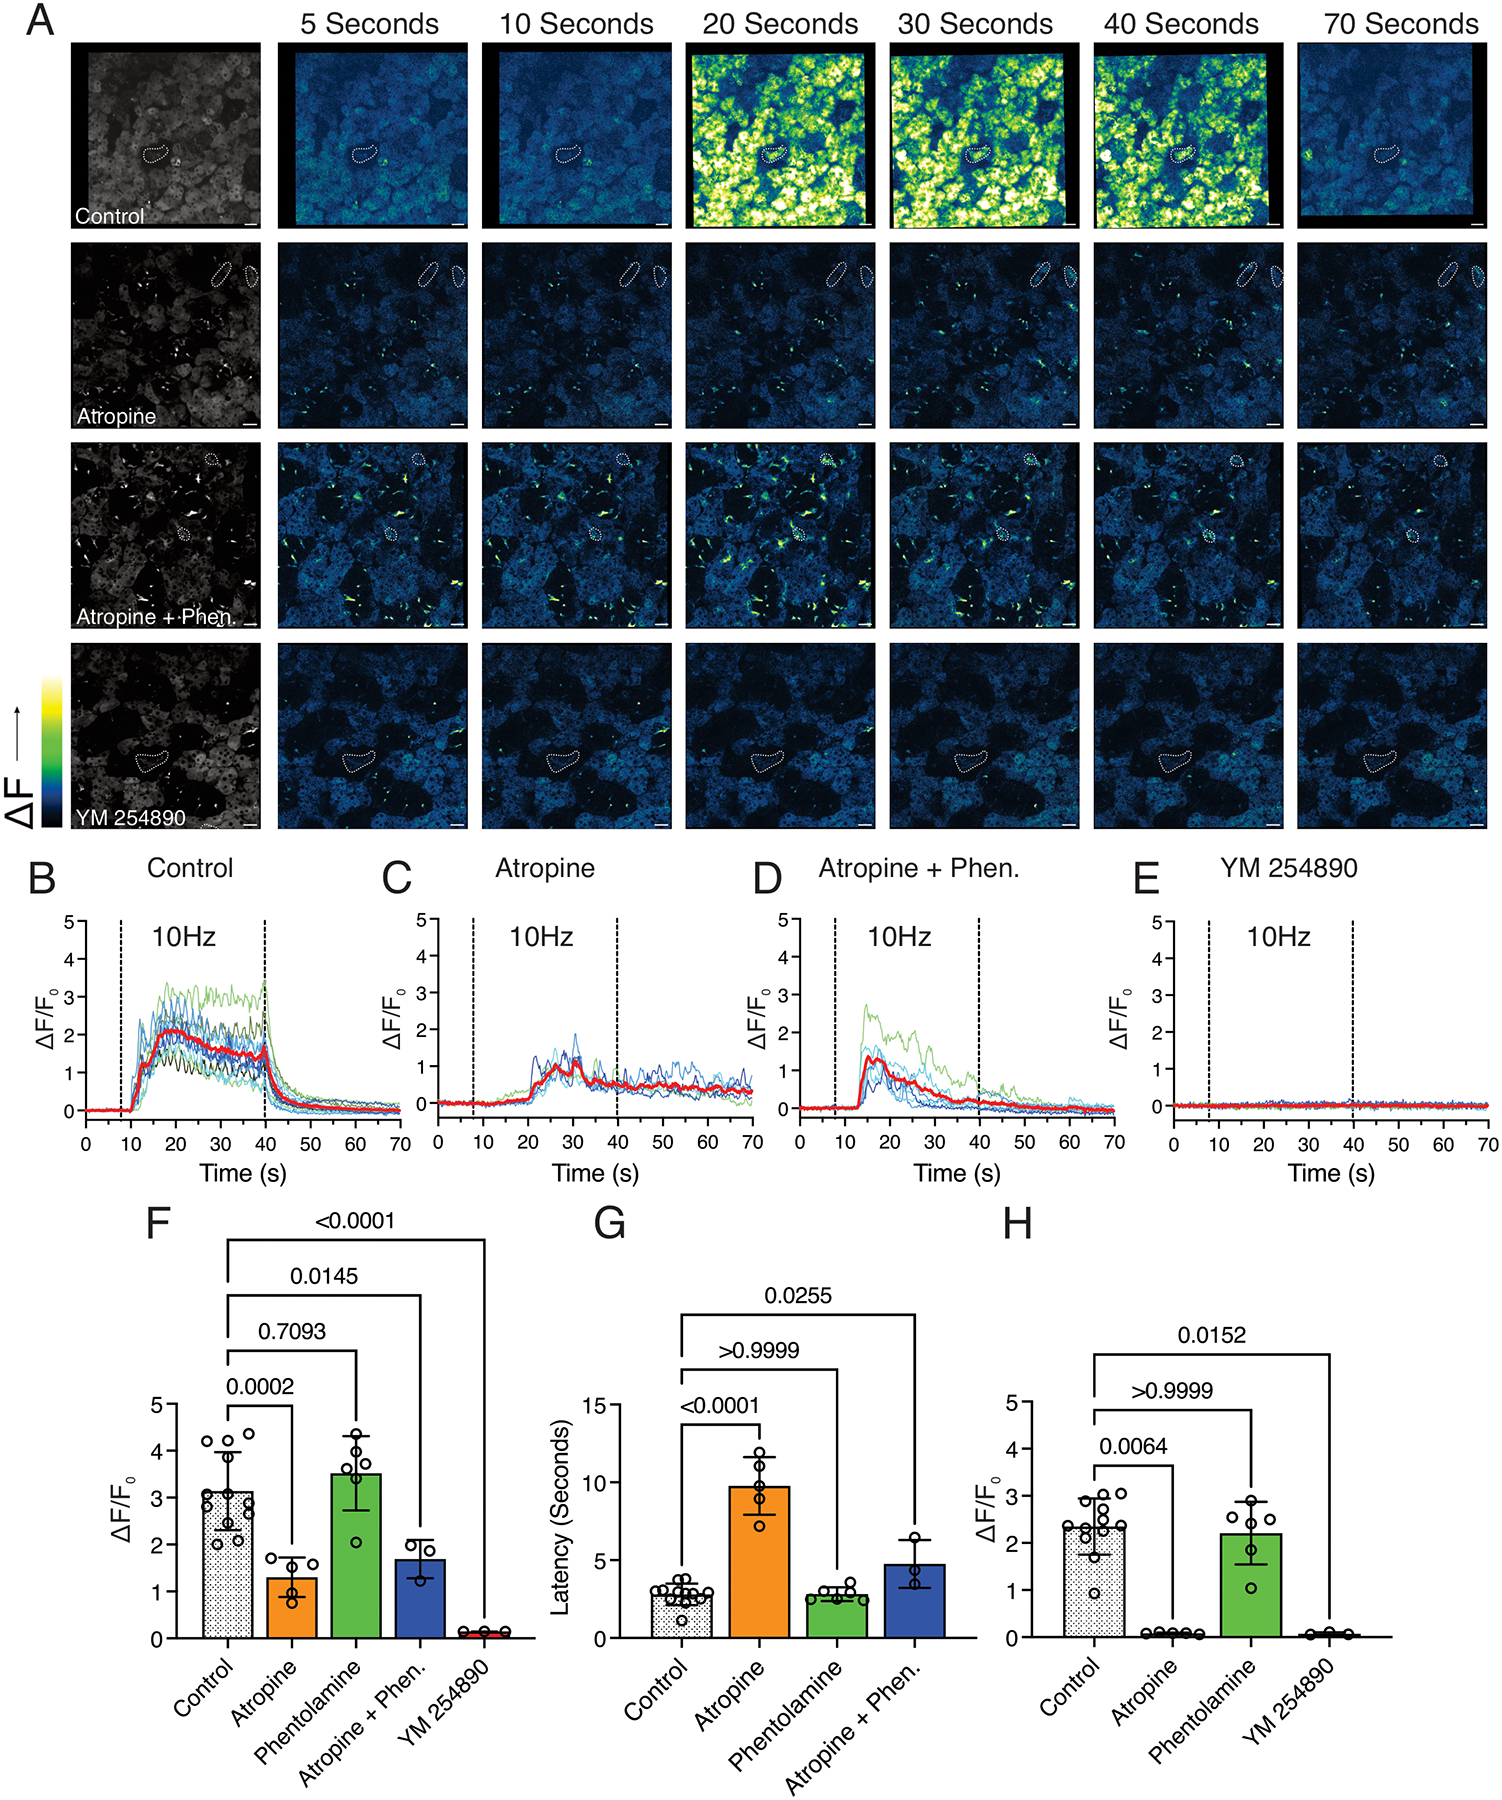
Currently, all salivary ducts (intercalated, striated and collecting) are assumed to function broadly in a similar manner, reclaiming ions that were secreted by the secretory acinar cells while preserving fluid volume and delivering saliva to the oral cavity. Nevertheless, there has been minimal investigation into the structural and functional differences between distinct types of salivary duct cells. Therefore, in this study, the expression profile of proteins involved in stimulus-secretion coupling, as well as the function of the intercalated duct (ID) and striated duct cells, was examined. Particular focus was placed on defining differences between distinct duct cell populations. To accomplish this, immunohistochemistry and in situ hybridization were utilized to examine the localization and expression of proteins involved in reabsorption and secretion of ions and fluid. Further, in vivo calcium imaging was employed to investigate cellular function. Based on the protein expression profile and functional data, marked differences between the IDs and striated ducts were observed. Specifically, the ID cells express proteins native to the secretory acinar cells while lacking proteins specifically expressed in the striated ducts. Further, the ID and striated duct cells display different calcium signalling characteristics, with the IDs responding to a neural stimulus in a manner similar to the acinar cells. Overall, our data suggest that the IDs have a distinct role in the secretory process, separate from the reabsorptive striated ducts. Instead, based on our evidence, the IDs express proteins found in secretory cells, generate calcium signals in a manner similar to acinar cells, and, therefore, are likely secretory cells. KEY POINTS: Current studies examining salivary intercalated duct cells are limited, with minimal documentation of the ion transport machinery and the overall role of the cells in fluid generation. Salivary intercalated duct cells are presumed to function in the same manner as other duct cells, reclaiming ions, maintaining fluid volume and delivering the final saliva to the oral cavity. Here we systematically examine the structure and function of the salivary intercalated duct cells using immunohistochemistry, in situ hybridization and by monitoring in vivo Ca2+ dynamics. Structural data revealed that the intercalated duct cells lack proteins vital for reabsorption and express proteins necessary for secretion. Ca2+ dynamics in the intercalated duct cells were consistent with those observed in secretory cells and resulted from GPCR-mediated IP3 production.

Keywords: fluid secretion; intracellular calcium; intravital imaging; salivary duct; salivary gland.


Figures

Figure 1.
Figure 1.. Identification of molecular markers of the intercalated duct cells in the murine submandibular gland.
(A) SMG tissue stained for the nuclear acinar cell marker MIST1 (grey) and the cytoskeletal protein keratin 7 (red). (B) SMG tissue stained for salivary α-amylase (green) and keratin 7 (red). (C) SMG tissue stained for MIST1 (grey) and the Ca2+ channel IP3R3 (red). (D) SMG tissue stained for the gap junction protein connexin 26 (green) and keratin 7 (red). Nuclei were stained with DAPI (blue). Area bounded by the dashed box was magnified. Dashed outline without a label marks the intercalated duct cells, (*) marks striated duct cells, and (#) marks acinar cells. Scale bars, 25μm.
Figure 2.
Figure 2.. Connexin 26 and connexin 32 distribution in the murine submandibular gland.
(A) SMG tissue stained for Cx26 (green) and the gap junction protein Cx32 (red). (B) A magnified region of A that excluded the intercalated and striated duct cells. The tissue was stained with Cx26 (green) and Cx32 (red). Nuclei were stained with DAPI (blue). Area bounded by the dashed box was magnified in B. Dashed outline without a label marks the intercalated duct cells, (*) marks striated duct cells, and (#) marks acinar cells. Scale bars, 25μm.
Figure 3.
Figure 3.. Evaluating the expression of proteins involved in reabsorption in the intercalated ducts.
(A) SMG tissue stained for the Na+ channel ENaC (green) and IP3R3 (red). (B) In situ hybridization performed on fresh-frozen SMG tissue. Tissue was probed for Scnn1a (green) and Cftr (red). (C) Frequency distribution plot for Cftr mRNA in striated duct cells (green, N= 167 cells), intercalated duct cells (blue, N= 153 cells), and acinar cells (magenta, N= 167 cells). (D) Frequency distribution plot of Scnn1a mRNA in striated duct cells (green, N= 167 cells), intercalated duct cells (blue, N= 153 cells), and acinar cells (magenta, N= 167 cells). Nuclei were stained with DAPI (blue). Area bounded by the dashed box was magnified. Dashed outline without a label marks the intercalated duct cells, (*) marks striated duct cells, and (#) marks acinar cells. Scale bars, 25μm.
Figure 4.
Figure 4.. Evaluating the expression of proteins involved in secretion in the intercalated ducts.
(A) SMG tissue stained for the water channel AQP5 (green) and IP3R3 (red). (B) SMG tissue stained for the Na+ -K+- 2Cl cotransporter NKCC1 (green) and IP3R3 (red). (C) SMG tissue stained for the Ca2+- activated Cl channel TMEM16a (green) and IP3R3 (red). (D) SMG tissue sections stained for the Ca2+ channel IP3R2 (green) and IP3R3 (red). Nuclei were stained with DAPI (blue). Area bounded by the dashed box was magnified. Dashed outline without a label marks the intercalated duct cells, (*) marks striated duct cells, and (#) marks acinar cells. Scale bars, 25μm.
Figure 5.
Figure 5.. Distribution of mRNA for Slc4a2 in the submandibular gland.
In situ hybridization performed on SMG tissue probing for Slc4a2 (grey). The right graph depicts the frequency distribution plot of Slc4a2 mRNA in striated duct cells (green, N= 180 cells), intercalated duct cells (blue, N=180 cells), and acinar cells (magenta, N= 180 cells). Nuclei were stained with DAPI (blue). Dashed outline without a label marks the intercalated duct cells, (*) marks striated duct cells, and (#) marks acinar cells. Scale bar, 25μm.
Figure 6.
Figure 6.. Examining the expression pattern of proteins involved in secretion in the mouse parotid and human submandibular intercalated ducts.
(A) Mouse PG tissue stained for AQP5 (green) and IP3R3 (red). (B) Mouse PG tissue stained for NKCC1 (green) and IP3R3 (red). (C) Human SMG tissue stained for AQP5 (green). (D) Human SMG tissue stained for TMEM16a (green). Nuclei were stained with DAPI (blue). Area bounded by the dashed box was magnified. Dashed outline without a label marks the intercalated duct cells, (*) marks striated duct cells, and (#) marks acinar cells. Scale bars, 25μm.
Figure 7.
Figure 7.. Evaluating Ca2+ signals in the intercalated duct cells in vivo.
(A) Grey-scale image depicts the average of the first 20 frames in the image series where the red dashed outline without a label marks the intercalated duct cells, (*) marks striated duct cells, and (#) marks acinar cells. (B) 3Hz, 5Hz, and 10Hz time series images before, during, and after nervous stimulation. (C) Individual traces representing the response to 3Hz, 5Hz, and 10Hz stimulation in randomly selected intercalated duct cells. The red line depicts the average of the cells. (D) Individual traces representing the response to 10Hz stimulation in randomly selected striated duct cells. The red line depicts the average of the cells. (E) Individual traces representing the response to 3Hz, 5Hz, and 10Hz stimulation in randomly selected acinar cells. The red line depicts the average of the cells. (F) Average peak Ca2+ in the intercalated duct (3Hz, 5Hz, 10Hz), acinar cells (3Hz, 5Hz, 10Hz), and striated duct cells (10Hz). (G) Average latency of the Ca2+ signal in the intercalated duct and acinar cells at the 3Hz, 5Hz, and 10Hz stimulations. All data are mean ± standard deviation. Each data point for F and G represents an average of all individual cell-types in all fields of view (FOV) imaged from individual mice. In F and G, for the intercalated ducts and acinar cells 3Hz [6 mice], 5Hz [10 mice], and 10Hz [12 mice]. For the striated duct cells in F, 10Hz [3 mice]. In F and G, each individual stimulation frequency was compared using a two-tailed t-test except for the 10Hz peak height, which was analyzed using a one-way ANOVA with Tukey’s test. If the data was not normally distributed, the data set was log-transformed and then reanalyzed using the two-tailed t-test. Scale bars, 25μm.
Figure 8.
Figure 8.. Distribution of the neurons in the murine SMG.
SMG tissue stained with beta-tubulin III (green) to label neurons and IP3R3 (red). Nuclei were stained with DAPI (blue). Area bounded by the dashed box was magnified. Dashed outline without a label marks the intercalated duct cells, (*) marks striated duct cells, and (#) marks acinar cells. Scale bars, 25μm.
Figure 9.
Figure 9.. Investigating the source of the Ca2+ signals in the intercalated ducts at a maximal, 10Hz stimulation.
(A) Grey-scale images depict the average of the first 20 frames in the image series where the dashed outline without a label marks the intercalated duct cells. The time series to the right depict images prior to, during, and following nervous stimulation in a control, atropine, atropine + phentolamine, and YM 254890 bathed field of view. (B) Representative traces from randomly selected intercalated duct cells in a control field of view. The red line depicts the average of the individual cells. (C) Representative traces from randomly selected intercalated duct cells in an atropine-bathed field of view. The red line depicts the average of the individual cells. (D) Representative traces from randomly selected intercalated duct cells in an atropine + phentolamine bathed field of view. The red line depicts the average of the individual cells. (E) Representative traces from randomly selected intercalated duct cells in a YM 254890 bathed field of view. The red line depicts the average of the individual cells. (F) Average peak Ca2+ in the intercalated ducts in control mice and mice where the gland was bathed in atropine, phentolamine, atropine + phentolamine, and YM 254890. (G) Average latency of the response in the intercalated ducts in control mice and mice where the gland was bathed in atropine, phentolamine, and atropine + phentolamine. (H) Average peak Ca2+ in the acinar cells in control mice and mice where the gland was bathed in atropine, phentolamine, and YM 254890. All data are mean ± standard deviation. Each data point for F, G, and H represents an average of all individual cell-types in all fields of view (FOV) imaged from individual mice. For F and G, Control [12 Mice], Atropine [5 mice], Phentolamine [6 mice], Atropine + Phentolamine [3 mice], YM 254890 [3 Mice]. For H, Control [12 Mice], Atropine [5 mice], Phentolamine [6 mice], and YM 254890 [3 Mice]. One-way ANOVA with Dunnett’s test was performed in F and G. For H, the data was non-parametric and was analyzed using the Kruskal-Wallis one-way analysis of variance with Dunn’s test. Scale bars, 25μm.
Figure 10.
Figure 10.. Schematic diagram of transport processes in salivary intercalated duct cells
A depiction of the secretion machinery we identified as being present in the intercalated duct cells (color). The machinery depicted in grey would be necessary for ion and water secretion but has yet to be localized in the intercalated duct cells.

References

    1. Ambudkar IS. (2011). Dissection of calcium signaling events in exocrine secretion. Neurochem Res 36, 1212–1221. - PMC - PubMed
    1. Ambudkar IS. (2016). Calcium signalling in salivary gland physiology and dysfunction. J Physiol 594, 2813–2824. - PMC - PubMed
    1. Arreola J, Melvin JE & Begenisich T. (1996a). Activation of calcium-dependent chloride channels in rat parotid acinar cells. J Gen Physiol 108, 35–47. - PMC - PubMed
    1. Arreola J, Park K, Melvin JE & Begenisich T. (1996b). Three distinct chloride channels control anion movements in rat parotid acinar cells. J Physiol 490 (Pt 2), 351–362. - PMC - PubMed
    1. Aure MH, Konieczny SF & Ovitt CE. (2015). Salivary gland homeostasis is maintained through acinar cell self-duplication. Dev Cell 33, 231–237. - PMC - PubMed

Publication types

LinkOut - more resources