

PRMT inhibitor promotes SMN2 exon 7 inclusion and synergizes with nusinersen to rescue SMA mice
- PMID: 37724723
- PMCID: PMC10630883
- DOI: 10.15252/emmm.202317683
PRMT inhibitor promotes SMN2 exon 7 inclusion and synergizes with nusinersen to rescue SMA mice
Abstract
Spinal muscular atrophy (SMA) is a leading genetic cause of infant mortality. The advent of approved treatments for this devastating condition has significantly changed SMA patients' life expectancy and quality of life. Nevertheless, these are not without limitations, and research efforts are underway to develop new approaches for improved and long-lasting benefits for patients. Protein arginine methyltransferases (PRMTs) are emerging as druggable epigenetic targets, with several small-molecule PRMT inhibitors already in clinical trials. From a screen of epigenetic molecules, we have identified MS023, a potent and selective type I PRMT inhibitor able to promote SMN2 exon 7 inclusion in preclinical SMA models. Treatment of SMA mice with MS023 results in amelioration of the disease phenotype, with strong synergistic amplification of the positive effect when delivered in combination with the antisense oligonucleotide nusinersen. Moreover, transcriptomic analysis revealed that MS023 treatment has minimal off-target effects, and the added benefit is mainly due to targeting neuroinflammation. Our study warrants further clinical investigation of PRMT inhibition both as a stand-alone and add-on therapy for SMA.
Keywords: PRMT inhibitor; nusinersen; small molecule; spinal muscular atrophy.
© 2023 The Authors. Published under the terms of the CC BY 4.0 license.
Conflict of interest statement
The authors declare that they have no conflict of interest.
Figures

- A–C
SMA type II patient‐derived fibroblasts were treated with the indicated small molecule at the appropriate maximum tolerated dose (range: 1–10 μM) (n = 3–4). Cells were harvested for RNA (A, B) and protein (C) quantification 48 and 72 h post‐treatment, respectively. (A) Full‐length (FL) SMN2 transcript levels relative to Δ7 SMN2 are expressed as fold change compared to untreated SMA fibroblasts, normalised to one (dashed line). FL SMN2/Δ7 SMN2 ratios were significantly increased by MS023 and decreased by LLY‐283 treatment. (B) Tot SMN2 transcript levels relative to GAPDH are expressed as fold change compared to untreated SMA fibroblasts, normalised to one (dashed line). (A, B) Each dot represents a biological replicate (n = 3–4). The grey bar indicates values within the 0.5–1.5 range. (C) SMN protein levels relative to total protein are expressed as fold change compared to untreated SMA fibroblasts, normalised to one (dashed line). Each dot represents a biological replicate (n = 2–4). Values ≥ 1.5 and ≤ 0.5 are depicted in red and blue, respectively. (A–C) Data are represented as mean ± standard error of the mean (s.e.m.) and compared with a one‐way ANOVA test with multiple comparisons (**P ≤ 0.01; ****P ≤ 0.0001).


- A
Chemical structure depiction of MS023 (PubChem CID: 92136227).
- B–D
SMA type II patient‐derived fibroblasts were treated with the indicated concentration of MS023 (range: 100 nM–10 μM), (n = 3–4). Cells were harvested for RNA (B) and protein (C, D) quantification 48 and 72 h post treatment, respectively (B). Full‐length (FL) SMN2 transcript levels relative to Δ7 SMN2 are expressed as fold change compared to untreated SMA fibroblasts, normalised to one. Each dot represents a biological replicate (n = 3–4). (C) Western blot showing SMN protein levels upon treatment with increasing MS023 concentrations (top). A representative section of total protein stain, used for protein normalisation, is shown (bottom). The size in kilodalton is indicated on the right. (D) Quantification of SMN protein levels relative to total protein is shown. Each dot represents a biological replicate (n = 3–4).
- E
Arginine monomethylation (MMA) and symmetric dimethylation (SDMA) of HNRNPA1 are increased and asymmetric dimethylation (ADMA) of HNRNPA1 is decreased upon MS023 treatment, as shown by HNRNPA1 immunoprecipitation, followed by a Western blot. SMA type II patient‐derived fibroblasts were treated with the indicated concentration of MS023 (range: 100 nM–1 μM). HNRNPA1 was immunoprecipitated and Western blots were performed using anti‐MMA, anti‐SDMA, anti‐ADMA, anti‐HNRNPA1, and anti‐tubulin antibodies.
- F
Quantification of arginine methylation changes normalised to total HNRNPA1 is shown.
- G
Ratio of FL SMN2 transcripts bound to HNRNPA1 protein and relative to GAPDH was assayed using crosslinking immunoprecipitation (CLIP) in SMA patient fibroblasts treated with increasing concentrations of MS023. IgG antibody and MS094 were used as controls, MS094 is a negative control for MS023 lacking PRMT inhibition property. Each dot represents a biological replicate (n = 2–4).
- H
Representation of the mechanism of exon 7 inclusion into the SMN2 transcript by MS023. Blue circles, purple squares, and red triangles represent asymmetric dimethylarginine (ADMA), symmetric dimethylarginine (SDMA), monomethylarginine (MMA), respectively.

- A
SMA type II patient‐derived fibroblasts were treated with the indicated concentration of MS023 (range: 100 nM–10 μM), (n = 3–4). Cells were harvested for RNA after 48 h incubation. Tot SMN2 transcript levels relative to GAPDH are expressed as fold change compared to untreated SMA fibroblasts, normalised to one. Each dot represents a biological replicate (n = 3–4).
- B, C
Full‐length (FL) SMN2 transcript levels relative to Δ7 SMN2 are expressed as fold change compared to untreated SMA type I and type III fibroblasts, normalised to one. Each dot represents a biological replicate (n = 2–6).
- D
Western blot showing SMN protein levels upon treatment with increasing MS094 (MS023 negative control) concentrations (top). A representative section of total protein stain, used for protein normalisation, is shown (bottom). The size in kilodalton is indicated on the right.
- E
Quantification of SMN protein levels relative to total protein is shown. Each dot represents a biological replicate (n = 5).
- F
Western blot showing vinculin protein (top), HNRNPA1 (middle), and histone 3 (bottom) levels upon treatment with increasing MS023 concentrations and in the cytoplasm (C) and nucleus (N). The size in kilodalton is indicated on the right.
- G
Quantification of HNRNPA1 protein levels relative to total protein is shown. Each dot represents a biological replicate (n = 4).

Diagram of the study design: SMA mice were treated daily with oral administrations of MS023 or vehicle (0.5% DMSO in saline) from postnatal day 0 (P0) using a Hamilton syringe.
Kaplan‐Meier survival estimation of unaffected mice (Smn+/−; SMN2+/−) and SMA affected mice (Smn−/−; SMN2+/−) treated with vehicle (n = 14), 1 mg/kg MS023 (n = 4), 2 mg/kg MS023 (n = 26), 5 mg/kg MS023 (n = 4), or 40 mg/kg MS023 (n = 4).
Body weights of unaffected (n = 12), MS023‐treated (n = 26), and vehicle‐treated (n = 12) SMA mice from postnatal day 0 are shown.
FL SMN2 transcript levels relative to Δ7 SMN2 in the spinal cord and skeletal muscle of treated mice compared to vehicle‐treated mice, normalised to one. Each dot represents a biological replicate (n = 3–9).
Western blot showing SMN protein levels upon MS023 treatment in spinal cords and skeletal muscles of treated mice (top). A representative section of total protein stain, used for protein normalisation, is also shown (bottom). The size in kilodalton is indicated on the right.
Quantification of SMN protein levels in the spinal cord and skeletal muscle relative to total protein is shown. Each dot represents a biological replicate (n = 3–8).
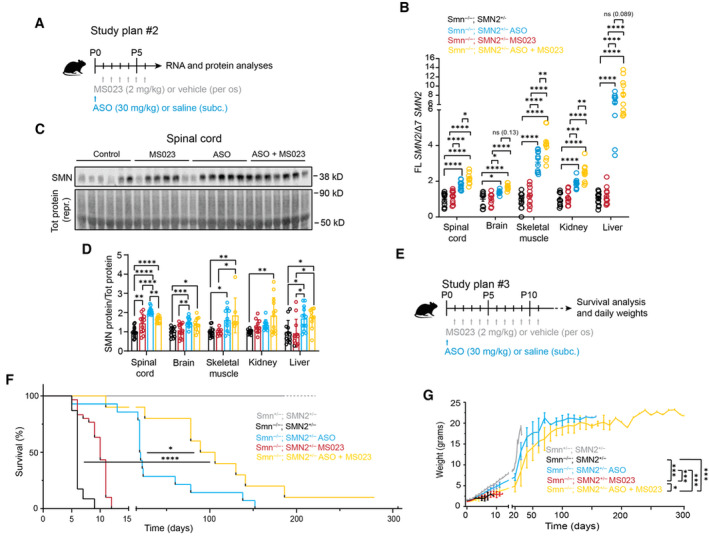
Diagrams of the study design. Study plan #2: At P0 SMA mice were injected subcutaneously with SMN2‐targeting ASO (30 mg/kg) or saline; from P1 mice were treated daily with oral administrations of MS023 (2 m/kg) or vehicle (0.5% DMSO in saline) using a Hamilton syringe until P6. At P7, mice were sacrificed and tissues collected for analysis.
FL SMN2 transcript levels relative to Δ7 SMN2 in spinal cord, brain, skeletal muscle, kidney and liver of treated SMA mice compared to vehicle‐treated SMA mice were normalised to one. Each dot represents a biological replicate (n = 10–12).
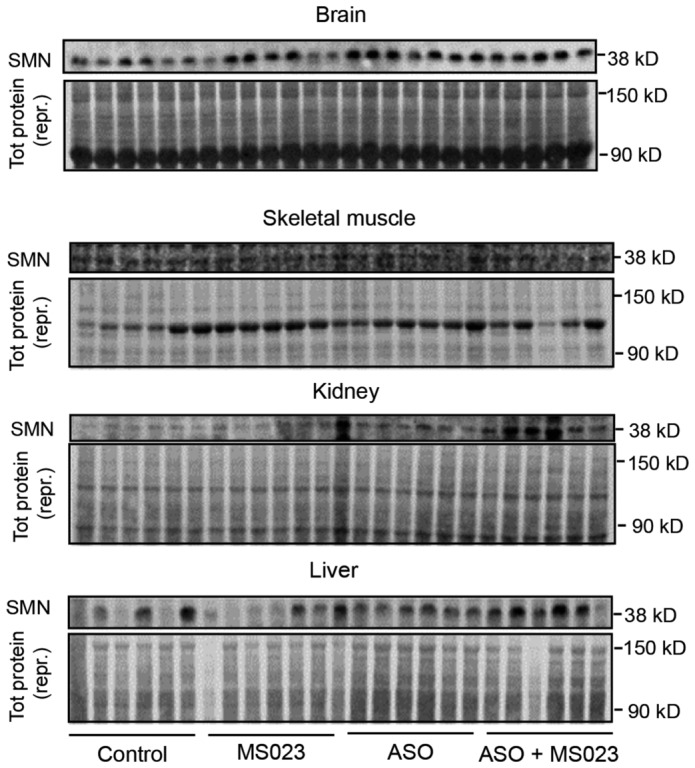
Western blot showing SMN protein levels upon the indicated treatments in spinal cords of SMA mice (top). A representative section of total protein stain, used for protein normalisation, is also shown (bottom). Size in kilodalton is indicated on the right.
Quantification of SMN protein levels relative to total protein is shown. Each dot represents a biological replicate (n = 7–13).
Study design #3: At P0 mice were injected subcutaneously with SMN2‐targeting ASO (30 mg/kg) or saline. From P1 mice were treated daily with oral administrations of MS023 (2 m/kg) or vehicle (0.5% DMSO in saline) using a Hamilton syringe until P12. Mice were weighed daily until they reached their humane end point.
Kaplan–Meier survival estimation of unaffected mice (Smn+/−; SMN2+/−) and SMA affected mice (Smn−/−; SMN2+/−) treated with SMN2‐targeting ASO (n = 15), MS023 (n = 14), SMN2‐targeting ASO and MS023 (n = 10), and vehicle (n = 23).
Body weights of unaffected (n = 12) and SMA mice (vehicle‐treated: n = 7; ASO: n = 13; MS023; n = 22; ASO + MS023: n = 10) from postnatal day 0 are shown. Unaffected mice were followed until 25 weeks of age.

Body weights of untreated (n = 12), MS023‐ (1 mg/kg: n = 10; 5 mg/kg: n = 9; 40 mg/kg: n = 4), or vehicle‐treated (n = 5) SMA mice from postnatal day 0 are shown.
Tot SMN2 transcript levels relative to PolJ and Gapdh in spinal cord and skeletal muscle of treated SMA mice compared to vehicle‐treated SMA mice, normalised to one. Each dot represents a biological replicate (n = 10–12).

- A
Pie charts showing the proportion of transcripts normalised upon the treatments among the genes that are upregulated (left) and downregulated (right) in SMA mice.
- B
Normalised counts were used to generate the hierarchical clustering heatmap. Upregulated and downregulated genes are displayed in yellow and blue, respectively. Control refers to unaffected (Smn+/−; SMN2+/−) mice.
- C, D
(C) Hallmark pathway analysis of genes upregulated and (D) downregulated in SMA corrected by the combinatorial treatment only.
- E
Plot charts show the distribution of splicing events (Ψ) in SMA mice upon treatment relative to wild‐type littermates. The red dotted lines mark the ± 15% normalisation range, corrected values are indicated in green.

Plot charts show the distribution of 446 aberrant splicing events (Ψ) in SMA mice relative to wild‐type littermates. The red dotted lines mark the ±15% normalisation range.
Pie chart showing the proportion of altered splicing events in the spinal cord of SMA mice compared to wild type (A3′SS, alternative 3′ splice site; A5′SS, alternative 5′ splice site; MXE, mutually exclusive exon; RI, intron retention; SE, skipped exon).
Similar articles
-
Combined treatment with the histone deacetylase inhibitor LBH589 and a splice-switch antisense oligonucleotide enhances SMN2 splicing and SMN expression in Spinal Muscular Atrophy cells.J Neurochem. 2020 Apr;153(2):264-275. doi: 10.1111/jnc.14935. Epub 2020 Jan 8. J Neurochem. 2020. PMID: 31811660
-
Rescue of gene-expression changes in an induced mouse model of spinal muscular atrophy by an antisense oligonucleotide that promotes inclusion of SMN2 exon 7.Genomics. 2015 Apr;105(4):220-8. doi: 10.1016/j.ygeno.2015.01.007. Epub 2015 Jan 31. Genomics. 2015. PMID: 25645699
-
An early Transcriptomic Investigation in Adult Patients with Spinal Muscular Atrophy Under Treatment with Nusinersen.J Mol Neurosci. 2024 Sep 26;74(4):89. doi: 10.1007/s12031-024-02251-1. J Mol Neurosci. 2024. PMID: 39325116 Free PMC article.
-
Nusinersen: A Review in 5q Spinal Muscular Atrophy.CNS Drugs. 2018 Jul;32(7):689-696. doi: 10.1007/s40263-018-0545-1. CNS Drugs. 2018. PMID: 30027400 Review.
-
Nusinersen: antisense oligonucleotide to increase SMN protein production in spinal muscular atrophy.Drugs Today (Barc). 2017 Jun;53(6):327-337. doi: 10.1358/dot.2017.53.6.2652413. Drugs Today (Barc). 2017. PMID: 28799578 Review.
Cited by
-
Biomedical effects of protein arginine methyltransferase inhibitors.J Biol Chem. 2025 Mar;301(3):108201. doi: 10.1016/j.jbc.2025.108201. Epub 2025 Jan 16. J Biol Chem. 2025. PMID: 39826691 Free PMC article. Review.
-
Patient-specific responses to SMN2 splice-modifying treatments in spinal muscular atrophy fibroblasts.Mol Ther Methods Clin Dev. 2024 Nov 13;32(4):101379. doi: 10.1016/j.omtm.2024.101379. eCollection 2024 Dec 12. Mol Ther Methods Clin Dev. 2024. PMID: 39655308 Free PMC article.
-
The effect of coadministration of D156844 and AR42 (REC-2282) on the survival and motor phenotype of mice with spinal muscular atrophy.Sci Rep. 2025 Aug 7;15(1):28866. doi: 10.1038/s41598-025-12194-1. Sci Rep. 2025. PMID: 40775246 Free PMC article.
-
The SMN-ribosome interplay: a new opportunity for Spinal Muscular Atrophy therapies.Biochem Soc Trans. 2024 Feb 28;52(1):465-479. doi: 10.1042/BST20231116. Biochem Soc Trans. 2024. PMID: 38391004 Free PMC article. Review.
References
-
- Alamancos GP, Agirre E, Eyras E (2014) Methods to study splicing from high-throughput RNA sequencing data. Methods Mol Biol 1126: 357–397 - PubMed
-
- Allis CD, Berger SL, Cote J, Dent S, Jenuwien T, Kouzarides T, Pillus L, Reinberg D, Shi Y, Shiekhattar R et al (2007) New nomenclature for chromatin‐modifying enzymes. Cell 131: 633–636 - PubMed
Publication types
MeSH terms
Substances
Associated data
- Actions
Grants and funding
LinkOut - more resources
Full Text Sources
Medical
Molecular Biology Databases
Research Materials
