

Transcriptomic landscape of Atlantic salmon (Salmo salar L.) skin
- PMID: 37724757
- PMCID: PMC10627282
- DOI: 10.1093/g3journal/jkad215
Transcriptomic landscape of Atlantic salmon (Salmo salar L.) skin
Abstract
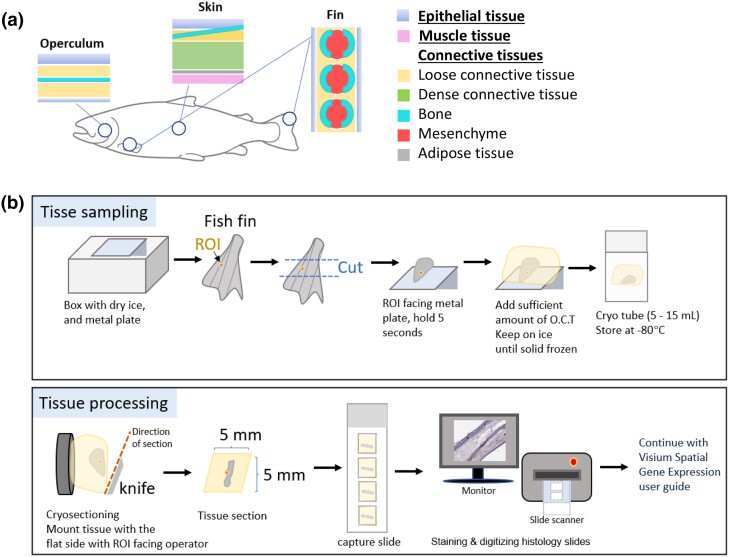
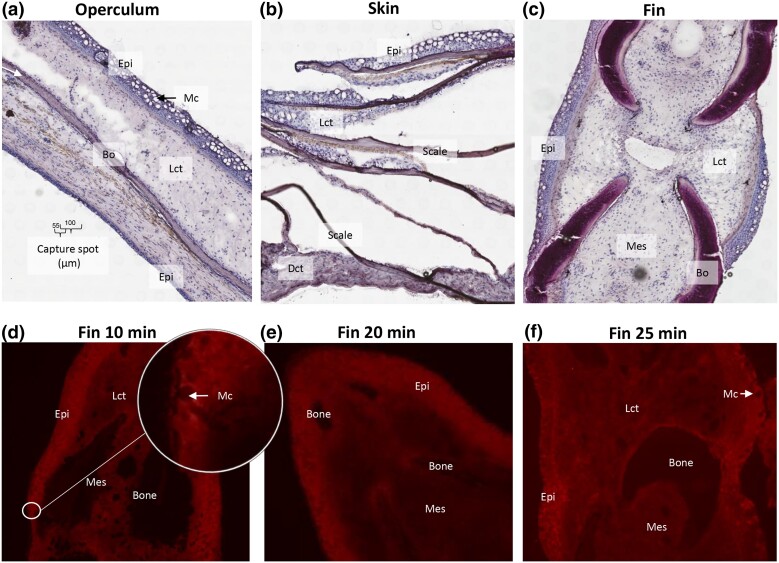
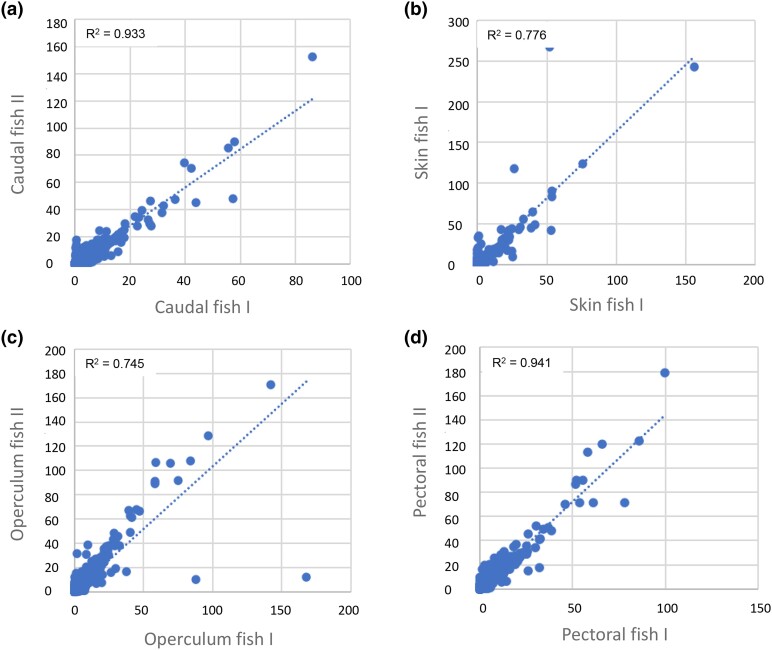
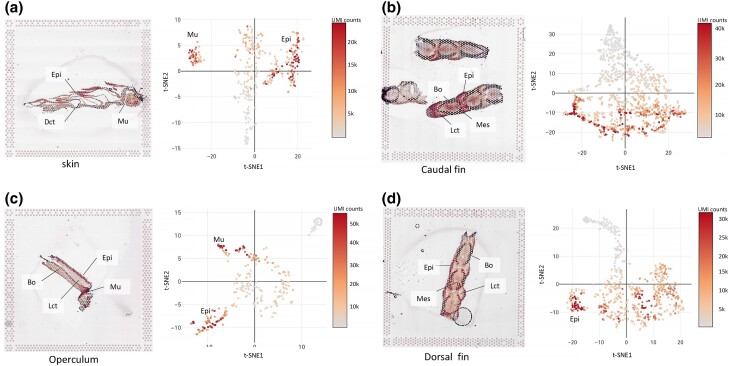
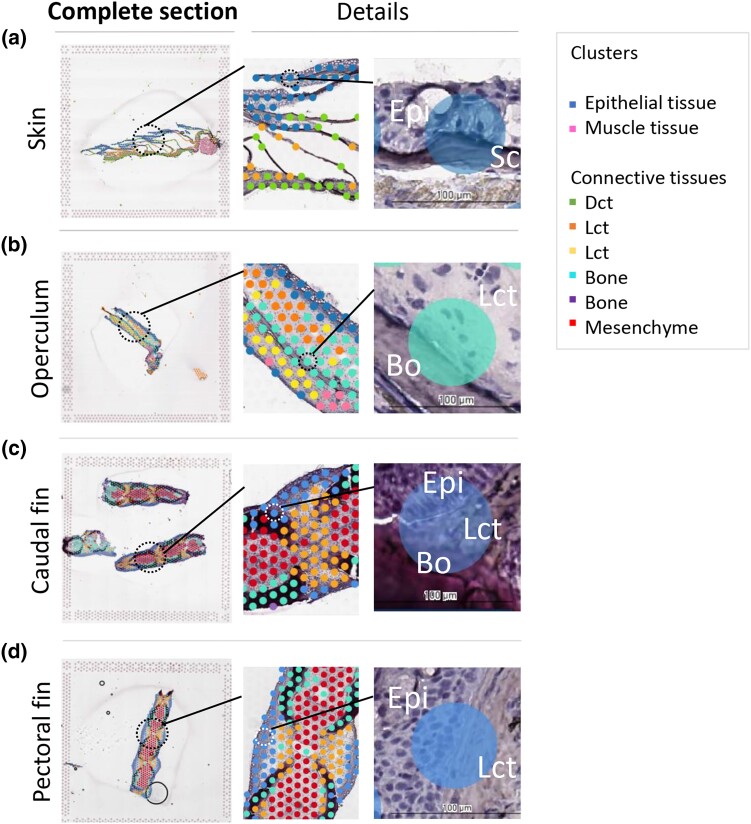
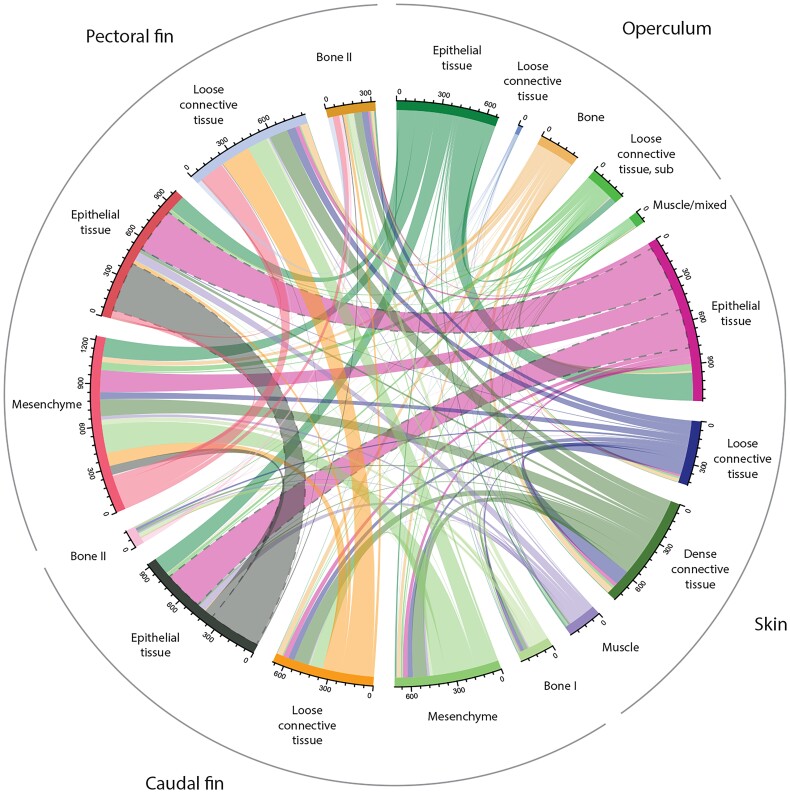
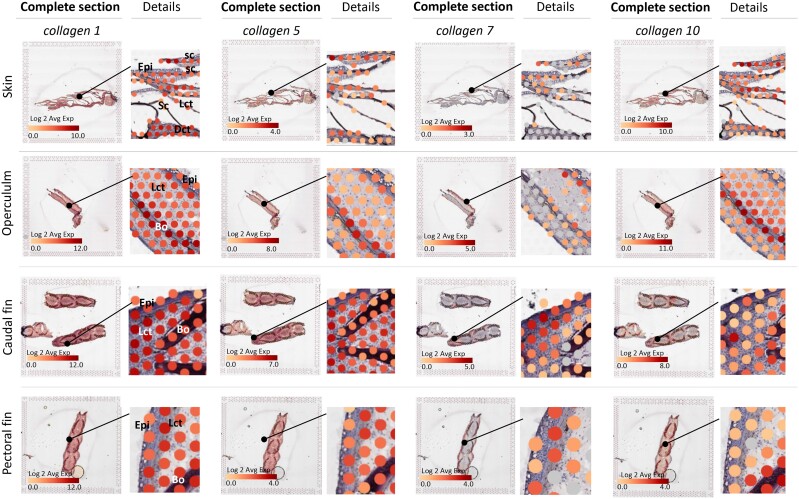
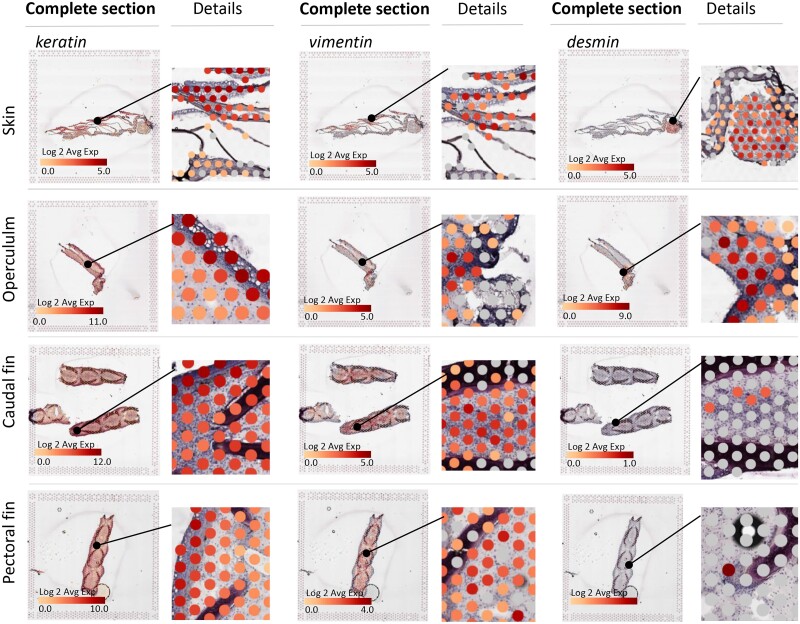
In this study, we present the first spatial transcriptomic atlas of Atlantic salmon skin using the Visium Spatial Gene Expression protocol. We utilized frozen skin tissue from 4 distinct sites, namely the operculum, pectoral and caudal fins, and scaly skin at the flank of the fish close to the lateral line, obtained from 2 Atlantic salmon (150 g). High-quality frozen tissue sections were obtained by embedding tissue in optimal cutting temperature media prior to freezing and sectioning. Further, we generated libraries and spatial transcriptomic maps, achieving a minimum of 80 million reads per sample with mapping efficiencies ranging from 79.3 to 89.4%. Our analysis revealed the detection of over 80,000 transcripts and nearly 30,000 genes in each sample. Among the tissue types observed in the skin, the epithelial tissues exhibited the highest number of transcripts (unique molecular identifier counts), followed by muscle tissue, loose and fibrous connective tissue, and bone. Notably, the widest nodes in the transcriptome network were shared among the epithelial clusters, while dermal tissues showed less consistency, which is likely attributable to the presence of multiple cell types at different body locations. Additionally, we identified collagen type 1 as the most prominent gene family in the skin, while keratins were found to be abundant in the epithelial tissue. Furthermore, we successfully identified gene markers specific to epithelial tissue, bone, and mesenchyme. To validate their expression patterns, we conducted a meta-analysis of the microarray database, which confirmed high expression levels of these markers in mucosal organs, skin, gills, and the olfactory rosette.
Keywords: RNAseq; bone; connective tissue; epithelium; fin; fish skin; gene expression; histology; mesenchyme; spatial transcriptomics.
© The Author(s) 2023. Published by Oxford University Press on behalf of The Genetics Society of America.
Conflict of interest statement
Conflicts of interest statement The authors declare no conflict of interest.
Figures
Similar articles
-
Transcriptome profiling the gills of amoebic gill disease (AGD)-affected Atlantic salmon (Salmo salar L.): a role for tumor suppressor p53 in AGD pathogenesis?Physiol Genomics. 2006 Jun 16;26(1):15-34. doi: 10.1152/physiolgenomics.00320.2005. Epub 2006 Feb 21. Physiol Genomics. 2006. PMID: 16493018
-
Transcriptomic Profiling of the Adaptive and Innate Immune Responses of Atlantic Salmon to Renibacterium salmoninarum Infection.Front Immunol. 2020 Oct 28;11:567838. doi: 10.3389/fimmu.2020.567838. eCollection 2020. Front Immunol. 2020. PMID: 33193341 Free PMC article.
-
Transcriptomic Profiling in Fins of Atlantic Salmon Parasitized with Sea Lice: Evidence for an Early Imbalance Between Chalimus-Induced Immunomodulation and the Host's Defense Response.Int J Mol Sci. 2020 Mar 31;21(7):2417. doi: 10.3390/ijms21072417. Int J Mol Sci. 2020. PMID: 32244468 Free PMC article.
-
How Can Spatial Transcriptomic Profiling Advance Our Understanding of Skin Diseases?J Invest Dermatol. 2025 Mar;145(3):522-535. doi: 10.1016/j.jid.2024.07.006. Epub 2024 Aug 22. J Invest Dermatol. 2025. PMID: 39177547 Review.
-
Spatial transcriptomic approaches for characterising the bone marrow landscape: pitfalls and potential.Leukemia. 2025 Feb;39(2):291-295. doi: 10.1038/s41375-024-02480-8. Epub 2024 Nov 28. Leukemia. 2025. PMID: 39609595 Free PMC article. Review. No abstract available.
Cited by
-
Comparative transcriptome analysis of albino northern snakehead (Channa argus) reveals its various collagen-related DEGs in caudal fin cells.PLoS One. 2024 Dec 31;19(12):e0315996. doi: 10.1371/journal.pone.0315996. eCollection 2024. PLoS One. 2024. PMID: 39739744 Free PMC article.
-
Transcriptomic characterization of transitioning cell types in the skin of Atlantic salmon.BMC Biol. 2025 Apr 28;23(1):109. doi: 10.1186/s12915-025-02196-w. BMC Biol. 2025. PMID: 40289111 Free PMC article.
-
Advancing genetic improvement in the omics era: status and priorities for United States aquaculture.BMC Genomics. 2025 Feb 17;26(1):155. doi: 10.1186/s12864-025-11247-z. BMC Genomics. 2025. PMID: 39962419 Free PMC article. Review.
-
Keratinocytes drive the epithelial hyperplasia key to sea lice resistance in coho salmon.BMC Biol. 2024 Jul 29;22(1):160. doi: 10.1186/s12915-024-01952-8. BMC Biol. 2024. PMID: 39075472 Free PMC article.
-
Local inflammation at the salmon louse (Lepeophtheirus salmonis) attachment site contributes to copepodid rejection in coho salmon (Oncorhynchus kisutch).Cell Tissue Res. 2025 Aug;401(2):181-211. doi: 10.1007/s00441-025-03976-0. Epub 2025 Jun 4. Cell Tissue Res. 2025. PMID: 40464919 Free PMC article.
References
-
- Baccin C, Al-Sabah J, Velten L, Helbling PM, Grünschläger F, Hernández-Malmierca P, Nombela-Arrieta C, Steinmetz LM, Trumpp A, Haas S. 2020. Combined single-cell and spatial transcriptomics reveal the molecular, cellular and spatial bone marrow niche organization. Nat Cell Biol. 22(1):38–48. doi:10.1038/s41556-019-0439-6. - DOI - PMC - PubMed
-
- Baglama J, Reichel L. 2005. Augmented implicitly restarted Lanczos bidiagonalization methods. SIAM J Sci Comput. 27(1):19–42. doi:10.1137/04060593X. - DOI
Publication types
MeSH terms
LinkOut - more resources
Full Text Sources