. 2023 Jan-Dec:32:9636897231200059.
doi: 10.1177/09636897231200059.

Establishing an Efficient Electroporation-Based Method to Manipulate Target Gene Expression in the Axolotl Brain

Affiliations

Establishing an Efficient Electroporation-Based Method to Manipulate Target Gene Expression in the Axolotl Brain

Sulei Fu et al. Cell Transplant. 2023 Jan-Dec.

Abstract

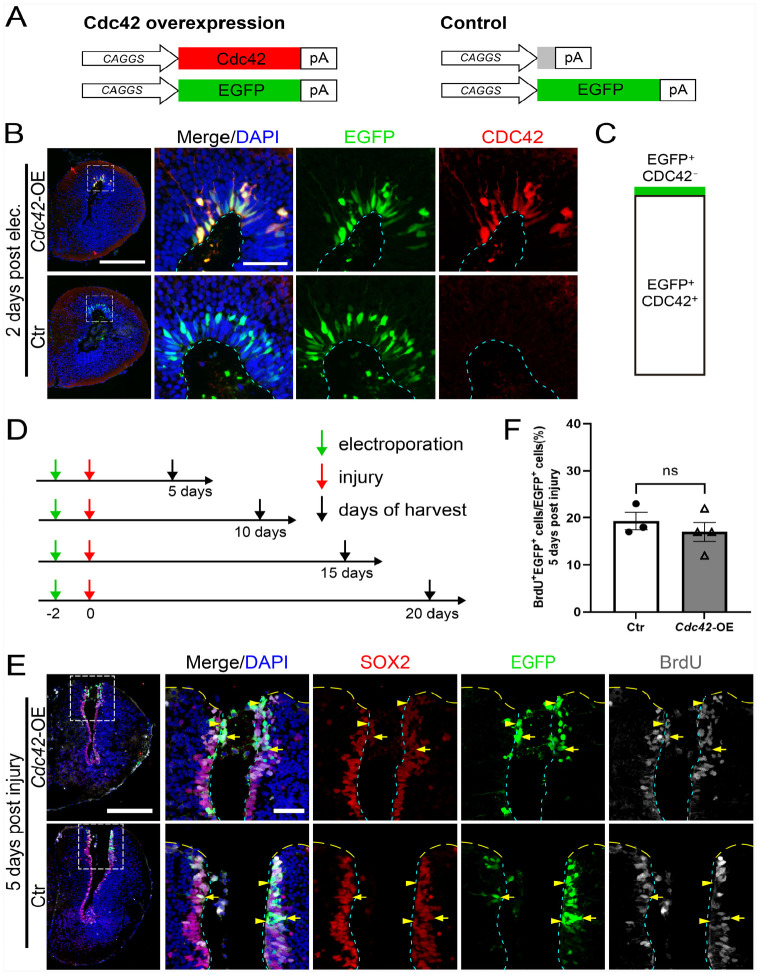
The tetrapod salamander species axolotl (Ambystoma mexicanum) is capable of regenerating injured brain. For better understanding the mechanisms of brain regeneration, it is very necessary to establish a rapid and efficient gain-of-function and loss-of-function approaches to study gene function in the axolotl brain. Here, we establish and optimize an electroporation-based method to overexpress or knockout/knockdown target gene in ependymal glial cells (EGCs) in the axolotl telencephalon. By orientating the electrodes, we were able to achieve specific expression of EGFP in EGCs located in dorsal, ventral, medial, or lateral ventricular zones. We then studied the role of Cdc42 in brain regeneration by introducing Cdc42 into EGCs through electroporation, followed by brain injury. Our findings showed that overexpression of Cdc42 in EGCs did not significantly affect EGC proliferation and production of newly born neurons, but it disrupted their apical polarity, as indicated by the loss of the ZO-1 tight junction marker. This disruption led to a ventricular accumulation of newly born neurons, which are failed to migrate into the neuronal layer where they could mature, thus resulted in a delayed brain regeneration phenotype. Furthermore, when electroporating CAS9-gRNA protein complexes against TnC (Tenascin-C) into EGCs of the brain, we achieved an efficient knockdown of TnC. In the electroporation-targeted area, TnC expression is dramatically reduced at both mRNA and protein levels. Overall, this study established a rapid and efficient electroporation-based gene manipulation approach allowing for investigation of gene function in the process of axolotl brain regeneration.

Keywords: CRIPSR/Cas9; Cdc42 overexpression; axolotl; electroporation; knockout/knockdown.


Conflict of interest statement

The author(s) declared no potential conflicts of interest with respect to the research, authorship, and/or publication of this article.

Figures

Figure 1.
Figure 1.
Morphology and cellular composition of axolotl’s telencephalon. (A) Schematic of axolotl brain (top panel) showing the location of the brain in the animal and the enlarged view of the brain showing the ventricular lumen (the yellow shape with orange outlines) inside the brain. HE staining (bottom panel) on cross-cryosections of the telencephalon in different regions from rostral to cauda (the cyan lines on the top panel indicate the section locations). The asterisks indicate the choroid plexus. Scale bar, 500 µm. (B) Immunofluorescence for SOX2 (red), TUJ1 (yellow), and BrdU (white) combined with DAPI (blue) on the axolotl left telencephalon cross-cryosections (top). The white dashed box indicates higher magnification (bottom). The white dotted line outlines the surface of telencephalon, and the cyan dotted line outlines the VZ surface facing the lumen. Scale bar, 500 μm at low magnification images and 100 μm at high magnification images. (C) Immunofluorescence for SOX2 (red) and NEUN (cyan) on the axolotl left telencephalon cross-cryosections (top) with DAPI (blue). The NEUN channel is shown in different detector gain values. The white dashed box indicates higher magnification (bottom). The yellow arrowheads indicate the double-positive cells of SOX2 and NEUN. The white arrows indicate the SOX2 single-positive cells located in the neuronal layer. The white dotted line outlines the surface of telencephalon, and the cyan dotted line outlines the VZ surface facing the lumen. Scale bar, 500 μm at low magnification images and 100 μm at high magnification images. HE: hematoxylin and eosin; VZ: ventricular zone.
Figure 2.
Figure 2.
Electroporation of telencephalon EGCs in axolotl. (A) Schematic diagram showing the structure of reporter plasmid pCAGGs: EGFP. The construct contains ubiquitous chicken β-actin promoter with a CMV enhancer (CAGGs) driving EGFP expression, followed by rabbit β Globulin polyA signal sequence. (B) A schematic diagram of axolotl telencephalon electroporation procedure. In order to deliver specifically to EGCs in the VZ via electroporation, the mixture solution of plasmids was injected into the lateral ventricle of the telencephalon, following electroporation with tweezer-style plate electrodes. (C) The schemes and representative fluorescent images of electroporating reporter gene (pCAGGs: EGFP) toward specific regions of axolotl telencephalon VZ. For manipulating desired EGC region of telencephalon, the anode electrode is placed on the corresponding side. “+” indicates the anode electrode, “−” indicates the cathode electrode. The black circles with white “-” filled in the ventricle indicate the DNA plasmids which are negatively charged, and the black arrow aside the brain indicates the moving direction of plasmids. Noted that the negatively charged plasmids will always move toward the anode electrode under the electric field. EGFP fluorescence (unstained, green) combined with DAPI (blue) on cross-cryosections of electroporated telencephalon showing the corresponding electroporated area. Scale bar, 500 µm. (D and E) EGFP fluorescence (unstained, green) and immunofluorescence for SOX2 (red in D), ZO-1 (white in D) and NEUN (red in E) combined with DAPI (blue) on cross-cryosections of electroporated telencephalon show the distribution and identity of EGFP-positive cells at 2 days after electroporated reporter plasmid pCAGGs: EGFP. The white dashed box indicates higher magnification as single channel or merged images. Scale bar, 500 μm at low magnification images and 100 μm at high magnification images. EGCs: ependymal glial cells; VZ: ventricular zone.
Figure 3.
Figure 3.
Cdc42 overexpression combined with brain injury. (A) The combinate mixtures of plasmids used for overexpression electroporation. The left panel shows the structure of target gene construct pCAGGS: Cdc42 (top) and reporter construct pCAGGS: EGFP (bottom) which are mixed for injection in Cdc42 overexpression. The right panel shows the structure of two plasmids used for the control group, pCAGGS: null (top) and pCAGGS: EGFP (bottom). The red rectangle indicates full-length Cdc42 coding sequence, the green rectangle indicates EGFP coding sequence, the gray rectangle indicates multiple cloning sites, and pA stands for polyadenylation signal. (B) EGFP fluorescence (unstained, green) and immunofluorescence for CDC42 (red) combined with DAPI (blue) on brain cross-cryosections of 2 days post electroporation show the high expression level of CDC42 in Cdc42 overexpression group (upper panel) compared with the control (lower panel). The images of Cdc42 overexpression group show that the CDC42 signals nearly colocalize with EGFP. The white dash box indicates higher magnification of electroporated areas of dorsal telencephalon shown as merged and single channel images. The cyan dotted line outlines the VZ surface facing the lumen. Scale bar, 500 μm at low magnification images and 100 μm at high magnification images. (C) The graph shows that in transfected cells electroporated with Cdc42 and EGFP expressing plasmids, the majority (95.7%, counted from four animals) are CDC42 and EGFP double-positive. (D) The timeline for brain injury sample harvest after electroporation. Brain injury was performed 2 days post electroporation in both Cdc42 overexpression and control groups. Animals receive intraperitoneal BrdU injection and are harvested at 5, 10, 15, and 20 days post injury, respectively. For the animals harvested at 5 days, a single injection of BrdU is performed 6 h before harvest. For other time points, cumulative BrdU labeling is performed by injecting BrdU every 2 days from the day of injury until harvest. (E) EGFP fluorescence (unstained, green) and immunofluorescence for SOX2 (red), BrdU (white) combined with DAPI (blue) on cross-cryosections of regenerating brains at 5 days post injury. In both Cdc42 overexpression brain (upper panel) and control brain (lower panel), there existed a part of EGFP-positive cells that are labeled by BrdU (yellow arrows showing one representative cell). The regenerating areas of dorsal telencephalon highlighted by white dash box are shown with higher magnification as merged or single channel images. The yellow dotted line outlines the surface of telencephalon, and the cyan dotted line outlines the VZ surface facing the lumen. Scale bar, 500 μm at low magnification images and 100 μm at high magnification images. (F) Quantification of the percentage of BrdU and EGFP double-positive cells over total EGFP-positive cells showing no significant difference between the overexpression group (triangles, n = 4) and the control (circles, n = 3). VZ: ventricular zone.
Figure 4.
Figure 4.
Effect of Cdc42 overexpression on neurogenesis. (A) EGFP fluorescence (unstained, green) and immunofluorescence for SOX2 (red), TUJ1 (yellow) combined with DAPI (blue) on cross-cryosections of regenerating brains at 5 days post injury. Noted that there are more TUJ1 and EGFP double-positive cells (cyan arrowhead indicated) that emerged at the VZ and inside the lumen in the overexpression group (upper panel) than the control (lower panel). The regenerating areas of dorsal telencephalon highlighted by white dash box are shown with two higher magnifications as merged or single channel images. The white dotted line outlines the surface of telencephalon, and the cyan dotted line outlines the VZ surface facing the lumen. Scale bar, 500 μm at low magnification images and 100 μm at high magnification images. (B) Quantification of the percentage of TUJ1 and EGFP double-positive cells to total EGFP-positive cells adjacent to the lesion of 5 days post injury shows no significant difference between Cdc42 overexpression group (triangles, n = 4) and the control (circles, n = 3). (C) Quantification of the percentage of TUJ1 and EGFP double-positive cells located at the VZ and inside the lumen over total TUJ1 and EGFP double-positive cells adjacent to the lesion at 5 days post injury. The proportion of double-positive cells in the VZ of overexpression group (78.2%, triangles, n = 4) is significantly higher than the control (23.6%, circles, n = 3). (D) EGFP fluorescence (unstained, green) and immunofluorescence for SOX2 (red), NEUN (cyan) combined with DAPI (blue) on cross-cryosections of regenerating brains at 20 days post injury. In the Cdc42 overexpression group (upper panel), almost no cell is NEUN and EGFP double-positive while double-positive cells (yellow arrowhead indicated) emerge within the neuronal layer in the control (lower panel). The white dash box of dorsal telencephalon regenerating areas are shown in higher magnification as merged or single channel images. The white dotted line outlines the surface of telencephalon, and the yellow dotted line outlines the VZ surface facing the lumen. (E) Quantification of the percentage of NEUN and EGFP double-positive cells to EGFP-positive cells adjacent to the lesion of 20 days post injury. The proportion of double-positive cells in the overexpression group (1.6%, triangles, n = 4) is significantly lower than the control (12.6%, circles, n = 3). VZ: ventricular zone. Values are considered statistically significant when p < 0.05. *** indicates p < 0.001, **** indicates p < 0.0001.
Figure 5.
Figure 5.
Effect of Cdc42 overexpression on cellular polarity and migration. (A and B) EGFP fluorescence (unstained, green) and immunofluorescence for SOX2 (red), ZO-1 (white) combined with DAPI (blue) on cross-cryosections of regenerating brains at 5 days and 20 days post injury, respectively. In both the 5-day and 20-day post-injury samples, the continuity of ZO-1 lining the VZ is observed to be interrupted at the electroporated area in the overexpression group (upper panel), compared to the control (lower panel). The yellow dotted line outlines the surface of telencephalon, and cyan dotted line outlines the VZ surface facing the lumen. Scale bar, 100 μm. (C) Successive images of EGFP fluorescence (unstained, green) and immunofluorescence for SOX2 (red), combined with DAPI (blue) on telencephalon cross-cryosection for 5, 10, 15, and 20 days post injury (from left to right). The EGFP-positive cells reside basically in the VZ and in the lumen in Cdc42 overexpression animals (upper panel), while the EGFP-positive cells progressively migrate from the VZ into the neuronal cell layer in the control (lower panel). The yellow arrowheads indicated the EGFP-positive cells that migrate into the neuronal layer. The red dotted line outlines the edge of VZ facing the lumen, and the white dotted line divides the VZ area and neuronal cell layer. Scale bar, 100 μm. (D and E) Representative whole-brain fluorescent stereomicroscopy and immunofluorescent images of cross-cryosections are shown at 5 and 20 days post injury. At 5 days post injury (D), the incision at the dorsal part of left telencephalon is similar in both Cdc42 overexpression and control animals. In 20-day post-injury animals (E), the wound does not close in Cdc42 overexpression group, while the wound closes in the control. The dash boxes highlight the regenerating areas of dorsal telencephalon for higher magnification. The white dotted lines outline the wound edges of brains. Scale bar, 500 μm at low magnification images and 100 μm at high magnification images. VZ: ventricular zone. BF: bright field.
Figure 6.
Figure 6.
Knockdown of Tnc in axolotl telencephalon by CAS9 protein–gRNA complexes electroporation. (A) TnC expression at 2, 5, 10, 20, and 30 days post injury of the axolotl regenerating telencephalons, presented by spatial visualization Stereo-seq maps (top panel, the color shade of dots denotes TnC expression level in cells, darker colors indicate higher expression level) and their corresponding in situ hybridization images (bottom). Scale bar, 500 µm. (B) The timeline of animal treatments involves surgical injury to the electroporated telencephalons at 2 days post electroporation, and harvested at 5 days post injury for Tnc expression detection. (C) A scheme is shown for electroporating CAS9 protein-gRNA complexes and performing an incision to the dorsal part of the electroporated telencephalons. (D) Representative in situ hybridization images on cross-cryosections show mRNA-level TnC expression at axolotl telencephalons incision site with electroporating different gRNA mixtures. For Tnc knockout, the mixture consisted of Tnc gRNAs (mix1 contains gRNA 1 and 2, mix2 contains gRNA 3, 4, and 5). For control, the mixture consists of Tyr gRNA. The stain of TnC signal in the VZ at incision site is significantly attenuated in Tnc gRNA mix2 group, compared to the control. The black dashed box indicates higher magnification. Scale bars, 500 μm at low magnification images and 100 μm at high magnification images. (E) Representative immunofluorescent images of TNC (white) and SOX2 (red) combined with DAPI (blue) on cross-cryosections show the loss of TNC expression at the incision site of a 5-day regenerating electroporated telencephalon compared with the control. The white dashed box indicates higher magnification as single channel or merged images. The white dotted line outlines the surface of telencephalon, and the cyan dotted line outlines the VZ surface facing the lumen. Scale bar, 500 μm at low magnification images and 100 μm at high magnification images. VZ: ventricular zone. TnC: Tenascin-C.

References

    1. Savitz SI, Cox CS., Jr. Cell-based therapies for neurological disorders—the bioreactor hypothesis. Nat Rev Neurol. 2023;19(1):9–18. - PubMed
    1. Amamoto R, Huerta VG, Takahashi E, Dai G, Grant AK, Fu Z, Arlotta P. Adult axolotls can regenerate original neuronal diversity in response to brain injury. eLife. 2016;5:e13998. - PMC - PubMed
    1. Maden M, Manwell LA, Ormerod BK. Proliferation zones in the axolotl brain and regeneration of the telencephalon. Neural Dev. 2013;8:1. - PMC - PubMed
    1. Pan XY, Zeng YY, Liu YM, Fei JF. Resolving vertebrate brain evolution through salamander brain development and regeneration. Zool Res. 2023;44(1):219–22. - PMC - PubMed
    1. Berg DA, Kirkham M, Wang H, Frisen J, Simon A. Dopamine controls neurogenesis in the adult salamander midbrain in homeostasis and during regeneration of dopamine neurons. Cell Stem Cell. 2011;8(4):426–33. - PubMed

Publication types

Substances

LinkOut - more resources