Clinical Trial
. 2023 Nov 1;29(21):4361-4372.
doi: 10.1158/1078-0432.CCR-23-0088.

Exercise Training Reduces the Inflammatory Response and Promotes Intestinal Mucosa-Associated Immunity in Lynch Syndrome

Affiliations
Clinical Trial

Exercise Training Reduces the Inflammatory Response and Promotes Intestinal Mucosa-Associated Immunity in Lynch Syndrome

Nan Deng et al. Clin Cancer Res. .

Abstract

Purpose: Lynch syndrome (LS) is a hereditary condition with a high lifetime risk of colorectal and endometrial cancers. Exercise is a non-pharmacologic intervention to reduce cancer risk, though its impact on patients with LS has not been prospectively studied. Here, we evaluated the impact of a 12-month aerobic exercise cycling intervention in the biology of the immune system in LS carriers.

Patients and methods: To address this, we enrolled 21 patients with LS onto a non-randomized, sequential intervention assignation, clinical trial to assess the effect of a 12-month exercise program that included cycling classes 3 times weekly for 45 minutes versus usual care with a one-time exercise counseling session as control. We analyzed the effects of exercise on cardiorespiratory fitness, circulating, and colorectal-tissue biomarkers using metabolomics, gene expression by bulk mRNA sequencing, and spatial transcriptomics by NanoString GeoMx.

Results: We observed a significant increase in oxygen consumption (VO2peak) as a primary outcome of the exercise and a decrease in inflammatory markers (prostaglandin E) in colon and blood as the secondary outcomes in the exercise versus usual care group. Gene expression profiling and spatial transcriptomics on available colon biopsies revealed an increase in the colonic mucosa levels of natural killer and CD8+ T cells in the exercise group that were further confirmed by IHC studies.

Conclusions: Together these data have important implications for cancer interception in LS, and document for the first-time biological effects of exercise in the immune system of a target organ in patients at-risk for cancer.


Figures

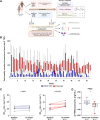
Figure 1. A, Trial schema. Patients with LS were consecutively assigned to a 12-month aerobic exercise intervention involving cycling (n = 11) followed by enrollment of patients to usual care (n = 10). Primary endpoints of the trial were feasibility, evaluated by recruitment in terms of eligibility and consent, adherence, and retention rates; changes in the peak oxygen consumption (VO2 peak); and changes in the PG levels in colorectal mucosa and serum. Additional secondary endpoints included gene expression profiling and metabolomics. Blood, urine, and colorectal mucosa biopsies were collected at baseline and 12-months. The numbers in the box represent the number of participants on whom samples/VO2 levels were collected per group at each time point; B, Total weekly minutes of exercise at heart rate≥70% of PHR represented in bars. Blue bars represent the usual care and red bars represent the exercise group; C, Changes in peak oxygen consumption (VO2 peak) before and after intervention in the usual care (blue) and exercise (red) groups; D, Relative change in PGE2 after twelve months follow-up in the usual care control and exercise groups (Wilcoxon signed-rank test; *, P ≤ 0.05); E, Exercise group. UC, Usual Care group.
Figure 1.
A, Trial schema. Patients with LS were consecutively assigned to a 12-month aerobic exercise intervention involving cycling (n = 11) followed by enrollment of patients to usual care (n = 10). Primary endpoints of the trial were feasibility, evaluated by recruitment in terms of eligibility and consent, adherence, and retention rates; changes in the peak oxygen consumption (VO2 peak); and changes in the PG levels in colorectal mucosa and serum. Additional secondary endpoints included gene expression profiling and metabolomics. Blood, urine, and colorectal mucosa biopsies were collected at baseline and 12-months. The numbers in the box represent the number of participants on whom samples/VO2 levels were collected per group at each time point; B, Total weekly minutes of exercise at heart rate≥70% of PHR represented in bars. Blue bars represent the usual care and red bars represent the exercise group; C, Changes in peak oxygen consumption (VO2 peak) before and after intervention in the usual care (blue) and exercise (red) groups; D, Relative change in PGE2 after twelve months follow-up in the usual care control and exercise groups (Wilcoxon signed-rank test; *, P ≤ 0.05); E, Exercise group. UC, Usual Care group.
Figure 2. A, Overview of the metabolism of arachidonate to PGE2 and 12(s)-HHTrE; B, Changes in PGE2 before and after intervention in the usual care and exercise groups (*, P < 0.05); C, Waterfall plot illustrating fold-change in serum levels of PGE2 and 12(s)-HHTrE in usual care and exercise groups at the end-of-study relative to baseline. P values represent 2-sided paired t tests (*, P < 0.05); D, Heat map depicts the fold-change (end-of-study compared with baseline) for the 12 individual TGs that were statistically significant (2-sided paired t test P < 0.05) in the exercise group but not the usual care group.
Figure 2.
A, Overview of the metabolism of arachidonate to PGE2 and 12(s)-HHTrE; B, Changes in PGE2 before and after intervention in the usual care and exercise groups (*, P < 0.05); C, Waterfall plot illustrating fold-change in serum levels of PGE2 and 12(s)-HHTrE in usual care and exercise groups at the end-of-study relative to baseline. P values represent 2-sided paired t tests (*, P < 0.05); D, Heat map depicts the fold-change (end-of-study compared with baseline) for the 12 individual TGs that were statistically significant (2-sided paired t test P < 0.05) in the exercise group but not the usual care group.
Figure 3. A, Heat map presenting the log fold change in significant genes compared with baseline after 12 months in the usual care and exercise groups; B, Volcano plot of statistically significant genes and fold-changes between the usual care and exercise groups. Top significantly DEGs are labeled; C, Dot plot presents enriched KEGG pathways. The sizes of the dots represent the count of core enrichment (leading-edge) genes. The colors of the dots represent the BH-adjusted P values. The order of KEGG gene sets is based on the gene ratio (number of significant genes associated with the KEGG gene sets/total number of significant genes). Immune-related pathways are bold; D and E, Scatter plot displaying correlations between selected variables. Blue line represents the linear regression line, and the grey band presents the 0.95 CI of the linear model; D, VO2 peak had a positive correlation with the change in activated NK cells (R = 0.57, P = 0.07); E, Change in PGE2 was negatively correlated (R = −0.58; P = 0.08) with the change in CD8+ T-cell population. Pearson correlation coefficient (R) and P value (P) are presented in the upper right corner of each plot.
Figure 3.
A, Heat map presenting the log fold change in significant genes compared with baseline after 12 months in the usual care and exercise groups; B, Volcano plot of statistically significant genes and fold-changes between the usual care and exercise groups. Top significantly DEGs are labeled; C, Dot plot presents enriched KEGG pathways. The sizes of the dots represent the count of core enrichment (leading-edge) genes. The colors of the dots represent the BH-adjusted P values. The order of KEGG gene sets is based on the gene ratio (number of significant genes associated with the KEGG gene sets/total number of significant genes). Immune-related pathways are bold; D and E, Scatter plot displaying correlations between selected variables. Blue line represents the linear regression line, and the grey band presents the 0.95 CI of the linear model; D, VO2 peak had a positive correlation with the change in activated NK cells (R = 0.57, P = 0.07); E, Change in PGE2 was negatively correlated (R = −0.58; P = 0.08) with the change in CD8+ T-cell population. Pearson correlation coefficient (R) and P value (P) are presented in the upper right corner of each plot.
Figure 4. A, Tissue sections of colorectal mucosa specimens were stained with H&E, analyzed using GeoMx DSP and IHC to validate the change of the immune cell types; B, Heat map presents the log fold change of significant genes comparing 12 months to baseline in the usual care (N = 3) and exercise group (N = 5) in the DSP experiment. Significant genes were separated by colors, metallothionein genes in red, ribosomal genes in green, and cancer related genes in blue; C, Changes in deconvoluted immune cell type proportions derived from DSP data are shown after twelve months of follow-up in usual care and exercise groups using CIBERSORT; D, Stromal CD8+ T cell density per mm2 (left) and CD57+ NK cells (right) in colonic mucosa pre- and post-intervention from usual care (n = 4) and exercise (n = 4) participants; E, Exercise through cycling promotes activation of CD8+ T and CD57+ NK cells via modulation of PGs. Upward green arrow indicates activation and downward red arrow shows inhibition.
Figure 4.
A, Tissue sections of colorectal mucosa specimens were stained with H&E, analyzed using GeoMx DSP and IHC to validate the change of the immune cell types; B, Heat map presents the log fold change of significant genes comparing 12 months to baseline in the usual care (N = 3) and exercise group (N = 5) in the DSP experiment. Significant genes were separated by colors, metallothionein genes in red, ribosomal genes in green, and cancer related genes in blue; C, Changes in deconvoluted immune cell type proportions derived from DSP data are shown after twelve months of follow-up in usual care and exercise groups using CIBERSORT; D, Stromal CD8+ T cell density per mm2 (left) and CD57+ NK cells (right) in colonic mucosa pre- and post-intervention from usual care (n = 4) and exercise (n = 4) participants; E, Exercise through cycling promotes activation of CD8+ T and CD57+ NK cells via modulation of PGs. Upward green arrow indicates activation and downward red arrow shows inhibition.

References

    1. Lynch HT, Snyder CL, Shaw TG, Heinen CD, Hitchins MP. Milestones of lynch syndrome: 1895–2015. Nat Rev Cancer 2015;15:181–94. - PubMed
    1. Dominguez-Valentin M, Sampson JR, Seppälä TT, ten Broeke SW, Plazzer J-P, Nakken S, et al. Cancer risks by gene, age, and gender in 6350 carriers of pathogenic mismatch repair variants: findings from the prospective lynch syndrome database. Genet Med 2020;22:15–25. - PMC - PubMed
    1. Wolin KY, Yan Y, Colditz GA, Lee I-M. Physical activity and colon cancer prevention: a meta-analysis. Br J Cancer 2009;100:611. - PMC - PubMed
    1. Lee I-M, Paffenbarger RS Jr, Hsieh C. Physical activity and risk of developing colorectal cancer among college alumni. J Natl Cancer Inst 1991;83:1324–9. - PubMed
    1. Kraemer MB, Priolli DG, Reis IGM, Pelosi AC, Garbuio ALP, Messias LHD. Home-based, supervised, and mixed exercise intervention on functional capacity and quality of life of colorectal cancer patients: a meta-analysis. Sci Rep 2022;12:2471. - PMC - PubMed

Publication types

MeSH terms