. 2023 Nov 6;220(11):e20220681.
doi: 10.1084/jem.20220681. Epub 2023 Sep 19.

Lysosomal cholesterol overload in macrophages promotes liver fibrosis in a mouse model of NASH

Affiliations

Lysosomal cholesterol overload in macrophages promotes liver fibrosis in a mouse model of NASH

Michiko Itoh et al. J Exp Med. .

Abstract

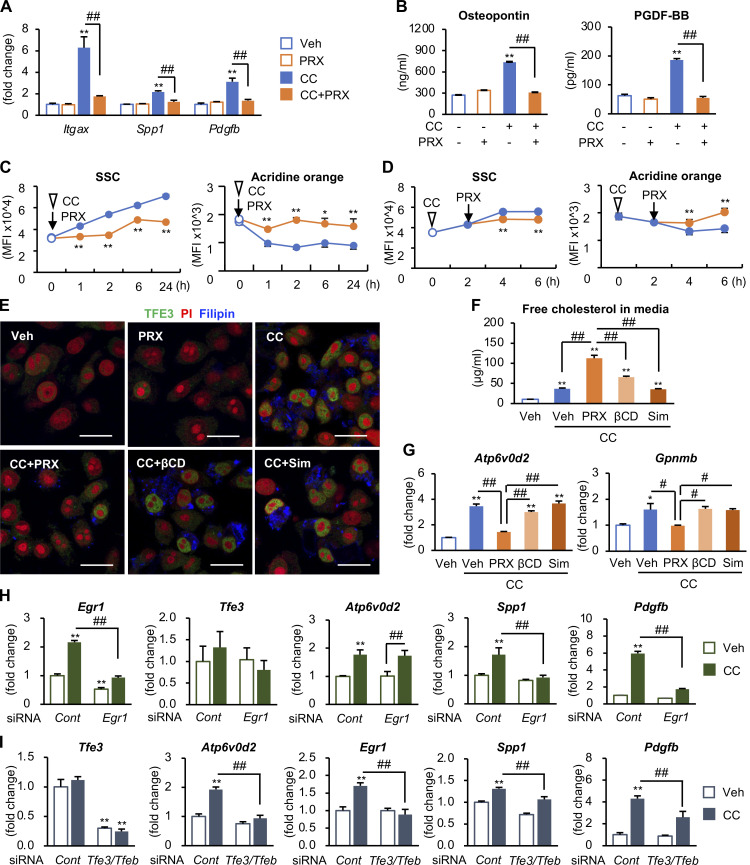
Accumulation of lipotoxic lipids, such as free cholesterol, induces hepatocyte death and subsequent inflammation and fibrosis in the pathogenesis of nonalcoholic steatohepatitis (NASH). However, the underlying mechanisms remain unclear. We have previously reported that hepatocyte death locally induces phenotypic changes in the macrophages surrounding the corpse and remnant lipids, thereby promoting liver fibrosis in a murine model of NASH. Here, we demonstrated that lysosomal cholesterol overload triggers lysosomal dysfunction and profibrotic activation of macrophages during the development of NASH. β-cyclodextrin polyrotaxane (βCD-PRX), a unique supramolecule, is designed to elicit free cholesterol from lysosomes. Treatment with βCD-PRX ameliorated cholesterol accumulation and profibrotic activation of macrophages surrounding dead hepatocytes with cholesterol crystals, thereby suppressing liver fibrosis in a NASH model, without affecting the hepatic cholesterol levels. In vitro experiments revealed that cholesterol-induced lysosomal stress triggered profibrotic activation in macrophages predisposed to the steatotic microenvironment. This study provides evidence that dysregulated cholesterol metabolism in macrophages would be a novel mechanism of NASH.


Conflict of interest statement

Disclosures: M. Itoh reported grants from the Ministry of Education, Culture, Sports, Science and Technology of Japan, MSD Life Science Foundation, the Kurata Grants by the Hitachi Global Foundation, Uehara Memorial Foundation for Life Sciences, and Takeda Science Foundation outside the submitted work. M. Tanaka reported grants from Grants-in-Aid for Scientific Research from the 996 ministry of Education, Culture, Sports, Science and Technology of Japan (21K08526) and the Japan Agency for Medical 998 Research and Development (22fk0210094h0002) outside the submitted work. Y. Murata reported grants from the Japan Society for the Promotion of Science outside the submitted work. T. Matozaki reported grants from a Grant-in-Aid for Scientific Research (A) from Japan Society for the Promotion of Science and P-PROMOTE of the Japan Agency for Medical Research and Development outside the submitted work. Y. Kataoka reported non-financial support from JEOL Ltd. outside the submitted work. T. Suganami reported grants from the Ministry of Education, Culture, Sports, Science, and Technology of Japan, Japan Agency for Medical Research and Development, SEI Group CSR Foundation, Smoking Research Foundation, Ono Medical Research Foundation, Kobayashi Foundation, Uehara Memorial Foundation for Life Sciences, Suzuken Memorial Foundation, and KOSÉ Cosmetology Research Foundation outside the submitted work; in addition, T. Suganami received a donation department from Seaknit Biotechnology Co. Ltd., which does not have any conflict of interests related to this work. No other disclosures were reported.

Figures

Figure S1.
Figure S1.
Relationship between CLS number and clinical parameters in NAFLD/NASH subjects. (A) Correlation of the CAP value measured by FibroScan, which represents hepatic lipid content, and histological scores of the livers (NAS and fibrosis stage). (B) Correlation of the LSM value measured by FibroScan and histological fibrosis stage. (C) Correlation of CLS number and NAS, fibrosis stage, CAP, and LSM values. Error bars represent means ± SEM.
Figure 1.
Figure 1.
Cholesterol crystallization and lysosomal stress in CLS-constituting macrophages in NASH livers. (A–C) Electron micrographs of NASH livers from MC4R-KO mice fed a WD for 20 wk (MC/WD) and WT mice kept on an SD (WT/SD). (A) Fine cholesterol crystals were observed in lipid droplets of hepatocytes (insets). Asterisks, CLS. Scale bar, 10 μm. (B) Cholesterol crystallization in the remnant lipids of dead hepatocyte surrounded by macrophages (left), and lipid accumulation in CLS-constituting macrophages (right). Scale bars, 10 μm. (C) Macrophages in sinusoids of normal liver (left) and CLS-constituting macrophage (right). N, nucleus; LD, lipid droplets; RL, remnant lipid of dead hepatocyte; arrowheads, lysosomes; white arrows, autolysosomes. Scale bars, 5 μm. (D) Representative image of polarized light microscope of the liver from MC4R-KO mice transplanted with bone marrow cells from GFP-transgenic mice and fed a WD for 20 wk. Scale bar, 10 μm. (E) Total cholesterol content of macrophages isolated from normal (WT/SD) and NASH livers (MC/WD). Gating strategies for F4/80hi CD11blo macrophages (Mφ): CD45+ Ly6G SiglecF F4/80hi CD11blo; F4/80lo CD11bhi Mφ: CD45+ Ly6G SiglecF F4/80lo CD11bhi. F4/80hi CD11blo macrophages were separated based on the expression levels of CD11c. n = 4. **P < 0.01; n.s., not significant. (F) Serial sections of the livers from WT mice fed an SD and MC4R-KO mice fed a WD stained with F4/80 and CTSD antibodies. Arrows, CLS; C, central veins; P, portal veins. Scale bars, 50 μm. (G) Serial sections of the livers from NASH patients stained with CD68, CD11c, and CTSD. Arrows, CLS. Scale bars, 50 μm. Data and images are representative of two independent experiments (A–F). Error bars represent means ± SEM.
Figure 2.
Figure 2.
Optimization of chemical modification for βCD-PRXs. (A) Schematic illustration showing the mechanism of action of βCD-PRX. (B) Structure of chemically modified βCD-PRXs. Me, methyl; Ac, acetyl; MEEE, 2-(2-(2-methoxyethoxy)ethoxy)ethyl carbamate; CM, carboxymethyl carbamate; and SPAE, 2-(N-3-sulfopropyl-N,N-dimethylammonium)ethyl carbamate. (C) Cholesterol binding capacity evaluated by the solubility of cholesterol in the presence of each βCD-PRX and HP-βCD (βCD) under neutral and acidic pH conditions. Open bar, pH 7.4; solid bar, pH 5.0. n = 3. **P < 0.01, n.s.; not significant. (D) Cytotoxicity of chemically modified βCD-PRXs and βCD in RAW264 macrophages. n = 5. (E) Representative images of hematoxylin and eosin staining of the livers from WT mice treated with chemically modified βCD-PRXs at a dose of 200 mg/kg for 24 h. (F and G) Hepatic mRNA expression of inflammatory genes (F) and tissue distribution evaluated by fluorescence intensities (G) in WT mice 24 h after subcutaneous injection of Cy5.5-labeled βCD-PRXs at a dose of 200 mg/kg. Emr1, EGF-like module-containing mucin-like hormone receptor-like 1 (F4/80); TNF, tumor necrosis factor-α. n = 5. *P < 0.05, **P < 0.01 versus PBS. Data and images are representative of two independent experiments. Error bars represent means ± SEM.
Figure 3.
Figure 3.
Biodistribution of βCD-PRX in the liver. (A) Cellular uptake of BODIPY-modified HEE-βCD-PRX at various dosages in WT mice. (B) Tissue distribution of HEE-βCD-PRX evaluated by fluorescence intensities in MC4R-KO mice fed a WD for 20 wk. n = 3. (C) Comparison of HEE-βCD-PRX distribution at a dose of 200 mg/kg in WT mice fed an SD (WT/SD) and MC4R-KO mice fed a WD for 20 wk (MC/WD). n = 3. *P < 0.05, **P < 0.01 versus WT/SD. Data are representative of two independent experiments. Error bars represent means ± SEM. MFI, mean fluorescence intensity.
Figure 4.
Figure 4.
Effect of βCD-PRX on liver fibrosis in a mouse model of NASH. (A) Experimental protocol of βCD-PRX treatment in a NASH model using MC4R-KO mice. After the development of NASH with 18-wk WD feeding, MC4R-KO mice were received implantation of osmotic minipumps at a dose of 30 mg/kg/d of βCD-PRX or normal saline as a control (Cont) for an additional 6 wk. PRX, βCD-PRX. WT/SD-cont, n = 6; MC/WD-cont, n = 9; MC/WD-PRX, n = 8. (B) Body weight and liver weight after βCD-PRX treatment. (C) Hepatic TG and total cholesterol (TC) content. (D) Area of cholesterol crystals in the liver evaluated by polarized light microscope. (E) Free and esterified cholesterol content of F4/80hi CD11blo macrophages isolated from the livers at the end of the experiment. Open bars, CD11c-negative macrophages; closed bars, CD11c-positive macrophages. (F) Hepatic mRNA expression of genes related to lipid metabolism, inflammation, and fibrogenesis. Nr1h3, nuclear receptor subfamily 1 group H member 3 (LXRα); Nr1h2, nuclear receptor subfamily 1 group H member 2 (LXRβ); Srebf, sterol regulatory element binding transcription factor; Ppara, peroxisomal proliferator-activated receptor α; Abca1, ATP binding cassette subfamily A member 1; Agcg1, ATP biding cassette subfamily G member 1; Ldlr, low density lipoprotein receptor; Msr1, macrophage scavenger receptor 1; Hmgcr, hydroxymethylglutaryl-CoA reductase; Hmgcs, hydroxymethylglutaryl-CoA synthase; G6pase, glucose 6-phosphatase; Pfk, 6-phosphofructokinase; Acox, peroxisomal acyl-coenzyme A oxidase 1; Cpt1a; carnitine palmitoyltransferase 1A; Mttp, microsomal triglyceride transfer protein; Fasn, fatty acid synthase; Acc1, acetyl-CoA carboxylase 1; Itgax, integrin subunit αX (CD11c); IL1β, interleukin-1β; Ccl2, C-C motif chemokine ligand 2; Tgfβ1, transforming growth factor β1; Pdgfb, platelet-derived growth factor subunit B; Spp1, secreted phosphoprotein 1; Timp1, tissue inhibitor of metalloproteinase 1; Col1a1, collagen type I α chain; and Col4a1, collagen type IV α chain. (G and H) Fibrosis area evaluated by Sirius red staining (G) and quantification of desmin-positive area (H). C, central veins. Scale bars, 50 μm. *P < 0.05, **P < 0.01 versus WT/SD-Cont; #P < 0.05, ##P < 0.01. Data and images are representative of two independent experiments. Error bars represent means ± SEM.
Figure S2.
Figure S2.
Effect of βCD-PRX on cholesterol accumulation in hepatocytes. (A) Free and esterified cholesterol content of the livers from WT mice and MC4R-KO mice fed a WD for 24 wk. Cont, control. WT/SD-Cont, n = 6; MC/WD-Cont, n = 9; MC/WD-PRX, n = 8. **P < 0.01 versus WT/SD-Cont. (B) mRNA expression of genes related to cholesterol metabolism in hepatocytes isolated from WT mice fed an SD and MC4R-KO mice fed a WD for 4 wk, and treated with βCD-PRX for the last 1 wk. n = 5. *P < 0.05, **P < 0.01 versus WT/SD-Cont. (C) Free and esterified cholesterol content of primary hepatocytes treated with βCD-PRX for 24 h. Primary hepatocytes were isolated from WT mice fed an SD and MC4R-KO mice fed a WD for 10 d, and treated with βCD-PRX for 24 h n = 3. **P < 0.01 versus WT/SD-Veh; ##P < 0.01. Data are representative of two (A and B) or three (C) independent experiments. Error bars represent means ± SEM.
Figure 5.
Figure 5.
Effect of βCD-PRX on inflammatory and profibrotic phenotypes of CLS-constituting macrophages in NASH. Immunohistochemistry of the livers of MC4R-KO mice treated with βCD-PRX for 6 wk. (A) F4/80 immunostaining and quantification of CLS number. C, central veins. Scale bars, 50 μm. WT/SD-Cont, n = 6; MC/WD-Cont, n = 9; MC/WD-PRX, n = 8. (B) Immunofluorescence staining of TFE3, F4/80, and CD11c, and quantification of the rates of TFE3 nuclear translocation and CD11c-positive CLS. Nuclei were counterstained with DAPI. Scale bars, 50 μm. MC/WD-Cont, n = 9; MC/WD-PRX, n = 8. **P < 0.01 versus MC/WD-Cont. (C) Representative images of Clec4f and Tim4 immunostaining of the livers from WT and MC4R-KO mice. Arrows, CLS. Scale bars, 50 μm. (D) mRNA expression levels of genes related to NASH-specific macrophage phenotypes, including Itgax, Atp6v0d2, Spp1, and Pdgfb in F4/80hi CD11blo macrophages sorted from livers of MC4R-KO mice after 6-wk βCD-PRX treatment. n = 3. (E) Representative images of serial sections stained with anti-F4/80 and Osteopontin antibodies. Scale bars, 50 μm. WT/SD-Cont, n = 6; MC/WD-Cont, n = 9; MC/WD-PRX, n = 8. **P < 0.01 versus WT/SD-Cont. #P < 0.05, ##P < 0.05. Data and images are representative of two independent experiments. Error bars represent means ± SEM.
Figure S3.
Figure S3.
Effect of βCD-PRX on liver fibrosis in a mouse model of NASH with high-fat and HC diet. (A) Experimental protocol of βCD-PRX treatment in a NASH model with an HC diet for 20 wk. βCD-PRX was subcutaneously administered by osmotic minipumps at a dose of 30 mg/kg/d of βCD-PRX or normal saline as a control (Cont) for the last 6 wk. PRX, βCD-PRX. SD-Cont, n = 6; HC-Cont, n = 7; HC-PRX, n = 7. (B) Body weight and liver weight after βCD-PRX treatment. (C) Immunofluorescence staining of TFE3 and F4/80. Scale bars, 50 μm. (D) Fibrosis area evaluated by type III collagen immunostaining. C, central veins. Scale bars, 50 μm. (E) Hepatic mRNA expression of genes related to inflammation, fibrogenesis, and lipid metabolism. *P < 0.05, **P < 0.01 versus SD-cont; #P < 0.05, ##P < 0.01. Error bars represent means ± SEM.
Figure 6.
Figure 6.
Effect of cholesterol crystals and βCD-PRX on gene expression profiles in macrophages isolated from normal and steatotic livers. (A) Experimental protocol using primary hepatic macrophages. Hepatic macrophages were isolated using magnetic columns from normal livers (WT mice fed an SD) and steatotic livers (MC4R-KO mice fed a WD for 6–10 wk), and were stimulated with cholesterol crystals (CC, 500 μg/ml) and βCD-PRX (1 mM) for 24 h. (B) Representative images of immunostaining of macrophages from normal livers and steatotic livers treated with CC and βCD-PRX for 24 h. Fixed cells were stained with LAMP1 (a lysosome marker, green), filipin (free cholesterol, red), and PI (propidium iodide, nuclei, blue). Scale bars, 20 μm. (C and D) Immunostaining of Galectin 3 (a marker of lysosomal membrane damage, green), LAMP1 (red), and DAPI (blue; C) and TFE3 (green), Filipin (blue), and PI (red; D) in hepatic macrophages. Scale bars, 20 μm. Images are representative of two independent experiments. (E) RNA-seq was conducted using hepatic macrophages isolated from normal livers and steatotic livers (n = 2). Gene ontology analysis of the genes twofold upregulated in hepatic macrophages isolated from steatotic livers compared with those from normal livers using Metascape. (F) Venn diagram showing the twofold upregulated genes in CC-treated macrophages compared to each Veh. (G) Unsupervised hierarchical clustering analysis using RNA-seq data (k = 5). Genes belonging to each cluster are indicated on the right.
Figure 7.
Figure 7.
Differential response to cholesterol crystal (CC)–induced lysosomal stress in macrophages isolated from normal and steatotic livers. (A) mRNA expression levels analyzed by quantitative real-time PCR in hepatic macrophages. Gpnmb, glycoprotein nonmetastatic melanoma protein B; Vegfa, vascular endothelial growth factor A); Kcnn4, potassium calcium–activated channel, subfamily N, member 4. (B) Top five upstream transcription regulators specific for CC-treated macrophages from steatotic livers analyzed by ingenuity pathway analysis. (C) Egr1 expression in hepatic macrophages. n = 4. *P < 0.05, **P < 0.01 versus each Veh; ##P < 0.01. (D) Immunostaining of Egr1 (red) in hepatic macrophages (Mφ). Scale bars, 20 μm. Data and images are representative of two independent experiments.
Figure 8.
Figure 8.
Effect of βCD-PRX on lysosomal dysfunction and profibrotic changes in RAW264 macrophages. (A) mRNA expression of genes related to NASH-specific macrophage phenotypes after incubation with cholesterol crystal (CC) and βCD-PRX for 24 h. **P < 0.01 versus Veh; ##P < 0.01. (B) Osteopontin and PDGF-BB secretion from RAW264 macrophages in response to CC and βCD-PRX. (C and D) Evaluation of lysosomal function using acridine orange in RAW264 macrophages. Side scatter (SSC) intensity represents uptake of CCs, and fluorescence of acridine orange was detected by PerCP channel. βCD-PRX was added at the same time with CC (C) or 2 h after CC treatment (D). Blue line, CC; orange line, CC + βCD-PRX. n = 4. *P < 0.05, **P < 0.01 versus CC at each timing. (E) Immunocytochemistry of RAW264 macrophages treated with CC in the presence of βCD-PRX (1 mM), HP-βCD (unthreaded in linear polymer; βCD, 1 mM), and Simvastatin (Sim, 1 μM) for 24 h. TFE3 (green), Filipin (blue), and PI (red). (F and G) Free cholesterol concentrations in the culture media (F) and mRNA expression of genes related to lysosomal stress in RAW264 treated with CC and βCD-PRX, βCD, and Sim (G). n = 4. *P < 0.05, **P < 0.01 versus Veh; #P < 0.05, ##P < 0.01. (H) The effect of Egr1 knockdown on expression of Spp1 and Pdgfb. Macrophages were transfected with siRNA targeting Egr1 and negative control, and treated with CC for 6 h. (I) Role of TFE3 and TFEB transcription factors in CC-induced Egr1 expression in RAW264 macrophages. Macrophages were transfected with siRNA targeting Tfe3/Tfeb and negative control, and treated with CC for 6 h n = 4. **P < 0.01 versus Cont-Veh; ##P < 0.01. Data and images are representative of three (A–G) or two (H and I) independent experiments. Error bars represent means ± SEM.
Figure S4.
Figure S4.
Effect of cholesterol crystals (CCs) on lysosomal stress functions in RAW264 macrophages. (A) RAW264 macrophages treated with CC and βCD-PRX for 24 h were subjected to RNA-seq analysis (n = 4). Heatmap showing fold changes of the genes extracted by an unsupervised hierarchical clustering of hepatic macrophages shown in Fig. 6 G compared with vehicle-treated RAW264 macrophages. (B and C) Representative images of immunostaining of RAW264 macrophages treated with CC and βCD-PRX. (B) LAMP2 (a lysosome marker, green), filipin (free cholesterol, red), and PI (nuclei, blue). (C) Galectin 3 (green), LAMP1 (red), and DAPI (blue). Scale bars, 20 μm. (D) mRNA expression levels of genes related to inflammatory cytokines and chemokines. n = 4. *P < 0.05, **P < 0.01 versus Veh; #P < 0.05, ##P < 0.01. (E) Western blot analysis of LC-3 and p62 protein levels. n = 4. **P < 0.01 versus Veh; ##P < 0.01. (F) Images of RAW264 macrophages transiently expressing mRFP-GFP-LC3 treated with CC and βCD-PRX for 24 h and GFP-positive ratio of mRFP-positive puncta. **P < 0.01 versus CC. (G) mRNA expression levels of genes related to endoplasmic reticulum stress. n = 4. **P <0.01 versus Veh; #P < 0.05, ##P < 0.01. (H) Oxygen consumption rate (OCR) of RAW264 macrophages treated with CC and βCD-PRX for 18 h. n = 2. FCCP, carbonyl cyanide 4-(trifluoromethoxy)phenylhydrazone; R/A, rotenone/antimycin A. (I) Effect of HP-βCD (βCD) and βCD-PRX on the levels of lipid raft integrity evaluated by FACS analysis using cholera toxin subunit B, a marker for lipid rafts. n = 3–4. **P < 0.01 versus Veh. Data and images are representative of two (B, C, F, H, and I) or three (D, E, and G) independent experiments. Error bars represent means ± SEM. Source data are available for this figure: SourceData FS4.
Figure S5.
Figure S5.
Molecular mechanism of action of βCD-PRX. (A and B) Effect of βCD-PRX on TNFα (20 μg/ml, 24 h; A) and L-leucyl-L-leucine methyl ester (LLOMe, 1 mM, 3 h), an artificial lysosomal membrane damage reagent (B). n = 4. **P < 0.01 versus Veh; #P < 0.05, ##P < 0.01. (C and D) Representative images of Egr1 immunostaining (C) and mRNA expression of Egr1 (D) in RAW264 macrophages treated with cholesterol crystals (CCs) and βCD-PRX for 24 h n = 4. **P < 0.01 versus Veh; ##P < 0.01. (E) mRNA expression in RAW264 macrophages treated with CC for 6 h under knockdown of Tfe3 and Tfeb. n = 4. **P < 0.01 versus Cont-Veh. Data and images are representative of three (A) or two (B–E) independent experiments. Error bars represent means ± SEM. (F) Potential role of free cholesterol overload in profibrotic transformation of hepatic macrophages interacting with dead hepatocytes. During the course of NASH development, macrophages aggregate around dead hepatocytes with CCs in the lipid droplets, and macrophages engulf the corpses of hepatocytes and remnant lipids. In the microenvironment of steatotic livers, macrophages undergo profibrotic activation at least partly through TFE3/TFEB-Egr1 axis. βCD-PRX excretes free cholesterol from lysosomes and reverses the phenotypic changes of macrophages. Created with BioRender.
Figure 9.
Figure 9.
Phagocytosis of dead cells induces lysosomal dysfunction and profibrotic changes in macrophages. (A) Experimental protocol for macrophage phagocytosis of dead cells. Hepa1-6 cells were incubated with the inclusion complex of cholesterol with randomly methylated βCD (50 μM) and oleic acid (500 μM) for 48 h. Unstimulated (indicated as normal) and lipid-loaded Hepa1-6 cells were stained with pHrodo, which emits fluorescence in an acidic environment in lysosomes, and induced necrotic cell death by freeze and thaw. RAW264 macrophages were incubated with dead Hepa1-6 cells for the indicated time. (B) Clearance rate was evaluated by the number of dead cells in the media at the indicated time. Orange, normal Veh; pale orange, normal PRX; blue, lipid-loaded Veh; pale blue, lipid-loaded PRX. n = 4. (C) Macrophages were incubated with dead cells with or without βCD-PRX for 6 h and pHrodo-positive and -negative macrophages were subjected to measurement of free cholesterol content. n = 3–4. *P < 0.05, **P < 0.01. (D) Immunostaining of TFE3 (green) in RAW264 macrophages after supplementation of dead cells and βCD-PRX. hr, hour. (E) Time course of TFE3 nuclear translocation. (F and G) Immunostaining of TFE3 (green), Osteopontin (red; F), and Egr1 (red; G) in RAW264 macrophages. Scale bars, 20 μm. Data and images are representative of two independent experiments. Error bars represent means ± SEM.

References

    1. Boland, M.L., Oró D., Tølbøl K.S., Thrane S.T., Nielsen J.C., Cohen T.S., Tabor D.E., Fernandes F., Tovchigrechko A., Veidal S.S., et al. . 2019. Towards a standard diet-induced and biopsy-confirmed mouse model of non-alcoholic steatohepatitis: Impact of dietary fat source. World J. Gastroenterol. 25:4904–4920. 10.3748/wjg.v25.i33.4904 - DOI - PMC - PubMed
    1. Caballero, F., Fernández A., De Lacy A.M., Fernández-Checa J.C., Caballería J., and García-Ruiz C.. 2009. Enhanced free cholesterol, SREBP-2 and StAR expression in human NASH. J. Hepatol. 50:789–796. 10.1016/j.jhep.2008.12.016 - DOI - PubMed
    1. Chen, S., Zhou Y., Chen Y., and Gu J.. 2018. fastp: An ultra-fast all-in-one FASTQ preprocessor. Bioinformatics. 34:i884–i890. 10.1093/bioinformatics/bty560 - DOI - PMC - PubMed
    1. Eddowes, P.J., Sasso M., Allison M., Tsochatzis E., Anstee Q.M., Sheridan D., Guha I.N., Cobbold J.F., Deeks J.J., Paradis V., et al. . 2019. Accuracy of FibroScan controlled attenuation parameter and liver stiffness measurement in assessing steatosis and fibrosis in patients with nonalcoholic fatty liver disease. Gastroenterology. 156:1717–1730. 10.1053/j.gastro.2019.01.042 - DOI - PubMed
    1. Emanuel, R., Sergin I., Bhattacharya S., Turner J., Epelman S., Settembre C., Diwan A., Ballabio A., and Razani B.. 2014. Induction of lysosomal biogenesis in atherosclerotic macrophages can rescue lipid-induced lysosomal dysfunction and downstream sequelae. Arterioscler. Thromb. Vasc. Biol. 34:1942–1952. 10.1161/ATVBAHA.114.303342 - DOI - PMC - PubMed

Publication types