. 2023 Nov 15;133(22):e162148.
doi: 10.1172/JCI162148.

Tumor-derived biomarkers predict efficacy of B7H3 antibody-drug conjugate treatment in metastatic prostate cancer models

Affiliations

Tumor-derived biomarkers predict efficacy of B7H3 antibody-drug conjugate treatment in metastatic prostate cancer models

Supreet Agarwal et al. J Clin Invest. .

Abstract

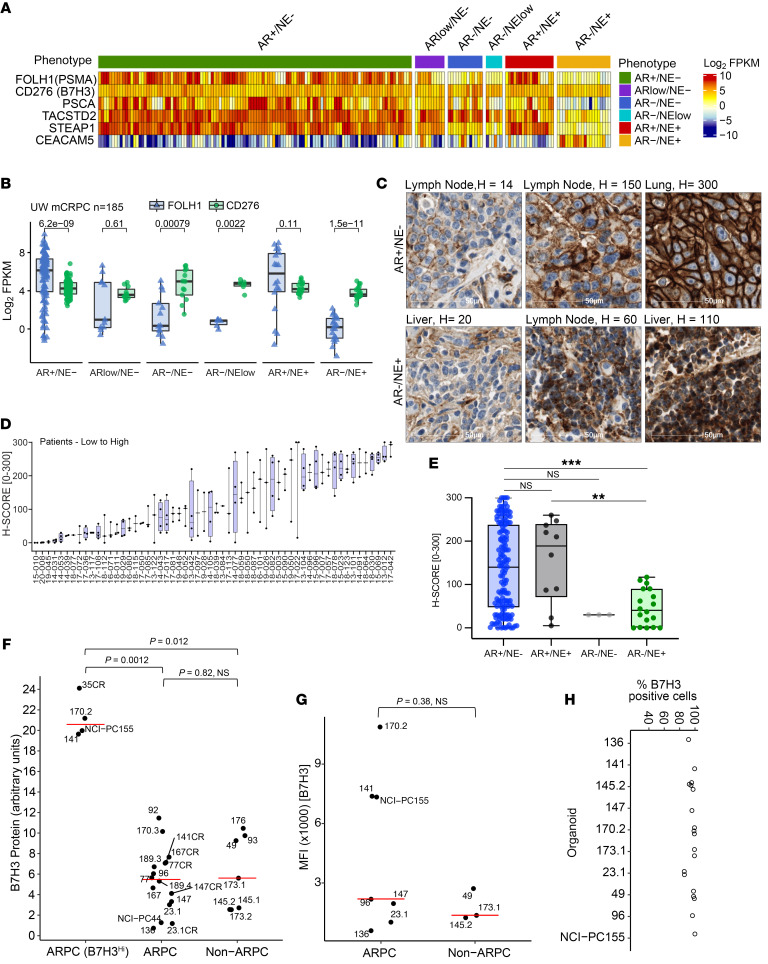
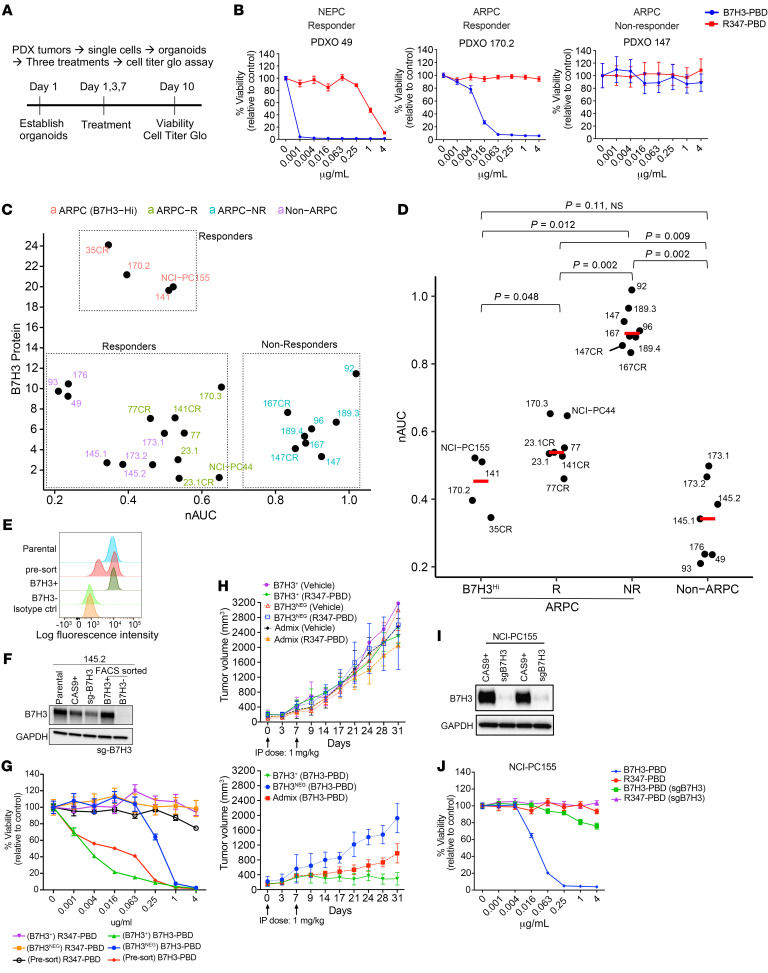
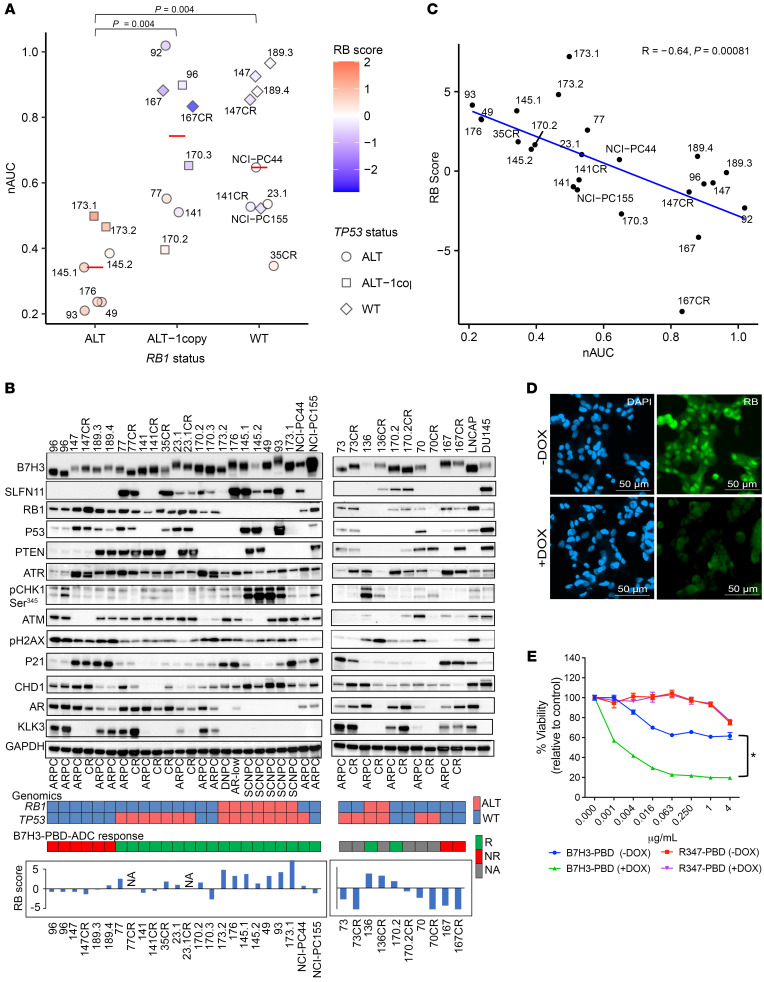
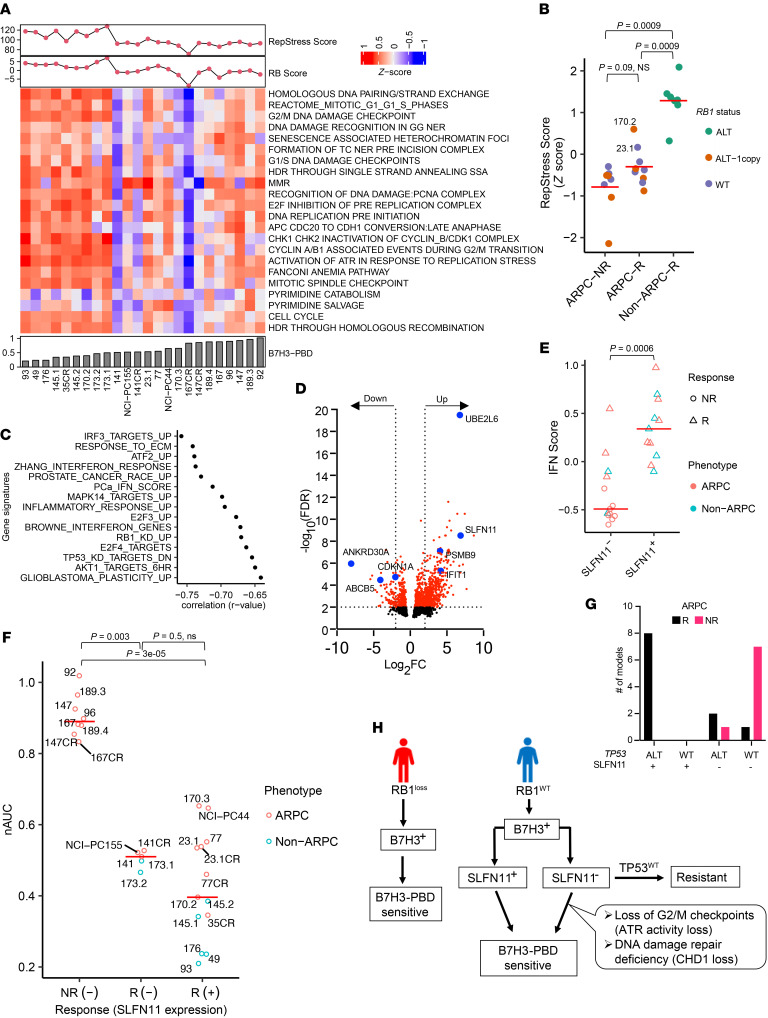
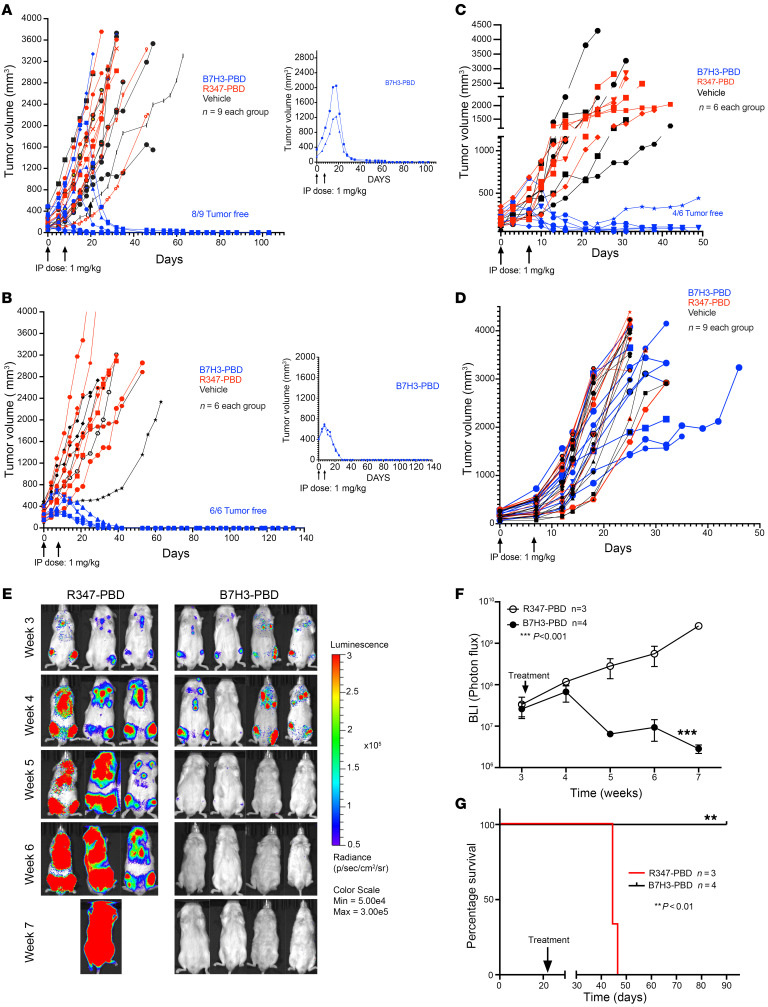
Antibody-drug conjugates (ADCs) are a promising targeted cancer therapy; however, patient selection based solely on target antigen expression without consideration for cytotoxic payload vulnerabilities has plateaued clinical benefits. Biomarkers to capture patients who might benefit from specific ADCs have not been systematically determined for any cancer. We present a comprehensive therapeutic and biomarker analysis of a B7H3-ADC with pyrrolobenzodiazepine(PBD) payload in 26 treatment-resistant, metastatic prostate cancer (mPC) models. B7H3 is a tumor-specific surface protein widely expressed in mPC, and PBD is a DNA cross-linking agent. B7H3 expression was necessary but not sufficient for B7H3-PBD-ADC responsiveness. RB1 deficiency and/or replication stress, characteristics of poor prognosis, and conferred sensitivity were associated with complete tumor regression in both neuroendocrine (NEPC) and androgen receptor positive (ARPC) prostate cancer models, even with low B7H3 levels. Non-ARPC models, which are currently lacking efficacious treatment, demonstrated the highest replication stress and were most sensitive to treatment. In RB1 WT ARPC tumors, SLFN11 expression or select DNA repair mutations in SLFN11 nonexpressors governed response. Importantly, WT TP53 predicted nonresponsiveness (7 of 8 models). Overall, biomarker-focused selection of models led to high efficacy of in vivo treatment. These data enable a paradigm shift to biomarker-driven trial designs for maximizing clinical benefit of ADC therapies.

Keywords: Cell Biology; Drug therapy; Prostate cancer; Therapeutics.


Conflict of interest statement

Conflict of interest: PSN has served as a paid advisor to Janssen, Bristol Myers Squibb, and Pfizer and received research funding from Janssen for work unrelated to the present study. EC received research funding under institutional SRA from the following companies for work unrelated to the present study: Arvinas, Janssen Research and Development, Bayer Pharmaceuticals, KronosBio, Forma Pharmaceutics, Foghorn, MacroGenics, AstraZeneca, Gilead, Sanofi, AbbVie, and GSK. EMH, AM, and CH are employees and stockholders of AstraZeneca.

Figures

Figure 1
Figure 1. CD276/B7H3 expression in samples from patients with mPC and mPC PDX/organoid models.
(A) CD276/B7H3, FOLH1/PSMA, PSCA, TACSTD2/TROP2, STEAP1, and CEACAM5 transcript abundance determined by RNA-Seq analysis of 185 metastatic prostate tumors from 98 patients. Transcript levels are shown as Log2 FPKM. (B) Comparisons of CD276/B7H3 (green dots) and FOLH1/PSMA (blue dots) expression by phenotypes of metastatic tumors. Groups were compared using 2-sided Wilcoxon rank tests with Benjamini-Hochberg multiple-testing correction. (C) IHC assessments of B7H3 protein expression. Representative staining of tumors with low, medium, and high B7H3 expression in AR+/NE and AR/NE+ phenotypes. (D) Distribution of B7H3 protein expression in 181 metastatic tumors within and between 58 patients. (E) Distribution of B7H3 protein expression in mPCs categorized by phenotype (AR+/NE; n = 146, AR+/NE+; n = 10, AR/NE; n = 3, AR/NE+; n = 18, Cases not evaluated n = 4), **P ≤ 0.01, ***P ≤ 0.001. Wilcoxon test. (F) Western blot quantification of B7H3 protein expression in PDX tissue samples and 2 PDOs (NCI-PC44, NCI-PC155) by Simple Western. ARPC samples with high B7H3 expression are categorized separately in the B7H3HI group. Y-axis represents CD276/B7H3 protein quantification scaled by a factor of 10. For pairwise comparison between groups, Wilcoxon test was used with P value adjusted using the Holm method. P < 0.05 was considered significant. (G and H) Flow cytometry analysis for B7H3 cell–surface expression from organoids dissociated into single cells. P < 0.05; significant, Wilcoxon test. (G) Median Fluorescence Intensity (MFI) and (H) Percentage positive cells are shown for 9 analyzed models.
Figure 2
Figure 2. B7H3-PBD-ADC activity requires, but is not correlated with, B7H3 protein levels.
(A) Schematic of the ex vivo drug assay. (B) Representative drug response curves for B7H3-PBD-ADC and R347-PBD-ADC (control ADC) in PDX-derived organoids (PDXOs) of SCNPC and ARPC phenotypes. Percentage viability was plotted relative to the control. (C) Comparison of B7H3-PBD-ADC response and B7H3 protein expression across the models; n = 26. (D) nAUC values for B7H3-PBD-ADC in ARPC (n = 19) and non-ARPC models (n = 7). ARPC models are categorized into 3 groups: high B7H3 expressors (B7H3HI) n = 4, responder (R) n = 7, and nonresponder (NR) n = 8. Red line indicates median nAUC for the groups. Wilcoxon test was used for pairwise comparison between groups with P value adjusted using the Holm method. P < 0.05 was considered significant. (E) FACS sorting strategy for selecting B7H3-KO 145.2 cells. (F) Western blot for FACS sorted 145.2 B7H3+ and B7H3 (B7H3 KO) cells grown as organoids. (G) Dose response curves for 145.2 presorted and sorted B7H3NEG and B7H3+ organoids treated with ADC for 10 days. (H) 145.2 B7H3+, B7H3NEG, and admix (mix of B7H3+ and B7H3NEG cells in approximately equal proportion) ODXs treated with ADCs or vehicle, once weekly for 2 weeks, as indicated by arrows; n = 8/group, except B7H3NEG (2 mice with necrotic tumors at Day 14 excluded from B7H3-PBD group), B7H3NEG and admix (Vehicle group; n = 2 each), B7H3+ (Vehicle group; n = 4), Admix (B7H3-PBD and R347-PBD; n = 5 each). Average tumor volume is plotted from the day of first treatment indicated as Day 0. Top panel comparing average tumor volumes for R347-PBD and vehicle treated mice. Bottom panel comparing average tumor volumes for B7H3-PBD treated B7H3+, B7H3NEG, and admix xenografts. Wilcoxon test, *P < 0.05. (I) Western blot for B7H3 knockdown in NCI-PC155 organoids. (J) Dose response curves for NCI-PC155 organoids after B7H3 knockdown (sgB7H3 group). Error bars indicate the SEM.
Figure 3
Figure 3. RB1 loss predicts B7H3-PBD-ADC response.
(A) B7H3-PBD-ADC response categorized by RB1 genomic status. Red line indicates the median nAUC for each group. TP53 genotypes are shown as different shapes. Color indicates RB1 signature score on z-transformed scale. Wilcoxon test with P value adjusted using the Holm method, P < 0.05 was considered significant. (B) Immunoblot analysis of organoid models and prostate cancer cell lines for the indicated markers. Heatmap (bottom) showing RB1 and TP53 genomic status and B7H3-PBD-ADC response. For RB1, red color indicates biallelic copy loss and blue indicates WT or single copy loss. TP53 status in red refers to alterations by biallelic inactivation or gain of function mutation and in blue indicates WT or monoallelic loss. For B7H3-PBD-ADC response; R, responsive; NR, nonresponse; NA, data not available. Bar plots for RB1 score is shown for the organoid models. (C) Correlation of B7H3-PBD-ADC response (nAUC) and RB1 signature score. Pearson’s correlation coefficient r = –0.64, P = 0.00081. (D) IF images confirming DOX-inducible knockdown of RB1 in LuCaP167 organoid model. (E) B7H3-PBD-ADC dose response curves in LuCaP167 (RB1+) organoid model expressing DOX-inducible RB1 shRNA. Error bars indicate the SEM. *P < 0.05, Wilcoxon test.
Figure 4
Figure 4. Contributing biomarker subclasses of B7H3-PBD-ADC sensitivity.
(A) Heatmap of the pathways contributing to the RepStress signature score. Organoid models are ranked from left to right based on increasing B7H3-PBD nAUC (bottom panel). Top panel showing RepStress and RB signature scores. (B) Comparison of z-transformed RepStress score in AD nonresponders (ARPC-NR), ARPC responders (ARPC-R), and non-ARPC responders (NonARPC-R). Color indicates RB1 genotype. (C) Univariate correlation analyses between nAUC and MsigDB gene signatures, including refined IFN signature score for prostate cancer labeled as PCa_IFN_Score. Spearman correlation coefficient is shown for top significant gene sets. FDR ≤ 0.05, Benjamini and Hochberg method for multiple hypothesis test correction. (D) Volcano plot for differentially expressed genes between B7H3-PBD-ADC–responsive ARPC models versus nonresponsive ARPC models. Dotted lines are shown for log2 fold change of –2 and 2 at FDR ≤ 0.01. (E) Comparison of IFN score with SLFN11 expression. (F) B7H3-PBD-ADC response categorized by SLFN11 expression. Red line indicates median nAUC for each group. NR, nonresponder; R, responder; +/- indicates SLFN11 expression. P<0.05; significant, Wilcoxon test. (G) Distribution of ARPC models based on TP53 genomic status and SLFN11 expression. (H) Schematic of proposed biomarker based therapeutic decisions for B7H3-PBD-ADC treatment of patients with mPC. For multiple group comparisons in panel B and F, P values were determined by Wilcoxon test and adjusted using the Holm method.
Figure 5
Figure 5. Prostate cancer organoid-derived biomarkers predict in vivo tumor responses in preclinical trials of the B7H3-PBD-ADC.
(AD) Tumor response to B7H3-PBD-ADC (1 mg/kg), R347-PBD-ADC (1 mg/kg) or vehicle in the 4 selected LuCaP models based on identified biomarkers (A) LuCaP 145.2 (SCNPC phenotype; RB1loss, SLFN11+, IFN scoreHi), n = 9 / group. (B) LuCaP 136 (ARPC phenotype; RB1loss, SLFN11, IFN scorelo), n = 6/ group. (C) LuCaP 77 (ARPC, RB1+, SLFN11+, IFN scoremedium) n = 6 /group. (D) LuCaP 167 (ARPC, RB1+, SLFN11, IFN scorelo) n = 9 /group. Right panels for A and B display antitumor activity of B7H3-PBD-ADC in mice with large established tumors (145.2; > 1,000 mm3 and 136; > 650 mm3). Tumor volume measurements (mm3) are shown from the time of first treatment. Arrows indicate once weekly dose for 2 weeks. (E) BLI of LuCaP 136 metastases following treatment with B7H3-PBD-ADC (n = 4) or R347-PBD-ADC (n = 3). Mice were treated once weekly for 2 weeks. (F) Average BLI for treated mice from the time of first treatment. Means ± SD, 2-way ANOVA test; P < 0.001. (G) Kaplan-Meier survival analysis for the B7H3-PBD-ADC and R347-PBD-ADC treated LuCaP 136 metastases. Log-rank test (P < 0.01).

References

    1. Siegel RL, et al. Cancer statistics, 2020. CA Cancer J Clin. 2020;70(1):7–30. doi: 10.3322/caac.21590. - DOI - PubMed
    1. Labrecque MP, et al. Molecular profiling stratifies diverse phenotypes of treatment-refractory metastatic castration-resistant prostate cancer. J Clin Invest. 2019;129(10):4492–4505. doi: 10.1172/JCI128212. - DOI - PMC - PubMed
    1. Abida W, et al. Genomic correlates of clinical outcome in advanced prostate cancer. Proc Natl Acad Sci U S A. 2019;166(23):11428–11436. doi: 10.1073/pnas.1902651116. - DOI - PMC - PubMed
    1. Sartor O, et al. Lutetium-177-PSMA-617 for metastatic castration-resistant prostate cancer. N Engl J Med. 2021;385(12):1091–1103. doi: 10.1056/NEJMoa2107322. - DOI - PMC - PubMed
    1. Flem-Karlsen K, et al. B7-H3 in cancer - beyond immune regulation. Trends Cancer. 2018;4(6):401–404. doi: 10.1016/j.trecan.2018.03.010. - DOI - PubMed

Publication types