. 2023 Sep 26;42(9):113145.
doi: 10.1016/j.celrep.2023.113145. Epub 2023 Sep 19.

Unannotated microprotein EMBOW regulates the interactome and chromatin and mitotic functions of WDR5

Affiliations

Unannotated microprotein EMBOW regulates the interactome and chromatin and mitotic functions of WDR5

Yanran Chen et al. Cell Rep. .

Abstract

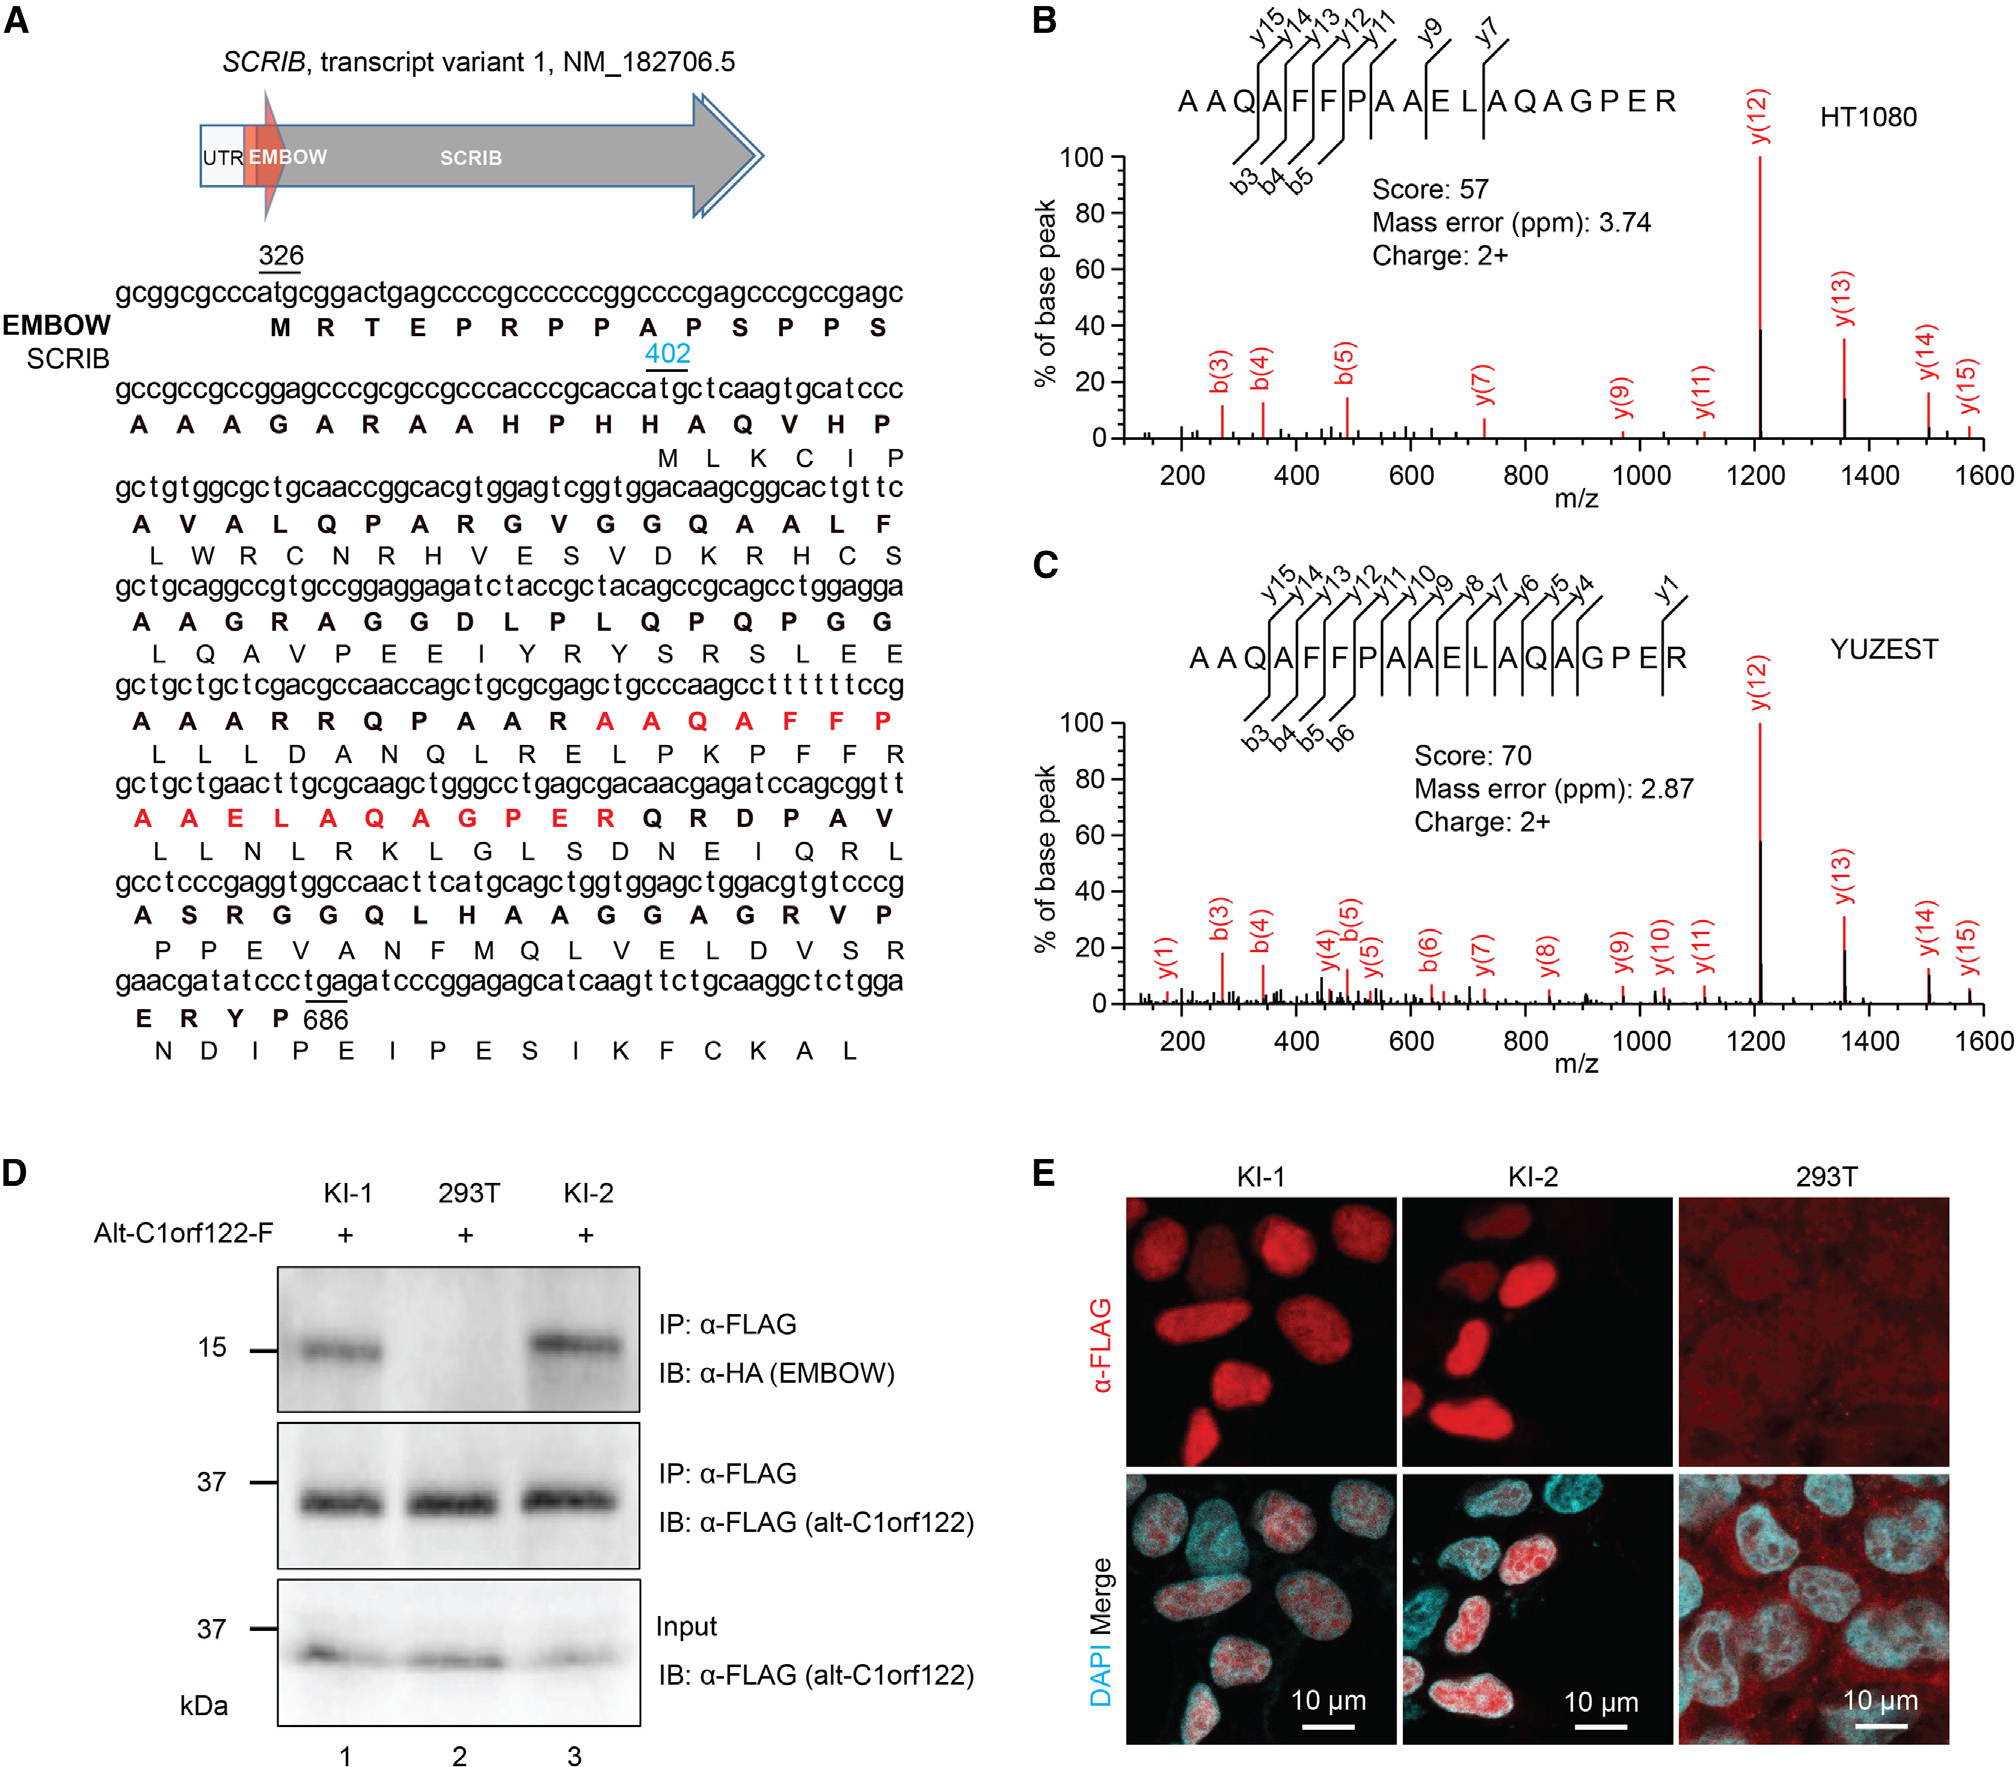
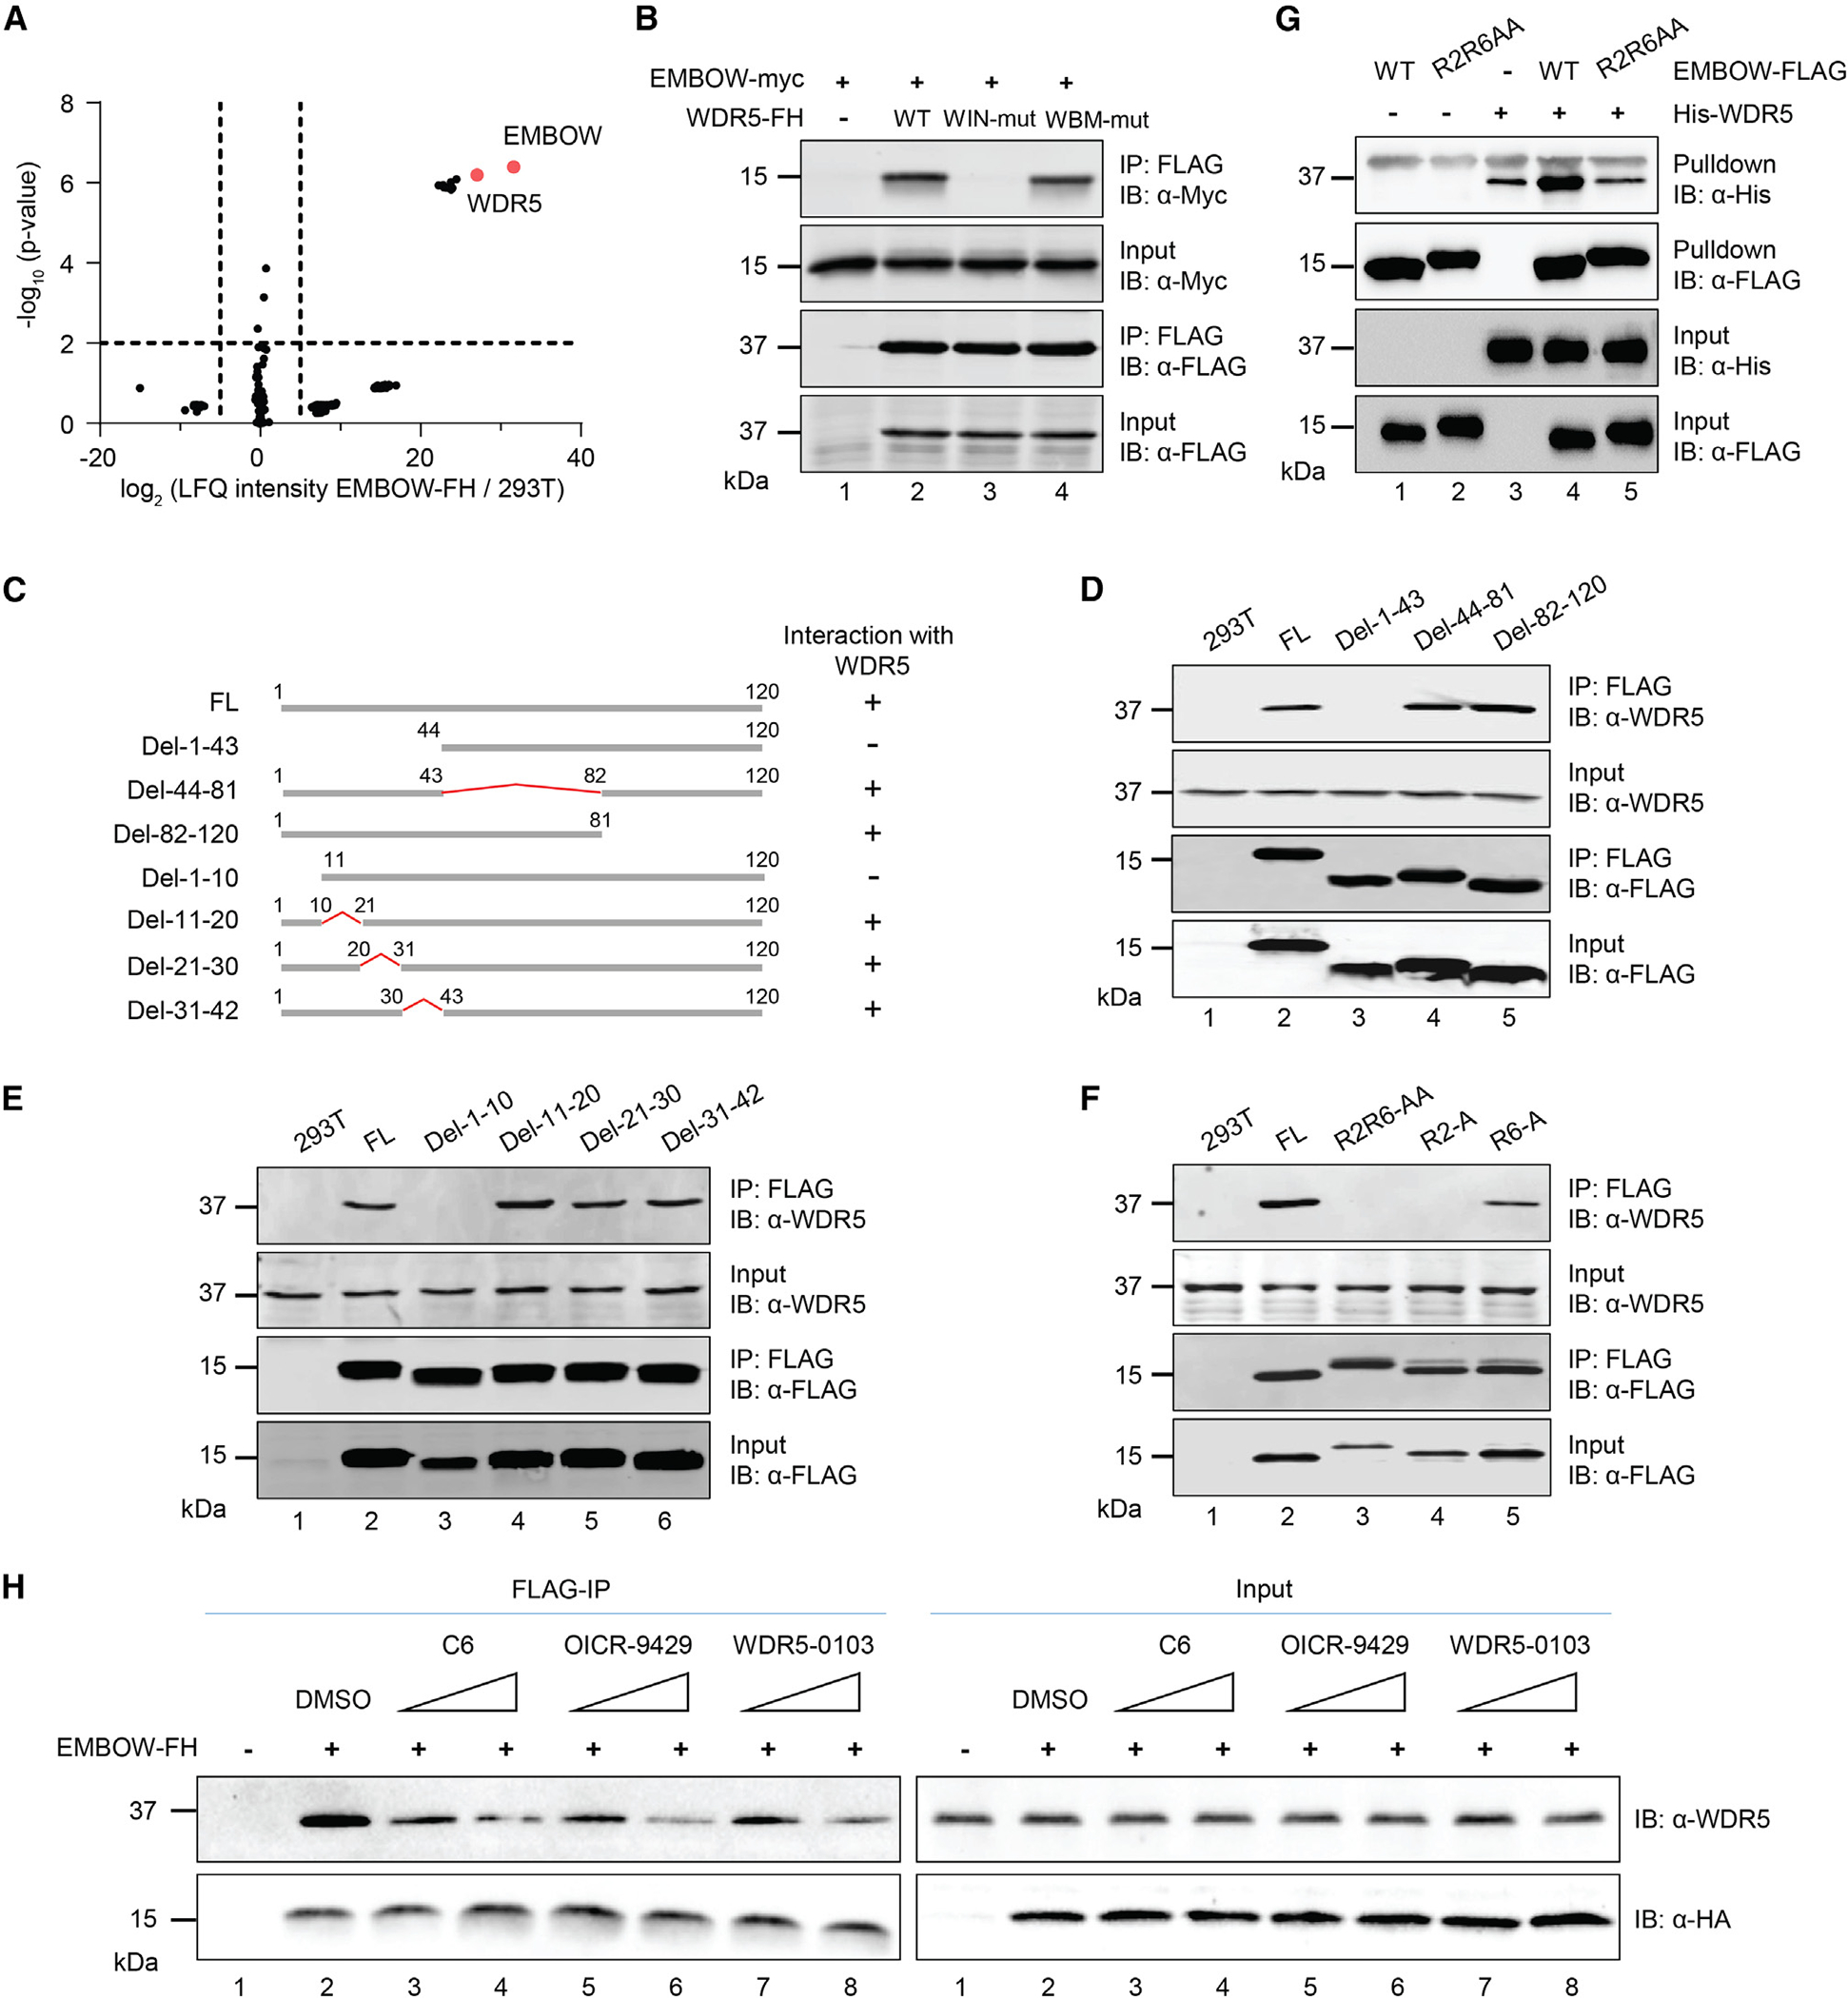
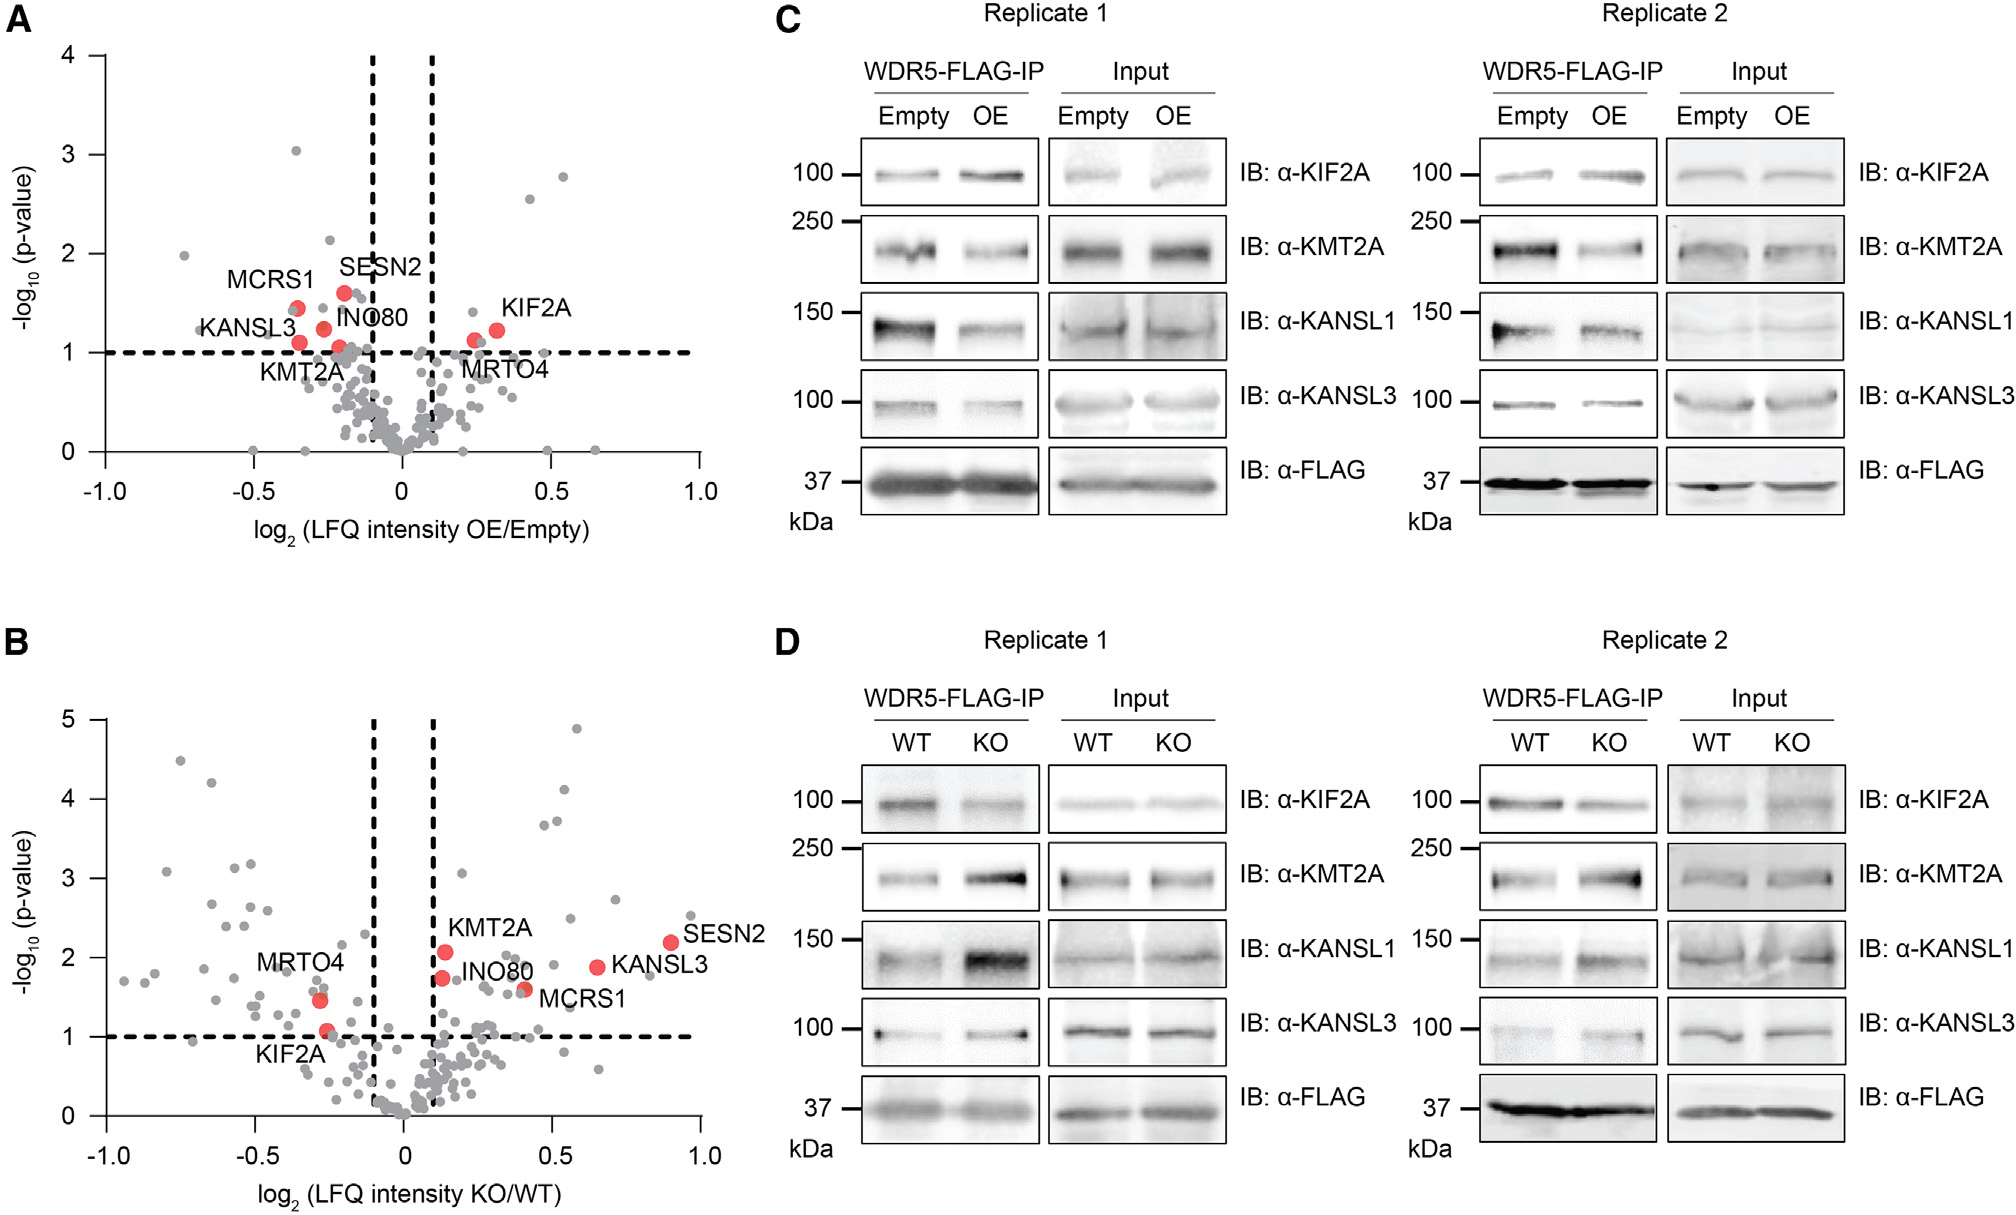
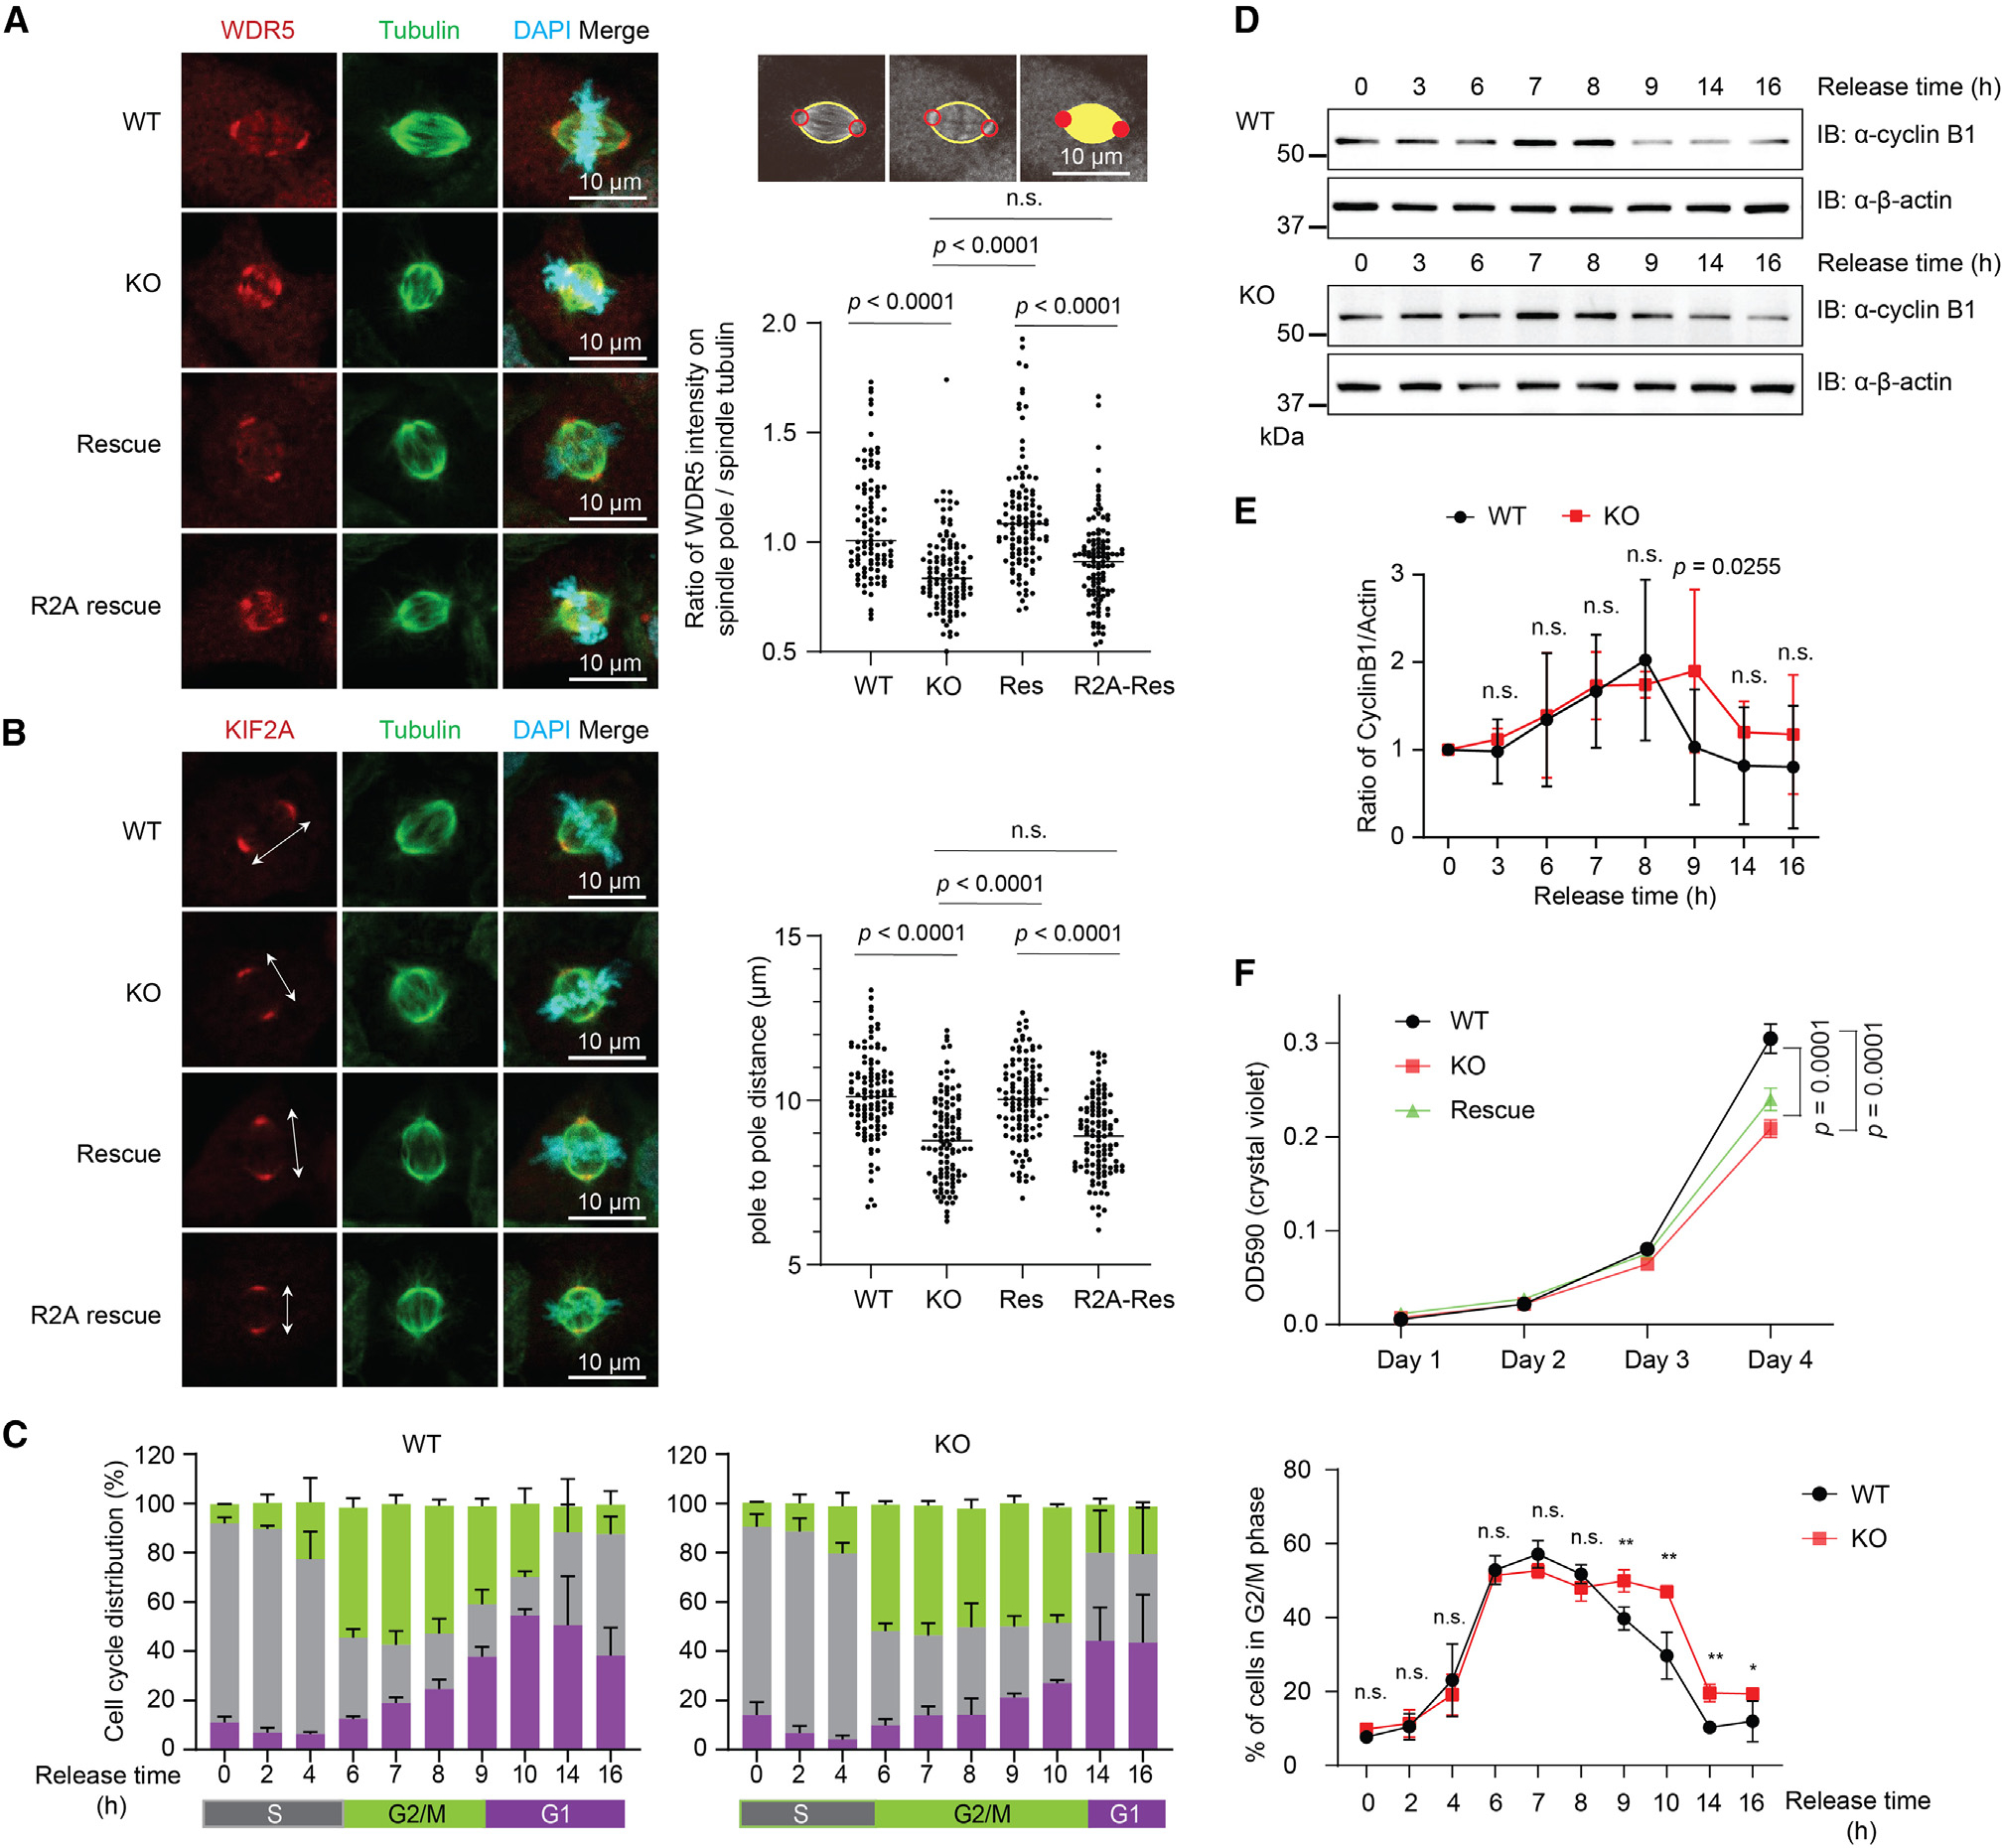
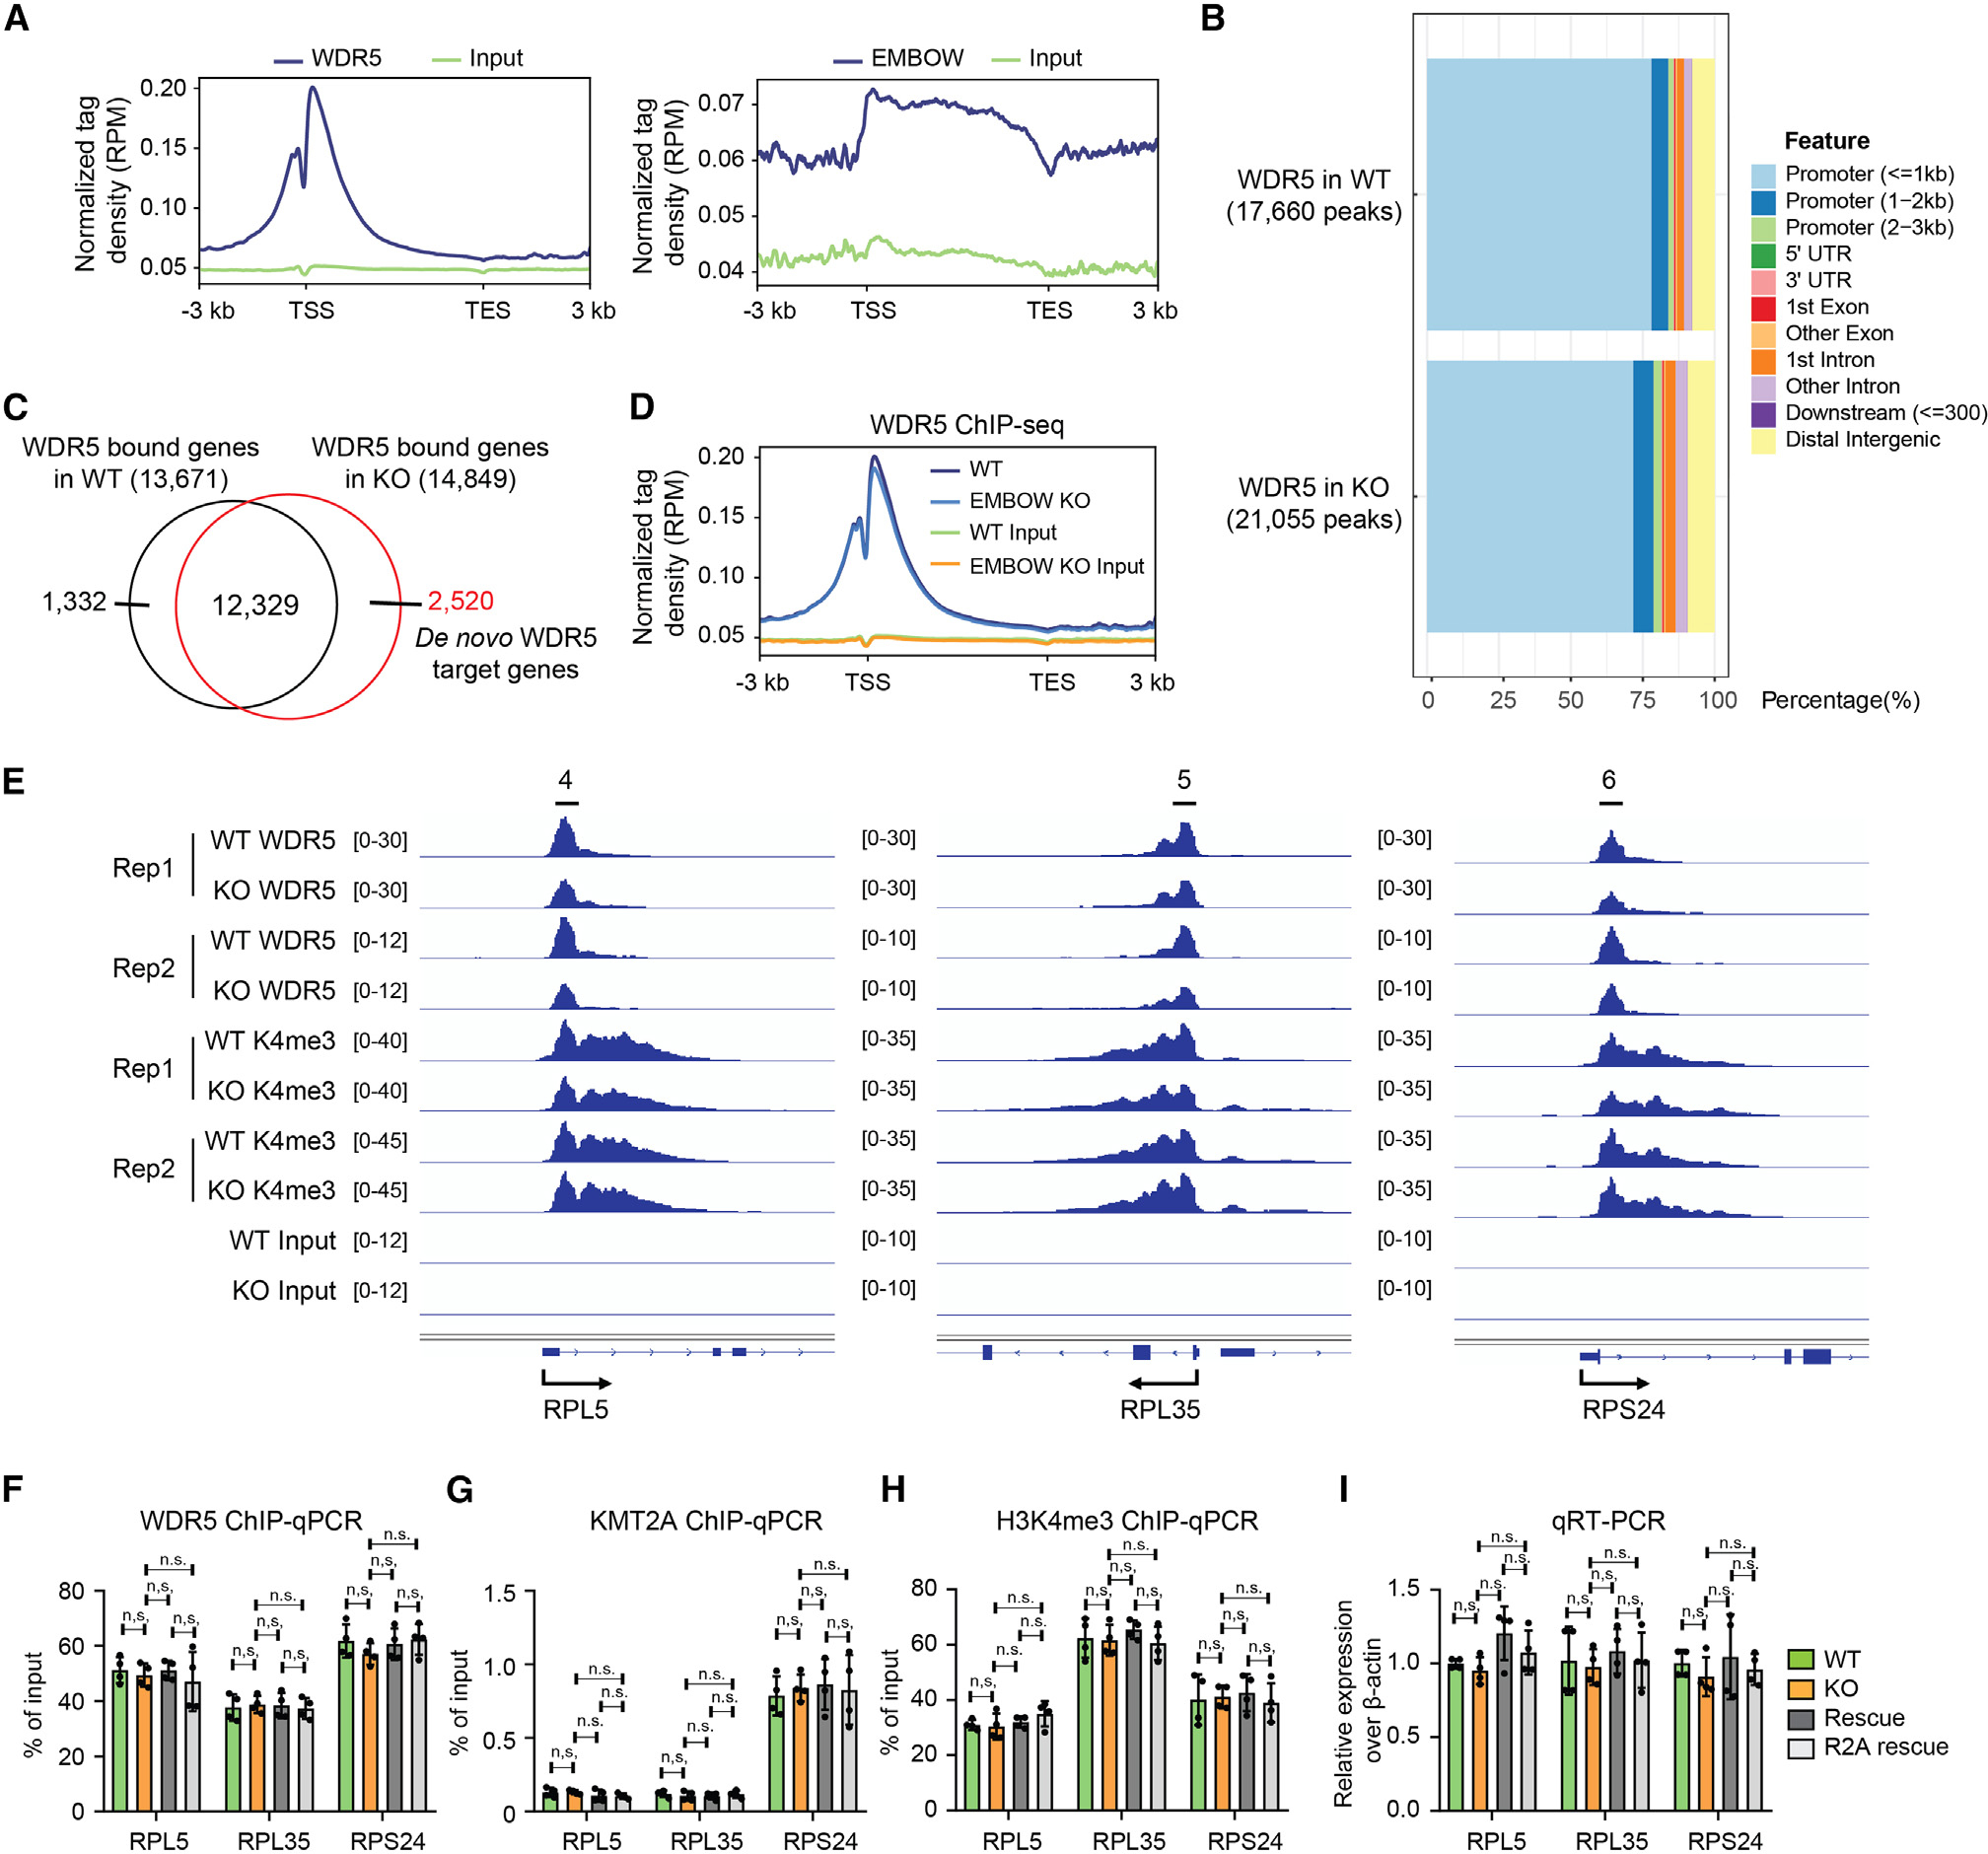
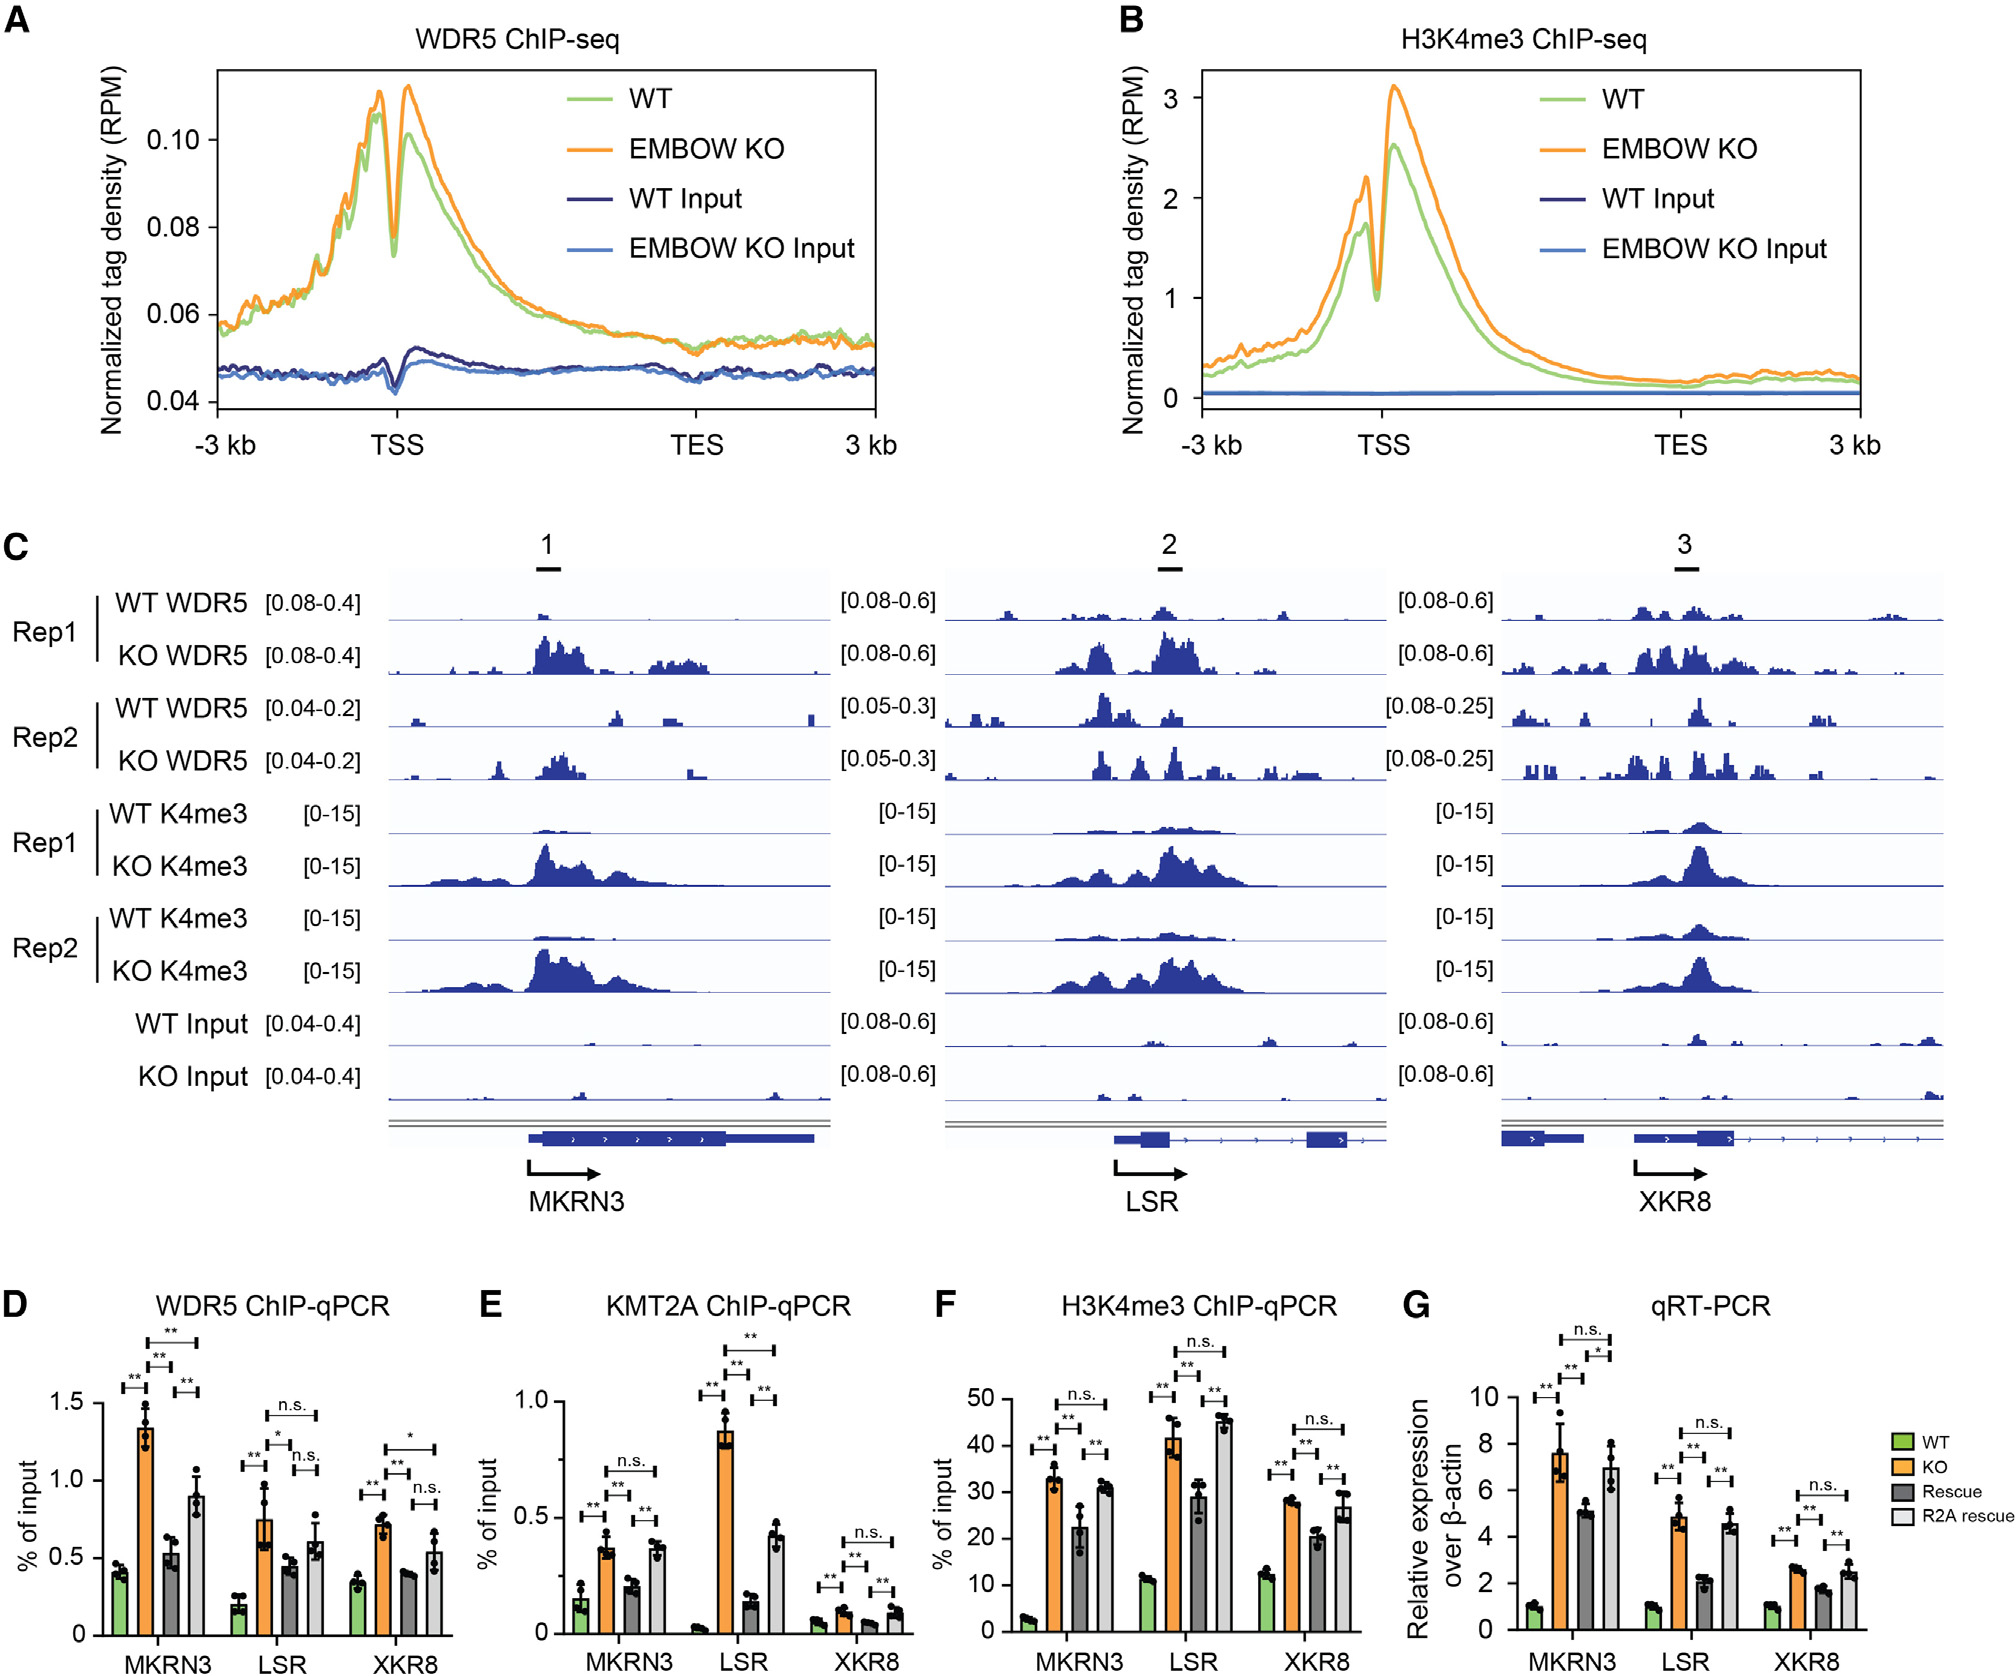
The conserved WD40-repeat protein WDR5 interacts with multiple proteins both inside and outside the nucleus. However, it is currently unclear whether and how the distribution of WDR5 between complexes is regulated. Here, we show that an unannotated microprotein EMBOW (endogenous microprotein binder of WDR5) dually encoded in the human SCRIB gene interacts with WDR5 and regulates its binding to multiple interaction partners, including KMT2A and KIF2A. EMBOW is cell cycle regulated, with two expression maxima at late G1 phase and G2/M phase. Loss of EMBOW decreases WDR5 interaction with KIF2A, aberrantly shortens mitotic spindle length, prolongs G2/M phase, and delays cell proliferation. In contrast, loss of EMBOW increases WDR5 interaction with KMT2A, leading to WDR5 binding to off-target genes, erroneously increasing H3K4me3 levels, and activating transcription of these genes. Together, these results implicate EMBOW as a regulator of WDR5 that regulates its interactions and prevents its off-target binding in multiple contexts.

Keywords: CP: Cell biology; CP: Molecular biology; WDR5; histone H3K4me3; microprotein; mitosis; transcription.


Conflict of interest statement

Declaration of interests The authors declare no competing interests.

Figures

Figure 1.
Figure 1.. SCRIB dually encodes an unannotated nuclear microprotein
(A) Top: schematic representation of human SCRIB tv1: light gray arrow, 5′ and 3′ UTR; dark gray arrow, SCRIB coding sequence; red arrow, smORF encoding EMBOW. Bottom: the cDNA sequence of human SCRIB tv1 is shown with the protein sequences of EMBOW (bold) and SCRIB indicated below. The start codons of EMBOW (black) and SCRIB (blue) and the stop codon of EMBOW (black) are numbered. Highlighted in red is the tryptic peptide of EMBOW detected by liquid chromatography-tandem mass spectrometry (LC-MS/MS). (B and C) MS/MS spectra of EMBOW tryptic peptide detected in HT1080 and primary cultured melanoma cells (YUZEST). Mascot score, precursor mass error and precursor charge state are presented. (D) Control (293T) or EMBOW-FLAG-HA knockin (KI) HEK293T cells were transiently transfected with a plasmid encoding alt-C1orf122-FLAG, serving as an FLAG-IP positive control, and IPs were performed followed by immunoblotting (IB). Cell lysates (4%) before IP (input) were used as the loading controls. Data are representative of three biological replicates. (E) Immunostaining of two independent EMBOW-FLAG-HA KI cell lines (KI-1 and KI-2) and HEK293T cells (293T) as a negative control with anti-FLAG (red) and DAPI (cyan). Scale bars, 10 μm. Data are representative of three biological replicates. See also Figure S1.
Figure 2.
Figure 2.. EMBOW directly interacts with WDR5 via the WIN site
(A) Volcano plot of quantitative proteomics (N = 3 biologically independent experiments) of anti-FLAG pull-down from nuclear lysates of HEK293T cells transiently overexpressing EMBOW-FLAG-HA (EMBOW-FH) or parental (293T) HEK293T. Two-sample p value was calculated using Perseus. For complete quantitative proteomics results, see Table S4. (B) HEK293T cells were transfected with EMBOW-myc only, or co-transfected with EMBOW-myc and wild-type (WT), or WIN site mutated (WIN-mut), or WBM site mutated WDR5-FH (WBM-mut), followed by IP and IB. Data are representative of three biological replicates. (C) Schematic representation of full-length (FL) and deletion (del) mutant EMBOW constructs, with amino acid residues numbered above. WDR5 association status of each construct is indicated on the right. (D–F) HEK293T cells were transfected with EMBOW full-length (FL) or mutants (listed at top), followed by IP and IB. Data are representative of three biological replicates. (G) His-WDR5, wild-type (WT), or R2R6-to-AA mutated (R2R6AA) EMBOW-FLAG were purified from E. coli, followed by in vitro FLAG pull-down and IB. A nonspecific upper band appears in the anti-His IB channel. Data are representative of three biological replicates. (H) HEK293T cells were transfected with EMBOW-FH or mock transfection, and FLAG-IP was performed in the absence (DMSO) or presence of WDR5 WIN-site inhibitors C6 (0.5 or 5 μM), OICR-9429 (0.5 or 5 μM), or WDR5-0103 (5 or 50 μM), followed by IB. Data are representative of three biological replicates. LFQ, label-free quantitation. See also Tables S1 and S4.
Figure 3.
Figure 3.. EMBOW regulates the WIN-site interactome of WDR5
(A and B) HEK293T cells stably expressing WDR5-FLAG were transfected with EMBOW-myc (OE) or empty vector (Empty) (A), or WDR5-FLAG was stably expressed in parental (WT) or EMBOW knockout (KO) HEK293T cells (B), followed by FLAG-IP and quantitative proteomics with LFQ analysis (N = 3 biologically independent experiments). Two-sample p value was calculated using Perseus. WDR5-interacting proteins showing statistically significant (defined as −log10 (p value) ≥ 1) changes in opposite directions upon overexpression or KO of EMBOW are indicated in red, and protein names are labeled. The WDR5-interacting proteins are defined as those proteins enriched by WDR5 in HEK293T cells stably expressing WDR5-FLAG over parental HEK293T cells with log2 (fold change) ≥ 5 and −log10 (p value) ≥ 1. For complete quantitative proteomics results, see Tables S5, S6, and S7. (C and D) WDR5-FLAG IP and immunoblotting using the four experimental samples described above. Cell lysates (4%) before IP (input) were used as loading controls. Shown are two biological replicates. See also Figures S2 and S3 and Tables S2, S5, S6, and S7.
Figure 4.
Figure 4.. Loss of EMBOW decreases WDR5 on the spindle pole, shortens spindle length, prolongs G2/M phase, and delays cell proliferation
(A and B) Left: immunostaining of wild-type (WT), EMBOW KO, rescue with wild-type (rescue) or R2A-mutated (R2A rescue) EMBOW HEK293T cells with anti-WDR5 (A, red) or anti-KIF2A (B, red), anti-Tubulin (green), and DAPI (cyan). Data are representative of three biological replicates. Right: schematic representation of method to calculate the ratio of WDR5 signal colocalizing with the spindle pole and spindle tubulin are shown at the top, and quantitation of the ratio of WDR5 intensities on spindle pole and spindle tubulin in the four cell lines are shown at the bottom (A), or quantitation of the pole-to-pole distances of the four cell lines (B), totaling >100 cells for each measurement. Data represent mean values ± SEM, and significance (p value) was evaluated by one-way ANOVA (Dunnett’s test). Scale bars, 10 μm. (C) Left: quantitation of the cell cycle of synchronized WT and EMBOW KO cells released from the G1/S boundary; release time points are indicated at the bottom. Right: percentage of WT (black) and EMBOW KO (red) cells in G2/M phase were plotted, release time points are indicated at the bottom. N = 3 biologically independent experiments. Data represent mean values ± SEM, and significance (p value) was evaluated by one-way ANOVA (Dunnett’s test). **p < 0.01. (D and E) Synchronized WT and EMBOW KO cells were released from the G1/S boundary and collected at the indicated time points, followed with immunoblotting (D). Quantification of cyclin B1 protein changes are shown in (E). Data represent mean values ± SEM; N = 5 biologically independent experiments, and significance (p value) was evaluated by one-way ANOVA (Dunnett’s test). (F) Growth curve of WT, EMBOW KO, and rescue cells at the indicated number of days (N = 4 biologically independent experiments). Data represent mean values ± SEM; significance (p value) was evaluated via two-way ANOVA (Dunnett’s test). n.s., not significant; OD590, optical density at 590 nm. See also Figures S3 and S4.
Figure 5.
Figure 5.. Loss of EMBOW does not change WDR5 or H3K4me3 levels at WDR5 on-target genes
(A) Profile of WDR5 (left) and EMBOW (right) ChIP-seq signal at all UCSC (The University of California, Santa Cruz) annotated genes in HEK293T cells. (B) The genomic distribution of WDR5 ChIP-seq peaks in wild-type (top) or EMBOW KO (bottom) cells. (C) Venn diagram of WDR5-bound genes in WT or EMBOW KO cells. The WDR5-bound genes are defined as those genes with a WDR5 peak within ±1-kb distance of the gene’s transcription start site (TSS) with a 3-kb flanking distance. (D) Profile of WDR5 binding on WDR5 on-target genes in WT and EMBOW KO cells. (E–I) WDR5 binding and H3K4me3 levels at three WDR5 target ribosomal genes upon EMBOW KO, shown by ChIP-seq snapshots (E), and confirmed by ChIP-qPCR with an anti-WDR5 antibody (F), an anti-KMT2A antibody (G), or an anti-H3K4me3 antibody (H). Quantitative RT-PCR (qRT-PCR) results of the three ribosomal genes are shown in (I). Data represent mean values ± SEM; N = 4 biologically independent samples. Significance (p value) was evaluated with one-way ANOVA (Dunnett’s test). n.s., not significant; Rep, replicate; RPM, reads per million reads.
Figure 6.
Figure 6.. Loss of EMBOW increases WDR5 and H3K4me3 levels of de novo genes
(A and B) Profile of WDR5 binding (A) or histone modification of H3K4me3 (B) on de novo WDR5 target genes in WT and EMBOW KO HEK293T cells. (C–G) WDR5 binding and H3K4me3 levels at three de novo WDR5 target genes upon EMBOW KO shown by ChIP-seq snapshots (C) and confirmed by ChIP-qPCR with an anti-WDR5 antibody (D), an anti-KMT2A antibody (E), or an anti-H3K4me3 antibody (F). qRT-PCR results of the three target genes are shown in (G). Data represent mean values ± SEM; N = 4 biologically independent samples. Significance (p value) was evaluated with one-way ANOVA (Dunnett’s test). **p < 0.01, *p < 0.05. Rep, replicate. See also Figure S4.

Similar articles

Cited by

References

    1. Shilatifard A (2012). The COMPASS family of histone H3K4 methylases: mechanisms of regulation in development and disease pathogenesis. Annu. Rev. Biochem. 81, 65–95. 10.1146/annurev-biochem-051710-134100. - DOI - PMC - PubMed
    1. Oh E, Mark KG, Mocciaro A, Watson ER, Prabu JR, Cha DD, Kampmann M, Gamarra N, Zhou CY, and Rape M (2020). Gene expression and cell identity controlled by anaphase-promoting complex. Nature 579, 136–140. 10.1038/s41586-020-2034-1. - DOI - PMC - PubMed
    1. Ali A, Veeranki SN, Chinchole A, and Tyagi S (2017). MLL/WDR5 Complex Regulates Kif2A Localization to Ensure Chromosome Congression and Proper Spindle Assembly during Mitosis. Dev. Cell 41, 605–622.e7. 10.1016/j.devcel.2017.05.023. - DOI - PubMed
    1. Thomas LR, Wang Q, Grieb BC, Phan J, Foshage AM, Sun Q, Olejniczak ET, Clark T, Dey S, Lorey S, et al. (2015). Interaction with WDR5 promotes target gene recognition and tumorigenesis by MYC. Mol. Cell 58, 440–452. 10.1016/j.molcel.2015.02.028. - DOI - PMC - PubMed
    1. Chen T, Li K, Liu Z, Liu J, Wang Y, Sun R, Li Z, Qiu B, Zhang X, Ren G, et al. (2021). WDR5 facilitates EMT and metastasis of CCA by increasing HIF-1alpha accumulation in Myc-dependent and independent pathways. Mol. Ther. 29, 2134–2150. 10.1016/j.ymthe.2021.02.017. - DOI - PMC - PubMed

Publication types