

Finding Potential Adverse Events in the Unstructured Text of Electronic Health Care Records: Development of the Shakespeare Method
- PMID: 37725533
- PMCID: PMC10414364
- DOI: 10.2196/27017
Finding Potential Adverse Events in the Unstructured Text of Electronic Health Care Records: Development of the Shakespeare Method
Abstract
Background: Big data tools provide opportunities to monitor adverse events (patient harm associated with medical care) (AEs) in the unstructured text of electronic health care records (EHRs). Writers may explicitly state an apparent association between treatment and adverse outcome ("attributed") or state the simple treatment and outcome without an association ("unattributed"). Many methods for finding AEs in text rely on predefining possible AEs before searching for prespecified words and phrases or manual labeling (standardization) by investigators. We developed a method to identify possible AEs, even if unknown or unattributed, without any prespecifications or standardization of notes. Our method was inspired by word-frequency analysis methods used to uncover the true authorship of disputed works credited to William Shakespeare. We chose two use cases, "transfusion" and "time-based." Transfusion was chosen because new transfusion AE types were becoming recognized during the study data period; therefore, we anticipated an opportunity to find unattributed potential AEs (PAEs) in the notes. With the time-based case, we wanted to simulate near real-time surveillance. We chose time periods in the hope of detecting PAEs due to contaminated heparin from mid-2007 to mid-2008 that were announced in early 2008. We hypothesized that the prevalence of contaminated heparin may have been widespread enough to manifest in EHRs through symptoms related to heparin AEs, independent of clinicians' documentation of attributed AEs.
Objective: We aimed to develop a new method to identify attributed and unattributed PAEs using the unstructured text of EHRs.
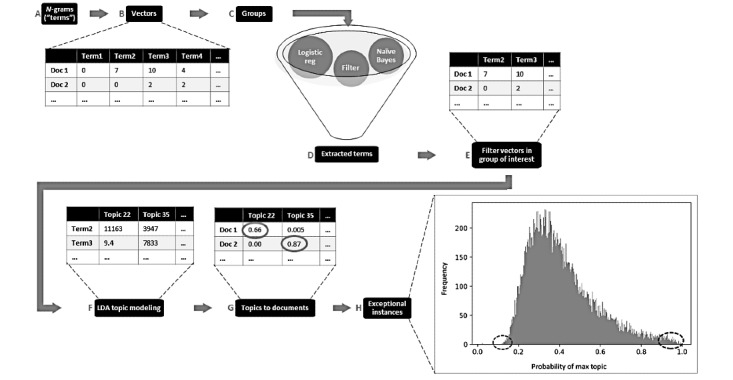
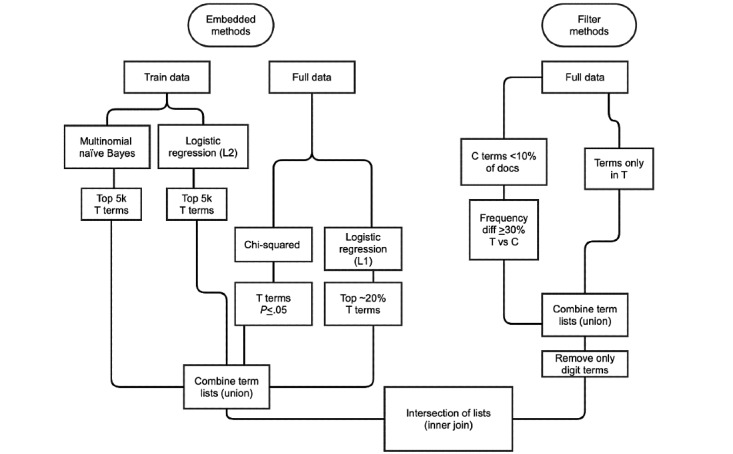
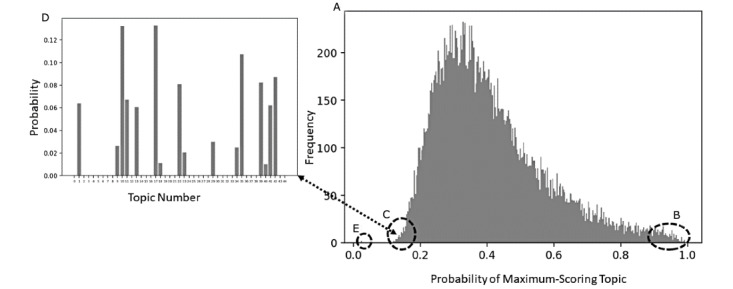
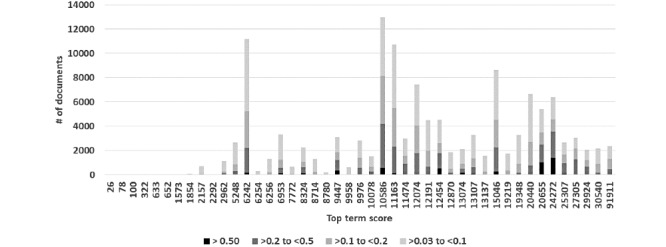
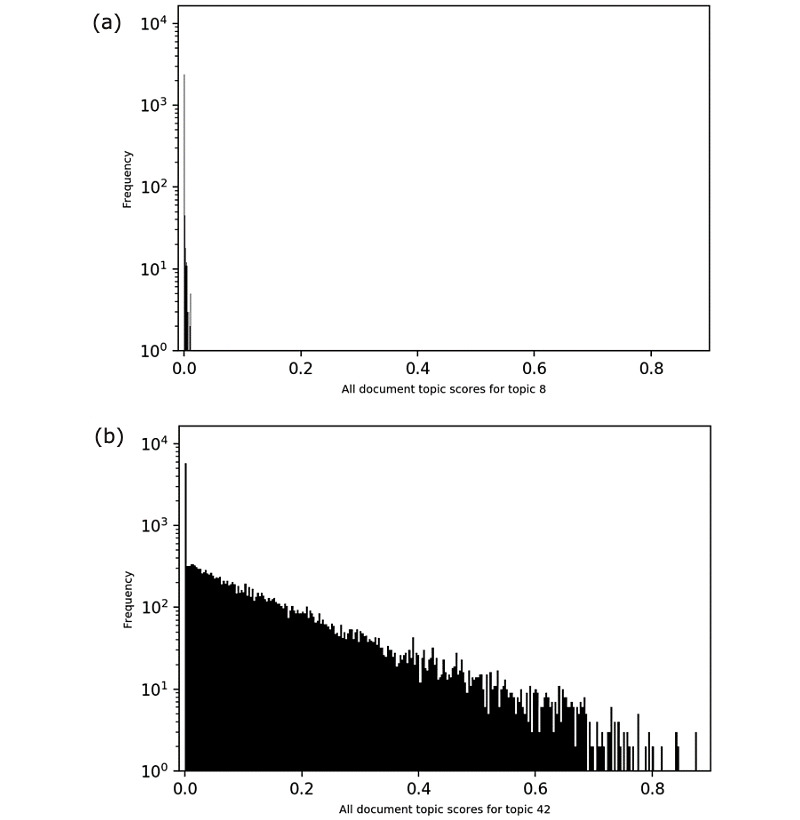
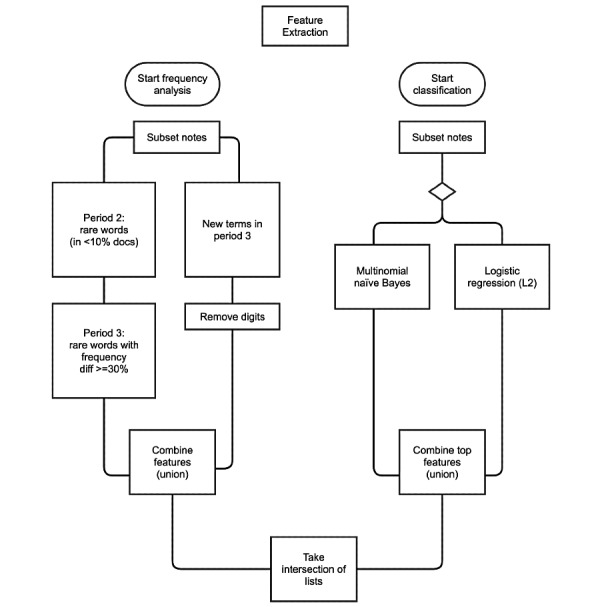
Methods: We used EHRs for adult critical care admissions at a major teaching hospital (2001-2012). For each case, we formed a group of interest and a comparison group. We concatenated the text notes for each admission into one document sorted by date, and deleted replicate sentences and lists. We identified statistically significant words in the group of interest versus the comparison group. Documents in the group of interest were filtered to those words, followed by topic modeling on the filtered documents to produce topics. For each topic, the three documents with the maximum topic scores were manually reviewed to identify PAEs.
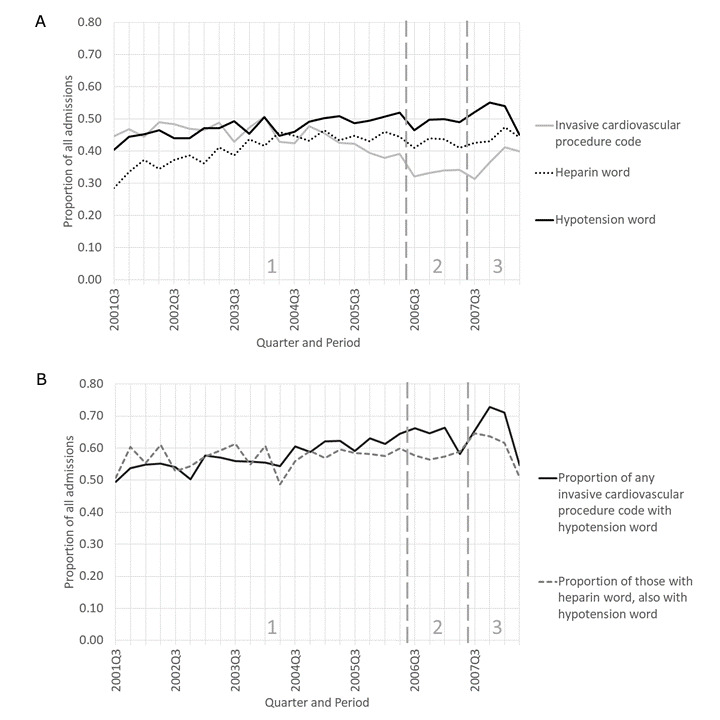
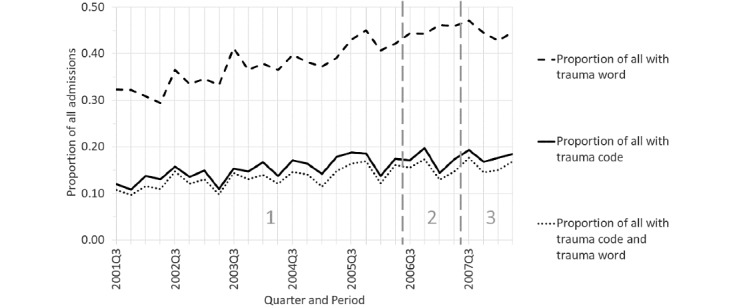
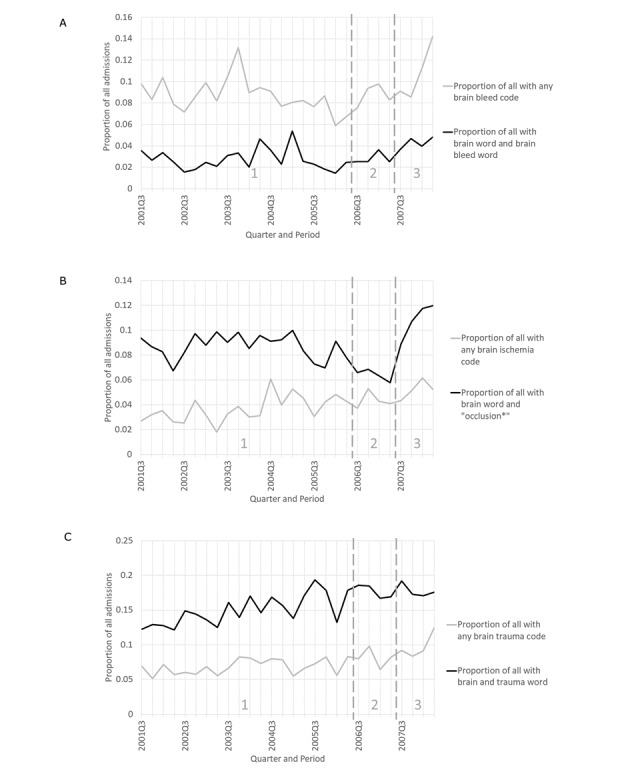
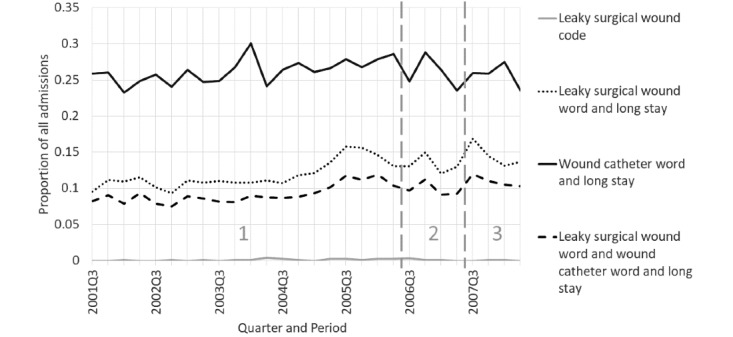
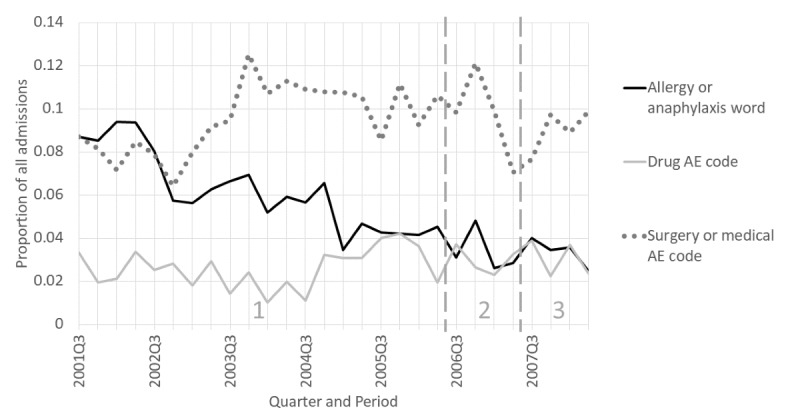
Results: Topics centered around medical conditions that were unique to or more common in the group of interest, including PAEs. In each use case, most PAEs were unattributed in the notes. Among the transfusion PAEs was unattributed evidence of transfusion-associated cardiac overload and transfusion-related acute lung injury. Some of the PAEs from mid-2007 to mid-2008 were increased unattributed events consistent with AEs related to heparin contamination.
Conclusions: The Shakespeare method could be a useful supplement to AE reporting and surveillance of structured EHR data. Future improvements should include automation of the manual review process.
Keywords: big data; critical care; electronic health care record; electronic health record; epidemiology; natural language processing; patient harm; patient safety; product surveillance, postmarketing; proof-of-concept study; public health.
©Roselie A Bright, Summer K Rankin, Katherine Dowdy, Sergey V Blok, Susan J Bright, Lee Anne M Palmer. Originally published in JMIRx Med (https://med.jmirx.org), 11.08.2021.
Conflict of interest statement
Conflicts of Interest: The research was done with FDA support and under contract HHSF223201510027B between the FDA and Booz Allen Hamilton Inc. None of the authors have other relevant financial interests. The opinions presented in this paper are those of the authors and do not represent official policy of either the FDA or Booz Allen Hamilton.
Figures
Update of
- https://www.medrxiv.org/content/10.1101/2021.01.05.21249239v1
- JMIRx Med. 2:e27017.
Similar articles
-
Extraction of Information Related to Drug Safety Surveillance From Electronic Health Record Notes: Joint Modeling of Entities and Relations Using Knowledge-Aware Neural Attentive Models.JMIR Med Inform. 2020 Jul 10;8(7):e18417. doi: 10.2196/18417. JMIR Med Inform. 2020. PMID: 32459650 Free PMC article.
-
Feasibility of Electronic Health Record-Based Triggers in Detecting Dental Adverse Events.Appl Clin Inform. 2018 Jul;9(3):646-653. doi: 10.1055/s-0038-1668088. Epub 2018 Aug 22. Appl Clin Inform. 2018. PMID: 30134473 Free PMC article.
-
Finding Dental Harm to Patients through Electronic Health Record-Based Triggers.JDR Clin Trans Res. 2020 Jul;5(3):271-277. doi: 10.1177/2380084419892550. Epub 2019 Dec 10. JDR Clin Trans Res. 2020. PMID: 31821766 Free PMC article.
-
Adult patient access to electronic health records.Cochrane Database Syst Rev. 2021 Feb 26;2(2):CD012707. doi: 10.1002/14651858.CD012707.pub2. Cochrane Database Syst Rev. 2021. PMID: 33634854 Free PMC article.
-
Convalescent plasma or hyperimmune immunoglobulin for people with COVID-19: a living systematic review.Cochrane Database Syst Rev. 2020 Oct 12;10:CD013600. doi: 10.1002/14651858.CD013600.pub3. Cochrane Database Syst Rev. 2020. Update in: Cochrane Database Syst Rev. 2021 May 20;5:CD013600. doi: 10.1002/14651858.CD013600.pub4. PMID: 33044747 Updated.
References
-
- Scott HD, Thacher-Renshaw A, Rosenbaum S E, Waters W J, Green M, Andrews L G, Faich G A. Physician reporting of adverse drug reactions. Results of the Rhode Island Adverse Drug Reaction Reporting Project. JAMA. 1990 Apr 04;263(13):1785–8. - PubMed
-
- Bright RA. Strategy for surveillance of adverse drug events. Food Drug Law J. 2007;62(3):605–16. - PubMed
LinkOut - more resources
Full Text Sources
