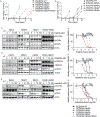
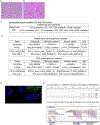
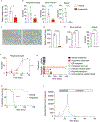
. 2023 Nov 14;29(22):4613-4626.
doi: 10.1158/1078-0432.CCR-22-2562.

Integration of Genomic Sequencing Drives Therapeutic Targeting of PDGFRA in T-Cell Acute Lymphoblastic Leukemia/Lymphoblastic Lymphoma

Affiliations

Integration of Genomic Sequencing Drives Therapeutic Targeting of PDGFRA in T-Cell Acute Lymphoblastic Leukemia/Lymphoblastic Lymphoma

Jonathan Paolino et al. Clin Cancer Res. .

Abstract

Purpose: Patients with relapsed or refractory T-cell acute lymphoblastic leukemia (T-ALL) or lymphoblastic lymphoma (T-LBL) have limited therapeutic options. Clinical use of genomic profiling provides an opportunity to identify targetable alterations to inform therapy.

Experimental design: We describe a cohort of 14 pediatric patients with relapsed or refractory T-ALL enrolled on the Leukemia Precision-based Therapy (LEAP) Consortium trial (NCT02670525) and a patient with T-LBL, discovering alterations in platelet-derived growth factor receptor-α (PDGFRA) in 3 of these patients. We identified a novel mutation in PDGFRA, p.D842N, and used an integrated structural modeling and molecular biology approach to characterize mutations at D842 to guide therapeutic targeting. We conducted a preclinical study of avapritinib in a mouse patient-derived xenograft (PDX) model of FIP1L1-PDGFRA and PDGFRA p.D842N leukemia.

Results: Two patients with T-ALL in the LEAP cohort (14%) had targetable genomic alterations affecting PDGFRA, a FIP1-like 1 protein/PDGFRA (FIP1L1-PDGFRA) fusion and a novel mutation in PDGFRA, p.D842N. The D842N mutation resulted in PDGFRA activation and sensitivity to tested PDGFRA inhibitors. In a T-ALL PDX model, avapritinib treatment led to decreased leukemia burden, significantly prolonged survival, and even cured a subset of mice. Avapritinib treatment was well tolerated and yielded clinical benefit in a patient with refractory T-ALL.

Conclusions: Refractory T-ALL has not been fully characterized. Alterations in PDGFRA or other targetable kinases may inform therapy for patients with refractory T-ALL who otherwise have limited treatment options. Clinical genomic profiling, in real time, is needed for fully informed therapeutic decision making.


Conflict of interest statement

Conflicts of Interest:

YL is a current employee of Merck Pharmaceuticals. BGM is an employee of Blueprint Medicines. MPJ is a consultant to and shareholder of Schrodinger LLC, which licenses software used in this work. KS previously consulted for Kronos Bio, Astra-Zeneca, and Auron Therapeutics, receives grant funding from Novartis and Kronos Bio for an unrelated project and holds stock options with Auron Therapeutics.

Figures

Figure 1:
Figure 1:
Clinical pathology for pediatric T-ALL patients. A. Bone marrow smear from patient 146, stained with hematoxylin and eosin (H&E) stains. Shown is a representative field with image taken at 100X magnification. B. Histology of bone marrow biopsy core from patient 146. Shown is a representative section stained with H&E. Image was taken at 60X magnification. C. Graph showing read counts for probes along chromosome 4 on the RHP v2 assay (Batch CNV) for bone marrow from patient 146. Red highlights amplicons for PDGFRA (exons 10-21 and 23) and demonstrates loss of reads over exons 10-12, suggesting deletion of a 5’ segment of PDGFRA. Shown are data from one of two sample replicates. D. Graph showing PDGFRA expression for T-ALL samples and the EOL1 cell line analyzed using the AMPSeq fusion assay. PDGFRA expression is calculated as number of reads/million total RNA reads. T-ALL samples include all clinical disease samples profiled using the Boston Children’s Hospital AMPSeq fusion panel between July 2020- November 2021.
Figure 2:
Figure 2:
Alchemical free energy calculations predict activation by PDGFRA p.D842X mutants. A. Crystallographic structure of PDGFRA. B. Zoom of the crystal structure around the D842 residue. C. Schematic representation of the thermodynamic cycle of wildtype and mutant PDGFRA in the unfolded and folded, auto-inhibited state. *For the schematic representation of the double mutant D842H/H845D, see Supplementary Figure 1A-B. D. Summary of free energy differences (ΔΔG values).
Figure 3:
Figure 3:
PDGFRA D842 mutations result in activated PDGFRA, IL-3 independent growth, and sensitivity to tyrosine kinase inhibitors. A. Ba/F3 cells expressing PDGFRA WT, p.D842V, p.D842N, p.D842H, p.H845D, p.D842H/p.H845D were grown without IL-3, and cells counted using trypan blue exclusion. Shown is the average number of cells ± SD of 3 replicates. B. Ba/F3 cells expressing PDGFRA WT, p.D842V, p.D842Q, p.D842T, and p.D842E were grown without IL-3, and cells counted using trypan blue exclusion. Shown is the average number of cells ±SD of 3 replicates. C-E. Western immunoblotting showing inhibition of PDGFRA and STAT5 phosphorylation in response to imatinib (C), dasatinib (D), or avapritinib (E). Boxes indicate western blots performed separately and degree of activation cannot be compared between different blots. Ba/F3 cells expressing PDGFRA WT, H845D, D842V, D842N, D842H, or D842H/H845D were tested with a range of imatinib (C), dasatinib (D), or avapritinib (E) concentrations and viability evaluated at day 3 by an ATP-based assay as a percentage of luminescence relative to DMSO control. Shown are the mean ±SD of 4 replicates.
Figure 4:
Figure 4:
Characterization of PDX model of FIP1L1-PDGFRA, PDGFRA p.D842N T-ALL from patient 1. A. Histology of mouse PDX bone marrow stained with H&E stains. Shown is a representative field with image taken at 60X magnification. B. Spleen histology of PDX model stained with H&E stains. Shown is a representative field with image taken at 60X magnification. C. Summary of flow cytometry data from patient 146 and the PDX model from patient 146. D. Table summarizing the genomic profiling results from patient 146 (data from Rapid Heme Panel and AmpSeq fusion assay) and PDX model (sequencing data from Oncopanel). Shown are data for genes that are covered on both assays. Full sequencing data from both samples are included in Supplementary Table 6. E. FISH performed in PDX spleen cells showing fusion of FIP1L1-PDGFRA, with loss of CHIC2. F. RNASeq was performed on spleen cells derived from the PDX model. Image of RNASeq alignment at the indicated area of Chromosome 4. Shown are the PDGFRA p.D842N mutation present in 100% of reads as a vertical green line (black box) in the lower right panel and the FIP1L1-PDGFRA fusion breakpoints in the lower left and center panels. The absence of reads over the earlier exons prior to the breakpoint in PDGRA exon 12 suggests that the mutant fusion allele is responsible for all of the 3' PDGFRA RNA expression and that the PDGFRA c.2524G>A p.D842N point mutation is on the same allele as the fusion.
Figure 5:
Figure 5:
T-ALL with FIP1L1-PDGFRA, PDGFRA p.D842N mutations responds to avapritinib. PDX model from patient 146, characterized by FIP1L1-PDGFRA and PDGFRA p.D842N, was treated with vehicle versus avapritinib. A. Graph showing spleen weight in mice after 7 days of treatment. Shown is average weight (n=3) ±SD. *P<0.05 using unpaired t-test. B. Avapritinib treated mice demonstrated a decrease in leukemia burden in peripheral blood, bone marrow, and spleen after 7 days of treatment. Shown are flow cytometric quantification of total human CD45+ ALL cells in harvested tissues (n=3), average ±SD. ****P<0.0001 using unpaired t-test. C. Histology of mouse bone marrow stained with pSTAT5 from mouse treated with vehicle (left) or avapritinib (right) for 7 days. Shown is a representative field with image taken at 40X magnification. Effect of avapritinib on leukemia burden was more profound after 28 days of treatment. D. Graph showing spleen weight in mice after 28 days of treatment. Shown is average weight (n=3) ±SD. ****P<0.0001 using unpaired t-test. E. Flow cytometric quantification of total human CD45+ ALL cells in bone marrow or spleen after 28 days of treatment. Average % human CD45 shown (n=3) ±SD. ****P<0.0001 using unpaired t-test. F. Peripheral blood leukemia was monitored in mice during treatment. Shown is average % human CD45 positive cells for 3 mice per timepoint over 28 days, ±SD. ****P<0.0001 using a 2-way ANOVA. G. Kaplan-Meier survival curve for PDX mice treated with vehicle or avapritinib. Data shown for mice that were not included in planned tissue analysis, N=6 per group. Curve for avapritinib-treated mice stops when mice with recurrent disease are re-treated with avapritinib. ****P<0.0001 using Log-rank test. H. Swimmer plot depicts complete treatment course of PDX mice treated with vehicle or avapritinib. Three mice in the avapritinib group developed disease recurrence following discontinuation of therapy and were re-treated. I. Graph showing peripheral blood absolute blast count in patient 146 during dasatinib and avapritinib therapy.

References

    1. Pikman Y, Tasian SK, Sulis ML, Stevenson K, Blonquist TM, Apsel Winger B, et al. Matched Targeted Therapy for Pediatric Patients with Relapsed, Refractory, or High-Risk Leukemias: A Report from the LEAP Consortium. Cancer Discov 2021;11(6):1424–39 doi 10.1158/2159-8290.Cd-20-0564. - DOI - PMC - PubMed
    1. Harris MH, DuBois SG, Glade Bender JL, Kim A, Crompton BD, Parker E, et al. Multicenter Feasibility Study of Tumor Molecular Profiling to Inform Therapeutic Decisions in Advanced Pediatric Solid Tumors: The Individualized Cancer Therapy (iCat) Study. JAMA Oncology 2016;2(5):608–15 doi 10.1001/jamaoncol.2015.5689. - DOI - PubMed
    1. Rapport F, Smith J, O'Brien TA, Tyrrell VJ, Mould EV, Long JC, et al. Development of an implementation and evaluation strategy for the Australian 'Zero Childhood Cancer' (Zero) Program: a study protocol. BMJ Open 2020;10(6):e034522 doi 10.1136/bmjopen-2019-034522. - DOI - PMC - PubMed
    1. Massard C, Michiels S, Ferté C, Le Deley M-C, Lacroix L, Hollebecque A, et al. High-Throughput Genomics and Clinical Outcome in Hard-to-Treat Advanced Cancers: Results of the MOSCATO 01 Trial. Cancer Discovery 2017;7(6):586–95 doi 10.1158/2159-8290.Cd-16-1396. - DOI - PubMed
    1. George SL, Izquierdo E, Campbell J, Koutroumanidou E, Proszek P, Jamal S, et al. A tailored molecular profiling programme for children with cancer to identify clinically actionable genetic alterations. Eur J Cancer 2019;121:224–35 doi 10.1016/j.ejca.2019.07.027. - DOI - PMC - PubMed

Publication types

MeSH terms

Substances

Associated data