. 2023 Dec 1;29(23):4973-4989.
doi: 10.1158/1078-0432.CCR-23-0834.

Advanced Age in Humans and Mouse Models of Glioblastoma Show Decreased Survival from Extratumoral Influence

Affiliations

Advanced Age in Humans and Mouse Models of Glioblastoma Show Decreased Survival from Extratumoral Influence

Margaret Johnson et al. Clin Cancer Res. .

Abstract

Purpose: Glioblastoma (GBM) is the most common aggressive primary malignant brain tumor in adults with a median age of onset of 68 to 70 years old. Although advanced age is often associated with poorer GBM patient survival, the predominant source(s) of maladaptive aging effects remains to be established. Here, we studied intratumoral and extratumoral relationships between adult patients with GBM and mice with brain tumors across the lifespan.

Experimental design: Electronic health records at Northwestern Medicine and the NCI SEER databases were evaluated for GBM patient age and overall survival. The commercial Tempus and Caris databases, as well as The Cancer Genome Atlas were profiled for gene expression, DNA methylation, and mutational changes with varying GBM patient age. In addition, gene expression analysis was performed on the extratumoral brain of younger and older adult mice with or without a brain tumor. The survival of young and old wild-type or transgenic (INK-ATTAC) mice with a brain tumor was evaluated after treatment with or without senolytics and/or immunotherapy.

Results: Human patients with GBM ≥65 years of age had a significantly decreased survival compared with their younger counterparts. While the intra-GBM molecular profiles were similar between younger and older patients with GBM, non-tumor brain tissue had a significantly different gene expression profile between young and old mice with a brain tumor and the eradication of senescent cells improved immunotherapy-dependent survival of old but not young mice.

Conclusions: This work suggests a potential benefit for combining senolytics with immunotherapy in older patients with GBM.


Figures

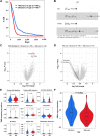
Figure 1. The relationship between MGMT promoter methylation status, tumor cell infiltration, OS, and GBM patient age. A, Life expectancy from the SEER database for patients with GBM. Subjects were stratified by 18 to 44 (blue), 45 to 54 (orange), 55 to 64 (purple), 65 to 74 (green), or 75+ (red) years of age (YOA). B, Competing risk analysis of patients with GBM to account for non–GBM-related mortality. Subjects were stratified by 18 to 44 (red), 45 to 54 (blue), 55 to 64 (green), 65 to 74 (purple), or 75+ (orange) YOA. The NMEDW was accessed to assess GBM patient survival based on (C) IDHwt status and (D) MGMT promoter methylation status. Subjects were stratified by (C) <65 (blue) or ≥65 (red) YOA or by (D) <65 YOA and MGMT unmethylated (purple), ≥65 YOA and MGMT-unmethylated (red), <65 YOA and MGMT methylated (blue), ≥65 YOA and MGMT methylated (green), respectively. Levels of GBM cell brainstem infiltration (E) and associated OS (F) for human patients that were stratified by age. Groups include <65 YOA and no brainstem infiltration (yellow, n = 1), ≥65 YOA and no brainstem infiltration (red, n = 1), <65 YOA and microscopic brainstem infiltration (green, n = 4), ≥65 YOA and microscopic brainstem infiltration (purple, n = 5), <65 YOA and extensive brainstem infiltration (blue, n = 20), or ≥65 YOA and extensive brainstem infiltration (pink, n = 2). *, P < 0.05; ****, P < 0.0001.
Figure 1.
The relationship between MGMT promoter methylation status, tumor cell infiltration, OS, and GBM patient age. A, Life expectancy from the SEER database for patients with GBM. Subjects were stratified by 18 to 44 (blue), 45 to 54 (orange), 55 to 64 (purple), 65 to 74 (green), or 75+ (red) years of age (YOA). B, Competing risk analysis of patients with GBM to account for non–GBM-related mortality. Subjects were stratified by 18 to 44 (red), 45 to 54 (blue), 55 to 64 (green), 65 to 74 (purple), or 75+ (orange) YOA. The NMEDW was accessed to assess GBM patient survival based on (C) IDHwt status and (D) MGMT promoter methylation status. Subjects were stratified by (C) <65 (blue) or ≥65 (red) YOA or by (D) <65 YOA and MGMT unmethylated (purple), ≥65 YOA and MGMT-unmethylated (red), <65 YOA and MGMT methylated (blue), ≥65 YOA and MGMT methylated (green), respectively. Levels of GBM cell brainstem infiltration (E) and associated OS (F) for human patients that were stratified by age. Groups include <65 YOA and no brainstem infiltration (yellow, n = 1), ≥65 YOA and no brainstem infiltration (red, n = 1), <65 YOA and microscopic brainstem infiltration (green, n = 4), ≥65 YOA and microscopic brainstem infiltration (purple, n = 5), <65 YOA and extensive brainstem infiltration (blue, n = 20), or ≥65 YOA and extensive brainstem infiltration (pink, n = 2). *, P < 0.05; ****, P < 0.0001.
Figure 2. Intratumoral gene expression, TMB, and DNAm does not substantially change in younger as compared with older patients with GBM. A, OS of patients with GBM from TCGA as stratified by <65 (blue) or ≥65 (red) years of age (YOA). B, Cox proportional hazards model for GBM patient age and sex. C, Differentially methylated genes in patients ≥65 YOA (blue; n = 92) as compared with patients <65 YOA (red; n = 170). D, RNA expression in patients with GBM ≥65 YOA (red; n = 57) as compared with patients <65 YOA (n = 96). E, TMB in patients with GBM <65 (blue) and ≥65 YOA (red) stratified by mutation type. F, DNAm age acceleration in patients with GBM <65 (blue) and ≥65 YOA (red).
Figure 2.
Intratumoral gene expression, TMB, and DNAm does not substantially change in younger as compared with older patients with GBM. A, OS of patients with GBM from TCGA as stratified by <65 (blue) or ≥65 (red) years of age (YOA). B, Cox proportional hazards model for GBM patient age and sex. C, Differentially methylated genes in patients ≥65 YOA (blue; n = 92) as compared with patients <65 YOA (red; n = 170). D, RNA expression in patients with GBM ≥65 YOA (red; n = 57) as compared with patients <65 YOA (n = 96). E, TMB in patients with GBM <65 (blue) and ≥65 YOA (red) stratified by mutation type. F, DNAm age acceleration in patients with GBM <65 (blue) and ≥65 YOA (red).
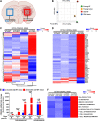
Figure 3. Gene expression profiling of the extratumoral brain for young and older adult mice with or without a brain tumor. A, Schematic representation of how the extratumoral (left brain hemisphere) and intratumoral (right brain hemisphere when indicated) compartments are defined within the same brain. B, PCA of the naïve or extratumoral brain from C57BL/6 mice at: 2 months of age without a brain tumor (green), 2 months of age with a brain tumor (yellow), 23 months of age without a brain tumor (red), and 23 months of age with a brain tumor (blue). C, Global RNA-seq heat map of the samples shown in B. D, Gene expression associated with p53, senescence, and SASP pathways/products. E, The brain from 2-month-old and 23-month-old mice with intracranial GL261 was isolated from naïve mice or at 7 (n = 5), 14 (n = 5), or 21 (n = 5) days post-intracranial injection (i.c.) for RT-PCR analysis of the intra- and extratumoral tissues for CDKN2A. F, Gene expression associated with immune-related pathways/products. **, P < 0.01; ***, P < 0.001. (A, Created with BioRender.com.)
Figure 3.
Gene expression profiling of the extratumoral brain for young and older adult mice with or without a brain tumor. A, Schematic representation of how the extratumoral (left brain hemisphere) and intratumoral (right brain hemisphere when indicated) compartments are defined within the same brain. B, PCA of the naïve or extratumoral brain from C57BL/6 mice at: 2 months of age without a brain tumor (green), 2 months of age with a brain tumor (yellow), 23 months of age without a brain tumor (red), and 23 months of age with a brain tumor (blue). C, Global RNA-seq heat map of the samples shown in B. D, Gene expression associated with p53, senescence, and SASP pathways/products. E, The brain from 2-month-old and 23-month-old mice with intracranial GL261 was isolated from naïve mice or at 7 (n = 5), 14 (n = 5), or 21 (n = 5) days post-intracranial injection (i.c.) for RT-PCR analysis of the intra- and extratumoral tissues for CDKN2A. F, Gene expression associated with immune-related pathways/products. **, P < 0.01; ***, P < 0.001. (A, Created with BioRender.com.)
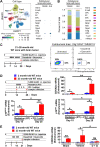
Figure 4. Cellular identification in the brain of young and older adult mice with an intracranial tumor and after treatment with radiotherapy (RT) and PD-1 mAb or dasatinib and quercetin. A, UMAP analysis for scRNA-seq analysis of the extratumoral brain for young 7-week-old and old 85-week-old C57BL/6 mice with intracranial CT-2A to visualize populations of cells including astrocytes (Astro), B cells, choroid plexus epithelial cells (CPC), EC, ependymocytes (EPC), ImmN, MAC, MG, neutrophils (Neut), OLG, OPCs, T cells, and mNeur. Among these cell populations, the relative frequency of p16INK4A+ expression is shown. B, Of the total number of cells from the identified cellular populations, each one is demonstrated as a proportion of the total for the extratumoral brain from young and old mice with a brain tumor. scRNA-seq data represent the pooled analysis of 2 mice/group. C, 21- to 28-month-old C57BL/6 mice with intracranial GL261 were treated with dasatinib (5 mg/kg) and quercetin (50 mg/kg), Monday–Friday, for 2 weeks beginning on Day 7 post i.c. Extratumoral brain isolation occurred on Day 20 after tumor cell injection and flow cytometric analysis for beta-galactosidase in cells positive for oligodendrocyte marker O1 (Olig) and negative for GFAP and TMEM119 are shown. A flow cytometry contour plot is shown for one mouse that represents the outcomes for each group (n = 3 mice/group). D, 8-week-old (blue) and 90-week-old (red) C57BL/6 mice with intracranial GL261 were treated with 2 Gy radiation (RT) x 5 days total and one 500-μg loading dose followed by three 100-μg maintenance doses of anti–PD-1 mAb beginning at day 14 after tumor cell injection. Extratumoral brain and brain tumor samples were collected on days 15 and 25 posttreatment for RT-PCR analysis of CDKN2A, p16INK4A, and p19ARF. E, 8-week-old (blue) and 90-week-old (red) C57BL/6 mice were intracranially injected with GL261 cells and treated with or without dasatinib (D; 5 mg/kg) and quercetin (Q; 50 mg/kg) on days 9, 10, 11, 14, 15, and 16 post-engraftment. Extratumoral brain and brain tumor samples were collected for quantitative gene expression analysis of CDKN2A. *, P < 0.05; **, P < 0.01; ***, P < 0.001; ns, not significant
Figure 4.
Cellular identification in the brain of young and older adult mice with an intracranial tumor and after treatment with radiotherapy (RT) and PD-1 mAb or dasatinib and quercetin. A, UMAP analysis for scRNA-seq analysis of the extratumoral brain for young 7-week-old and old 85-week-old C57BL/6 mice with intracranial CT-2A to visualize populations of cells including astrocytes (Astro), B cells, choroid plexus epithelial cells (CPC), EC, ependymocytes (EPC), ImmN, MAC, MG, neutrophils (Neut), OLG, OPCs, T cells, and mNeur. Among these cell populations, the relative frequency of p16INK4A+ expression is shown. B, Of the total number of cells from the identified cellular populations, each one is demonstrated as a proportion of the total for the extratumoral brain from young and old mice with a brain tumor. scRNA-seq data represent the pooled analysis of 2 mice/group. C, 21- to 28-month-old C57BL/6 mice with intracranial GL261 were treated with dasatinib (5 mg/kg) and quercetin (50 mg/kg), Monday–Friday, for 2 weeks beginning on Day 7 post i.c. Extratumoral brain isolation occurred on Day 20 after tumor cell injection and flow cytometric analysis for beta-galactosidase in cells positive for oligodendrocyte marker O1 (Olig) and negative for GFAP and TMEM119 are shown. A flow cytometry contour plot is shown for one mouse that represents the outcomes for each group (n = 3 mice/group). D, 8-week-old (blue) and 90-week-old (red) C57BL/6 mice with intracranial GL261 were treated with 2 Gy radiation (RT) x 5 days total and one 500-μg loading dose followed by three 100-μg maintenance doses of anti–PD-1 mAb beginning at day 14 after tumor cell injection. Extratumoral brain and brain tumor samples were collected on days 15 and 25 posttreatment for RT-PCR analysis of CDKN2A, p16INK4A, and p19ARF. E, 8-week-old (blue) and 90-week-old (red) C57BL/6 mice were intracranially injected with GL261 cells and treated with or without dasatinib (D; 5 mg/kg) and quercetin (Q; 50 mg/kg) on days 9, 10, 11, 14, 15, and 16 post-engraftment. Extratumoral brain and brain tumor samples were collected for quantitative gene expression analysis of CDKN2A. *, P < 0.05; **, P < 0.01; ***, P < 0.001; ns, not significant
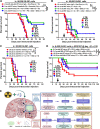
Figure 5. Evaluation of LTS after treatment with immunotherapy and/or senescent cell eradication strategies in young or older adult mice with a brain tumor. A, 2- and (B) 18-month-old C57BL/6 WT mice were intracranially engrafted with 50,000 GL261 cells and treated with either (i) IgG control antibodies and empty OraPlus (red circle), (ii) 5 mg/kg dasatinib (D) and 50 mg/kg quercetin (Q), (iii) 2 Gy x 5 days radiotherapy (RT), one 500-μg loading dose followed by three 100-μg maintenance doses of anti–PD-1 mAb (clone J43), and 100 mg/kg IDO1 enzyme inhibitor (IDO1i; BGB-7204) x 5 days/week for up to 4 weeks total, or (iv) the combination of D, Q, RT, anti–PD-1 mAB and IDOi, beginning at day 14 post-5×10⁴ GL261 cell injection per the dosing schedule described in Supplementary Fig. S4. C, 20- to 22-month-old WT mice were intracranially engrafted with 5×10⁴ GL261 cells and treated with either (i) vehicle control, (ii) D and Q, (iii) 2 Gy x 5 days RT and 33 mg/kg TMZ, or the combination of D, Q, RT, and TMZ beginning at day 14 post-5×10⁴ GL261 cell injection. D, 3- to 5- and 19- to 23-month-old WT and INK-ATTAC (C57BL/6 background) mice began treatment with 10 mg/kg AP20187×2 to 3 days/week at day -21 prior to intracranial engraftment with 5×10³ GL261 cells. Mice were then further treated with 2 Gy x 5 days RT, one 500-μg loading dose followed by three 100-μg maintenance doses of anti–PD-1 mAb (clone J43), and 100 mg/kg IDO1 enzyme inhibitor IDOi beginning at day 14 post–tumor cell injection. E, Schematic representation of the findings reported in this manuscript. *, P < 0.05; ***, P < 0.001. (E, Created with BioRender.com.)
Figure 5.
Evaluation of LTS after treatment with immunotherapy and/or senescent cell eradication strategies in young or older adult mice with a brain tumor. A, 2- and (B) 18-month-old C57BL/6 WT mice were intracranially engrafted with 50,000 GL261 cells and treated with either (i) IgG control antibodies and empty OraPlus (red circle), (ii) 5 mg/kg dasatinib (D) and 50 mg/kg quercetin (Q), (iii) 2 Gy x 5 days radiotherapy (RT), one 500-μg loading dose followed by three 100-μg maintenance doses of anti–PD-1 mAb (clone J43), and 100 mg/kg IDO1 enzyme inhibitor (IDO1i; BGB-7204) x 5 days/week for up to 4 weeks total, or (iv) the combination of D, Q, RT, anti–PD-1 mAB and IDOi, beginning at day 14 post-5×10⁴ GL261 cell injection per the dosing schedule described in Supplementary Fig. S4. C, 20- to 22-month-old WT mice were intracranially engrafted with 5×10⁴ GL261 cells and treated with either (i) vehicle control, (ii) D and Q, (iii) 2 Gy x 5 days RT and 33 mg/kg TMZ, or the combination of D, Q, RT, and TMZ beginning at day 14 post-5×10⁴ GL261 cell injection. D, 3- to 5- and 19- to 23-month-old WT and INK-ATTAC (C57BL/6 background) mice began treatment with 10 mg/kg AP20187×2 to 3 days/week at day -21 prior to intracranial engraftment with 5×10³ GL261 cells. Mice were then further treated with 2 Gy x 5 days RT, one 500-μg loading dose followed by three 100-μg maintenance doses of anti–PD-1 mAb (clone J43), and 100 mg/kg IDO1 enzyme inhibitor IDOi beginning at day 14 post–tumor cell injection. E, Schematic representation of the findings reported in this manuscript. *, P < 0.05; ***, P < 0.001. (E, Created with BioRender.com.)

References

    1. Laconi E, Marongiu F, DeGregori J. Cancer as a disease of old age: changing mutational and microenvironmental landscapes. Br J Cancer 2020;122:943–52. - PMC - PubMed
    1. Ladomersky E, Scholtens DM, Kocherginsky M, Hibler EA, Bartom ET, Otto-Meyer S, et al. The coincidence between increasing age, immunosuppression, and the incidence of patients with glioblastoma. Front Pharmacol 2019;10:200. - PMC - PubMed
    1. Siegel RL, Miller KD, Fuchs HE, Jemal A. Cancer statistics, 2022. CA Cancer J Clin 2022;72:7–33. - PubMed
    1. Ostrom QT, Cioffi G, Waite K, Kruchko C, Barnholtz-Sloan JS. CBTRUS statistical report: primary brain and other central nervous system tumors diagnosed in the United States in 2014–2018. Neuro Oncol 2021;23:iii1–iii105. - PMC - PubMed
    1. Ladomersky E, Zhai L, Lauing KL, Bell A, Xu J, Kocherginsky M, et al. Advanced age increases immunosuppression in the brain and decreases immunotherapeutic efficacy in subjects with glioblastoma. Clin Cancer Res 2020;26:5232–45. - PMC - PubMed

Publication types

Substances