. 2023 Oct 12;186(21):4583-4596.e13.
doi: 10.1016/j.cell.2023.08.022. Epub 2023 Sep 18.

CD1 lipidomes reveal lipid-binding motifs and size-based antigen-display mechanisms

Affiliations

CD1 lipidomes reveal lipid-binding motifs and size-based antigen-display mechanisms

Shouxiong Huang et al. Cell. .

Abstract

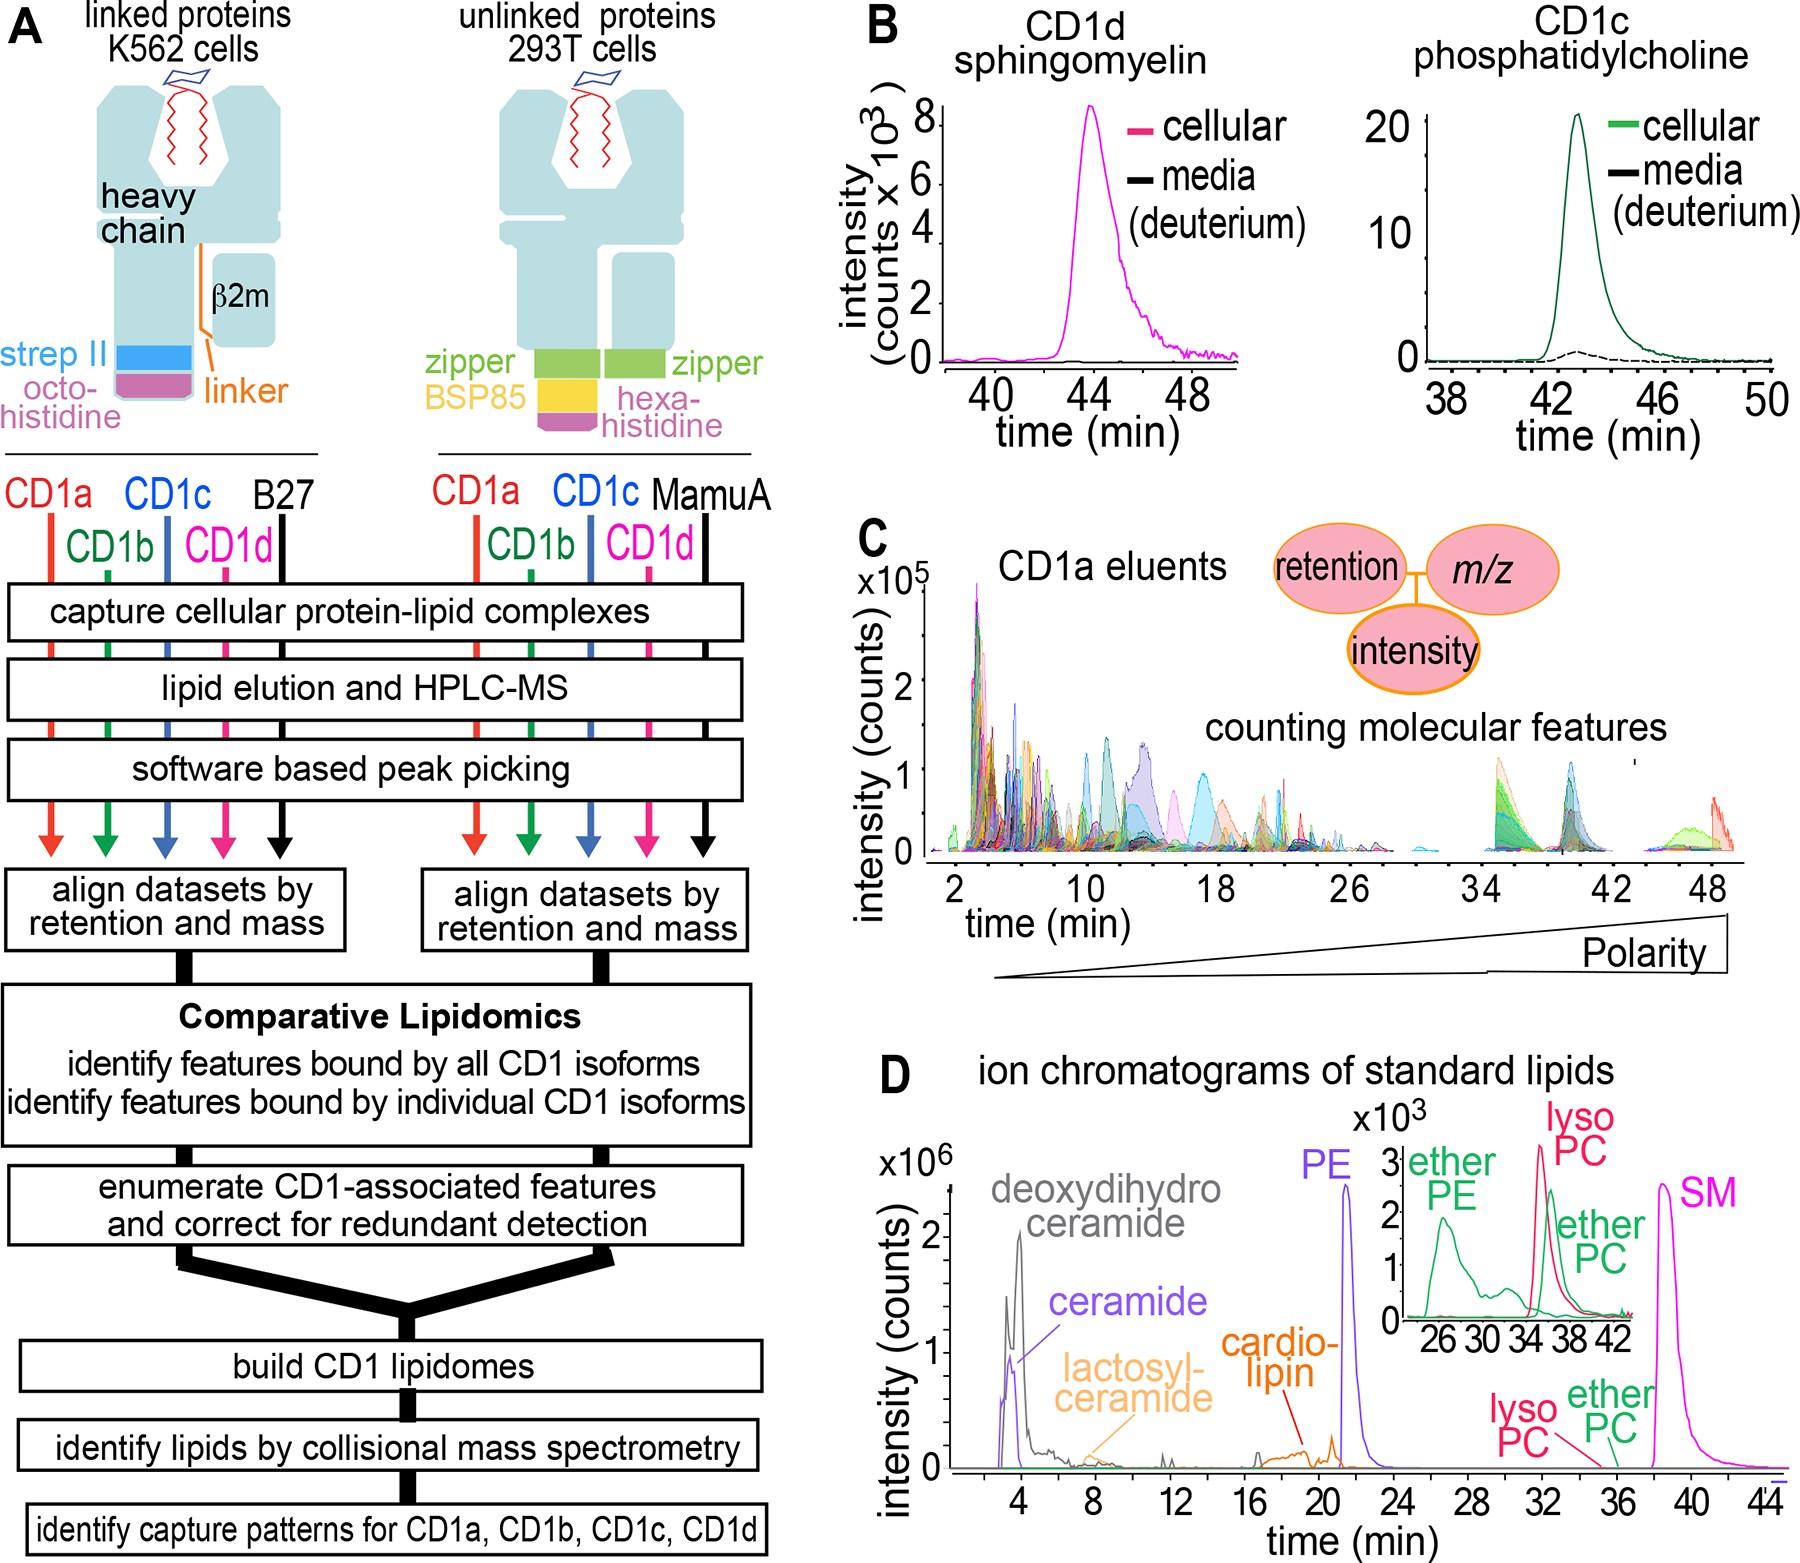
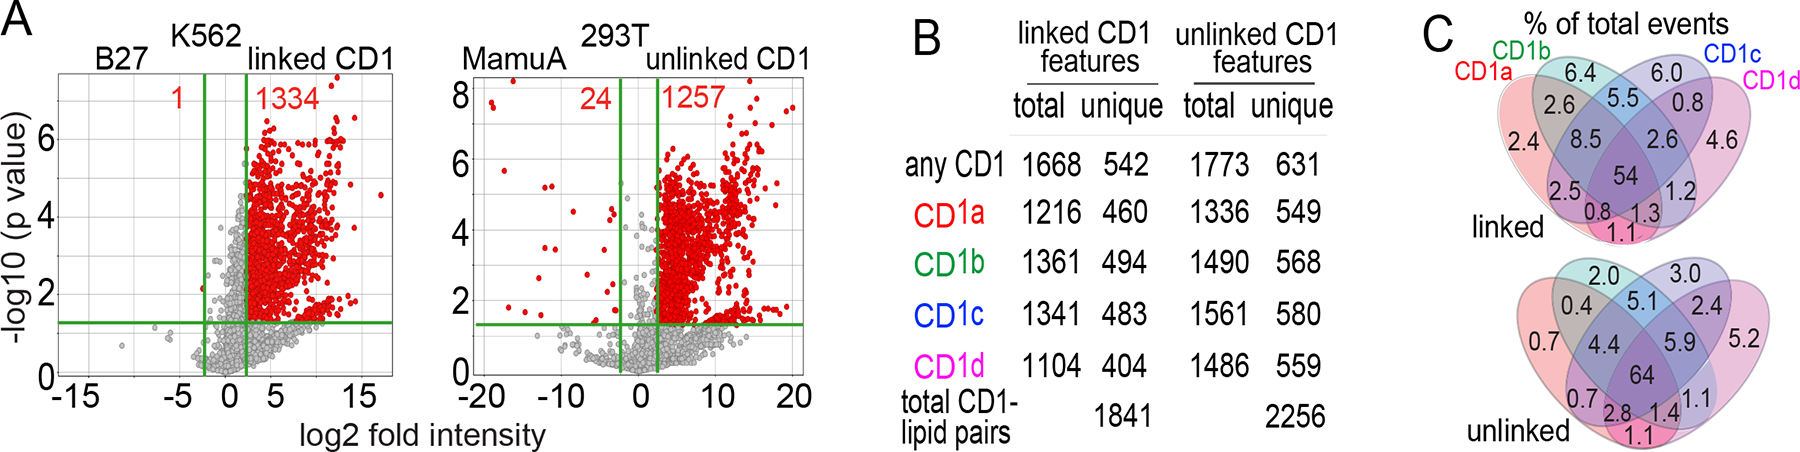
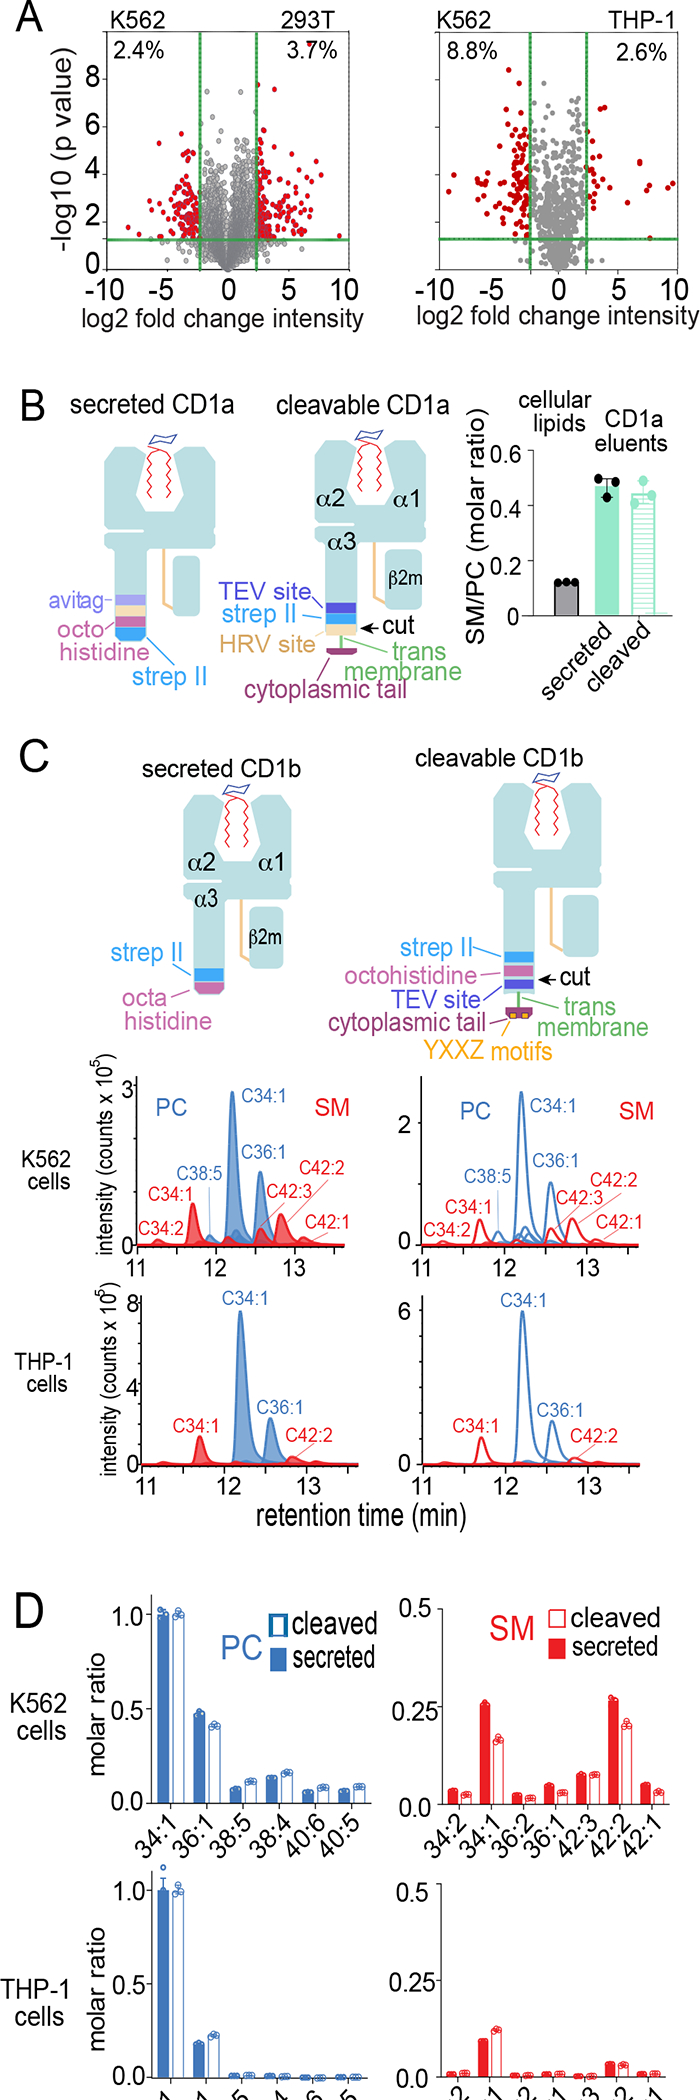
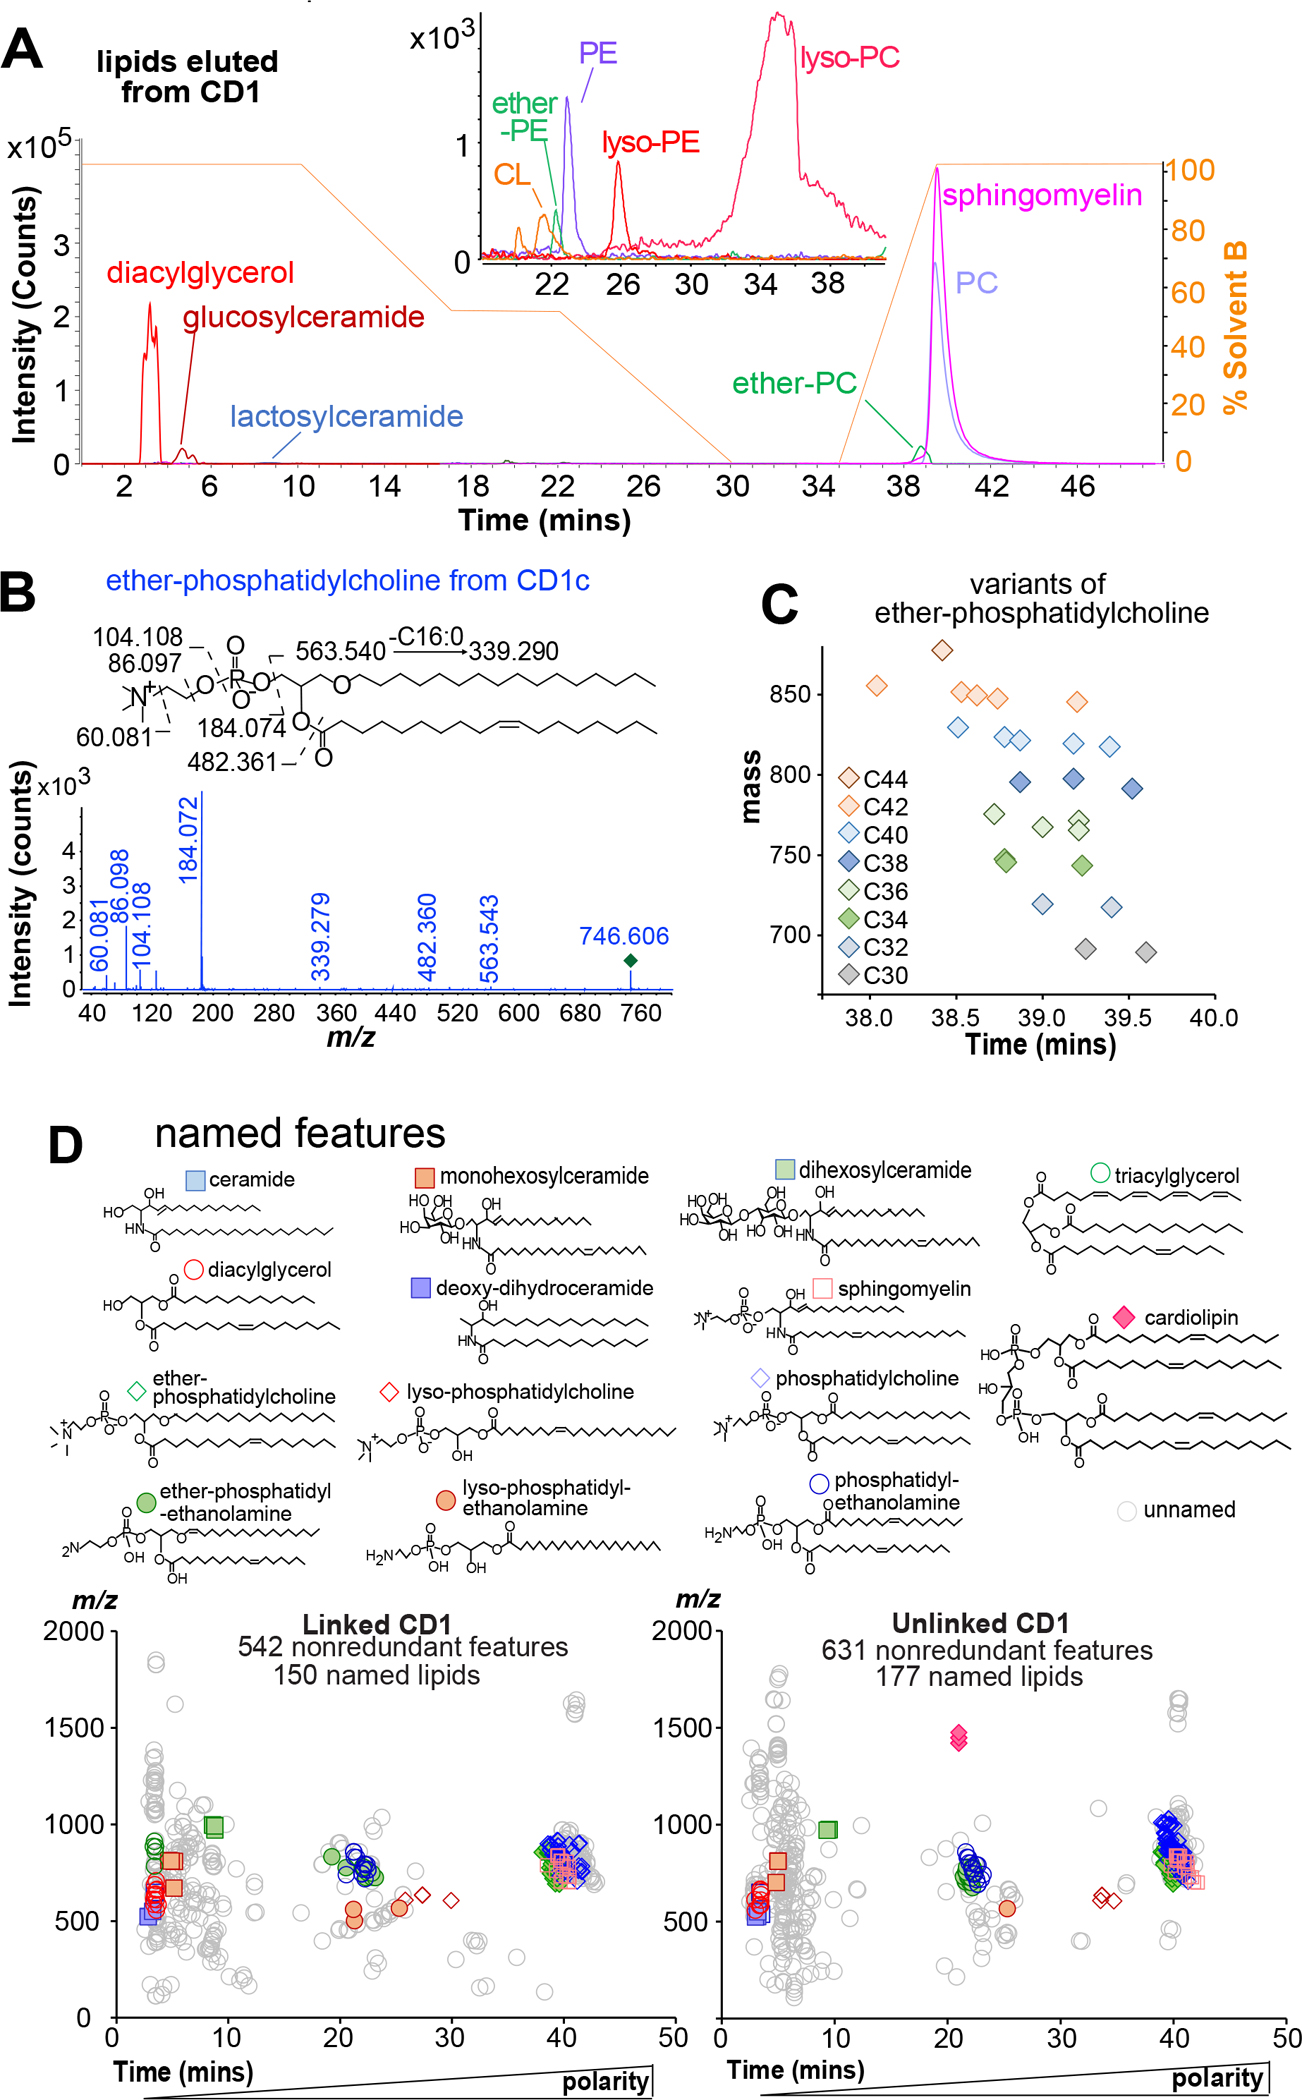
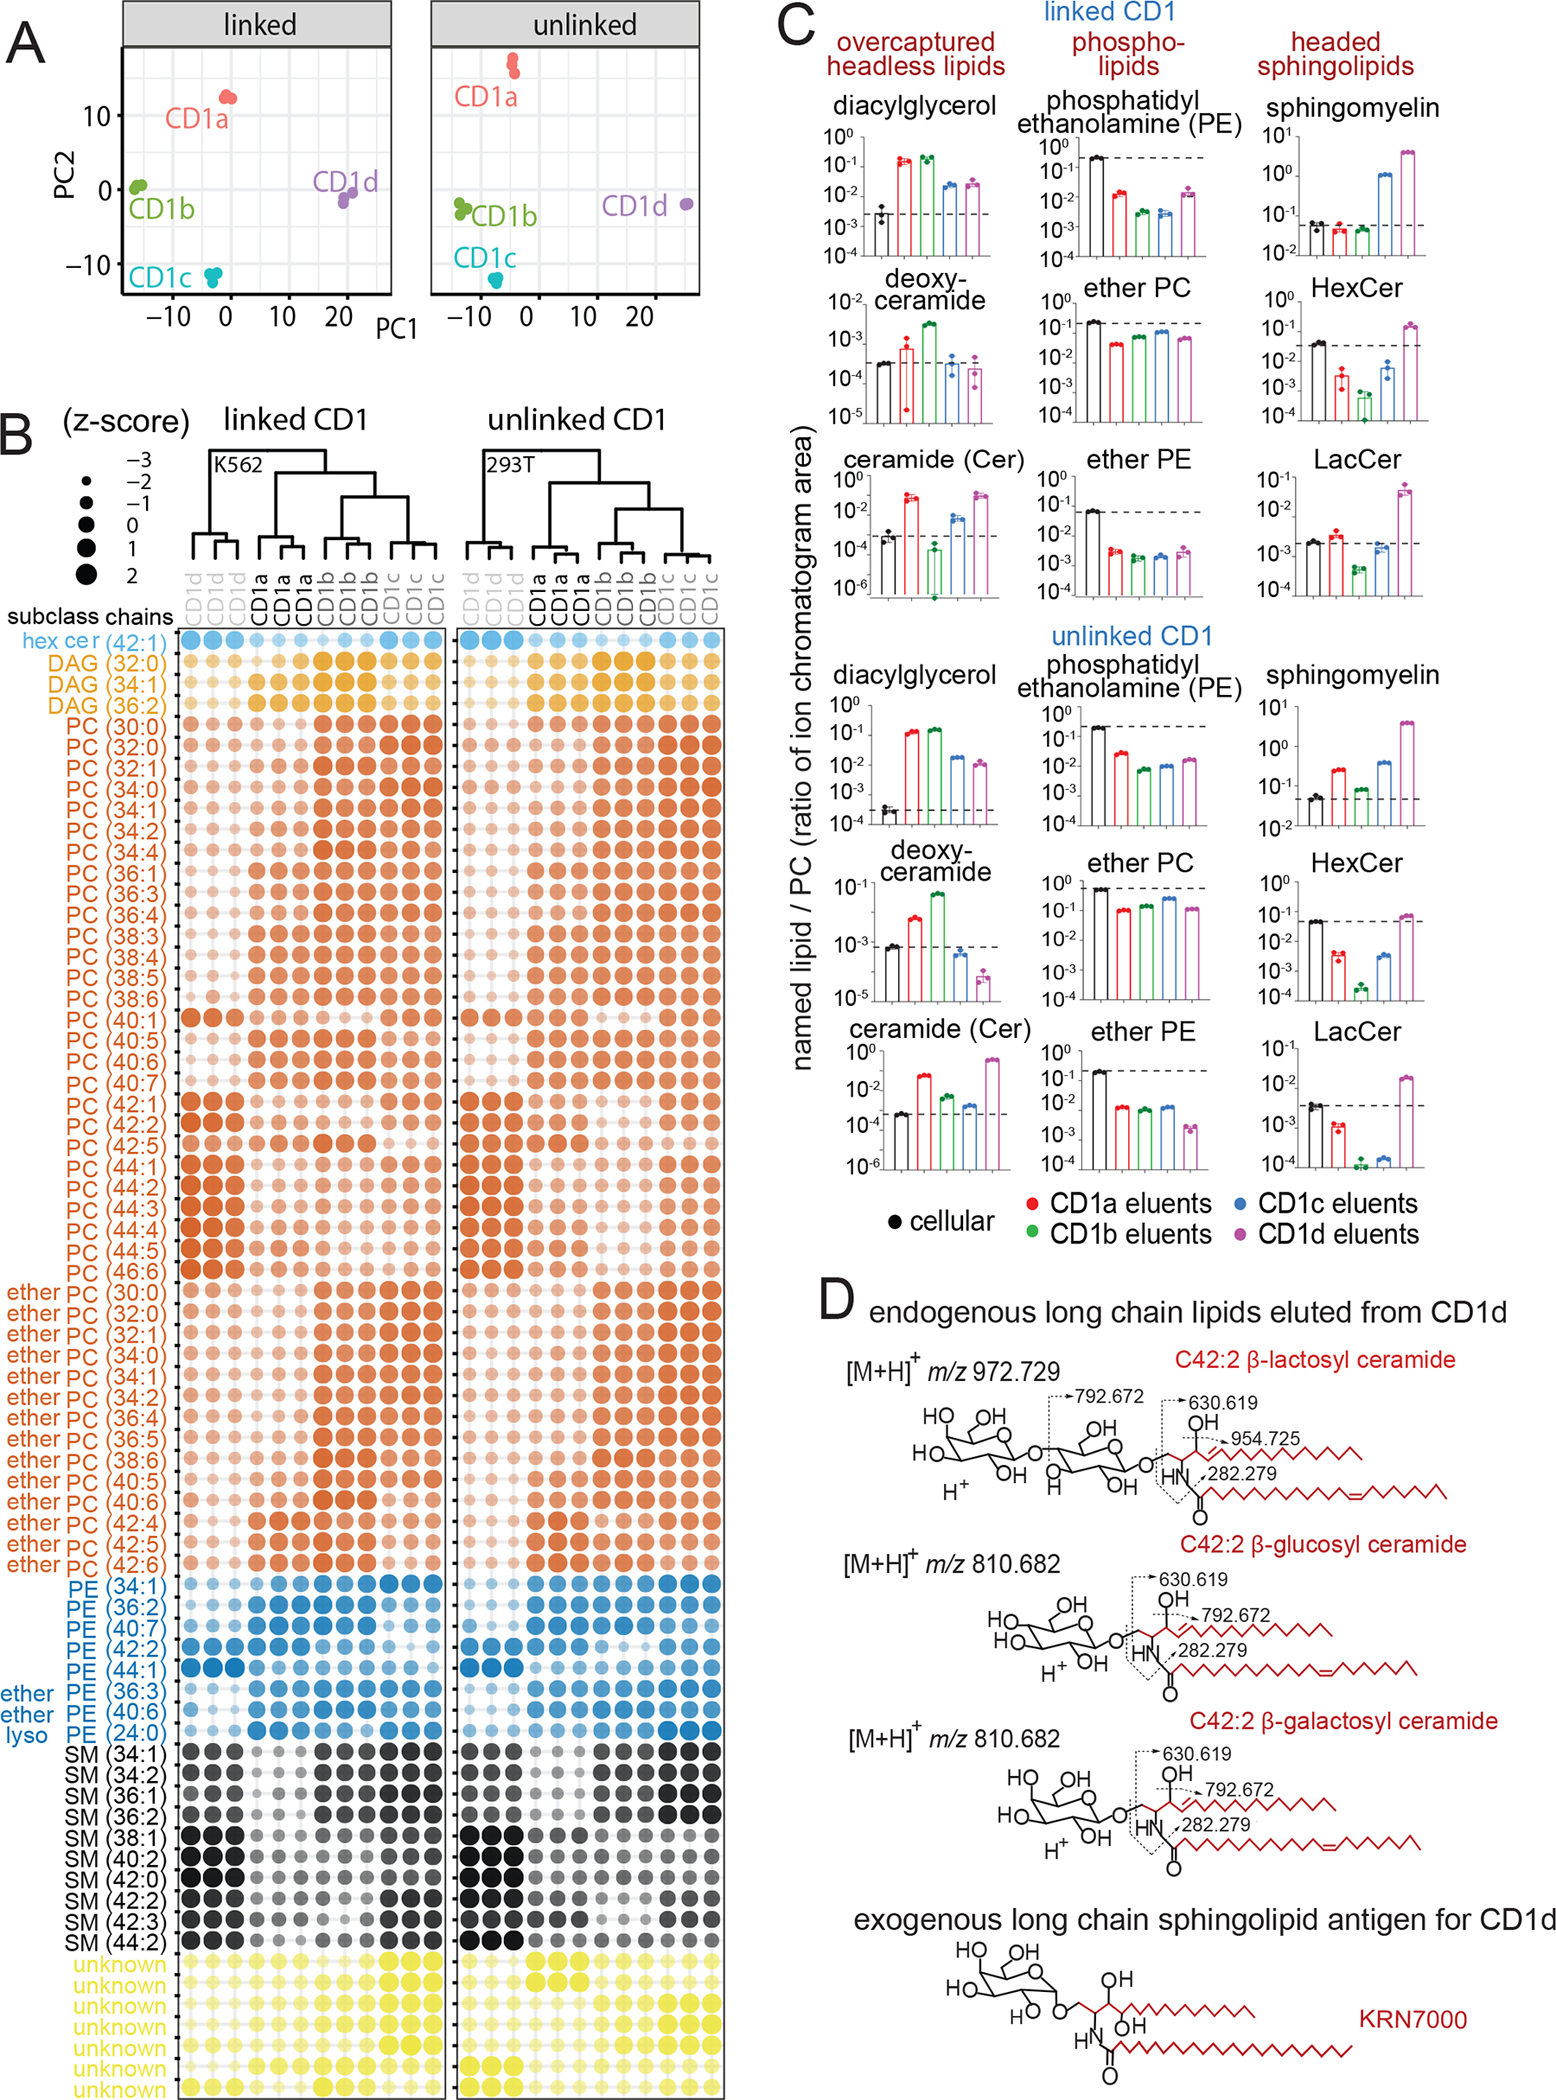
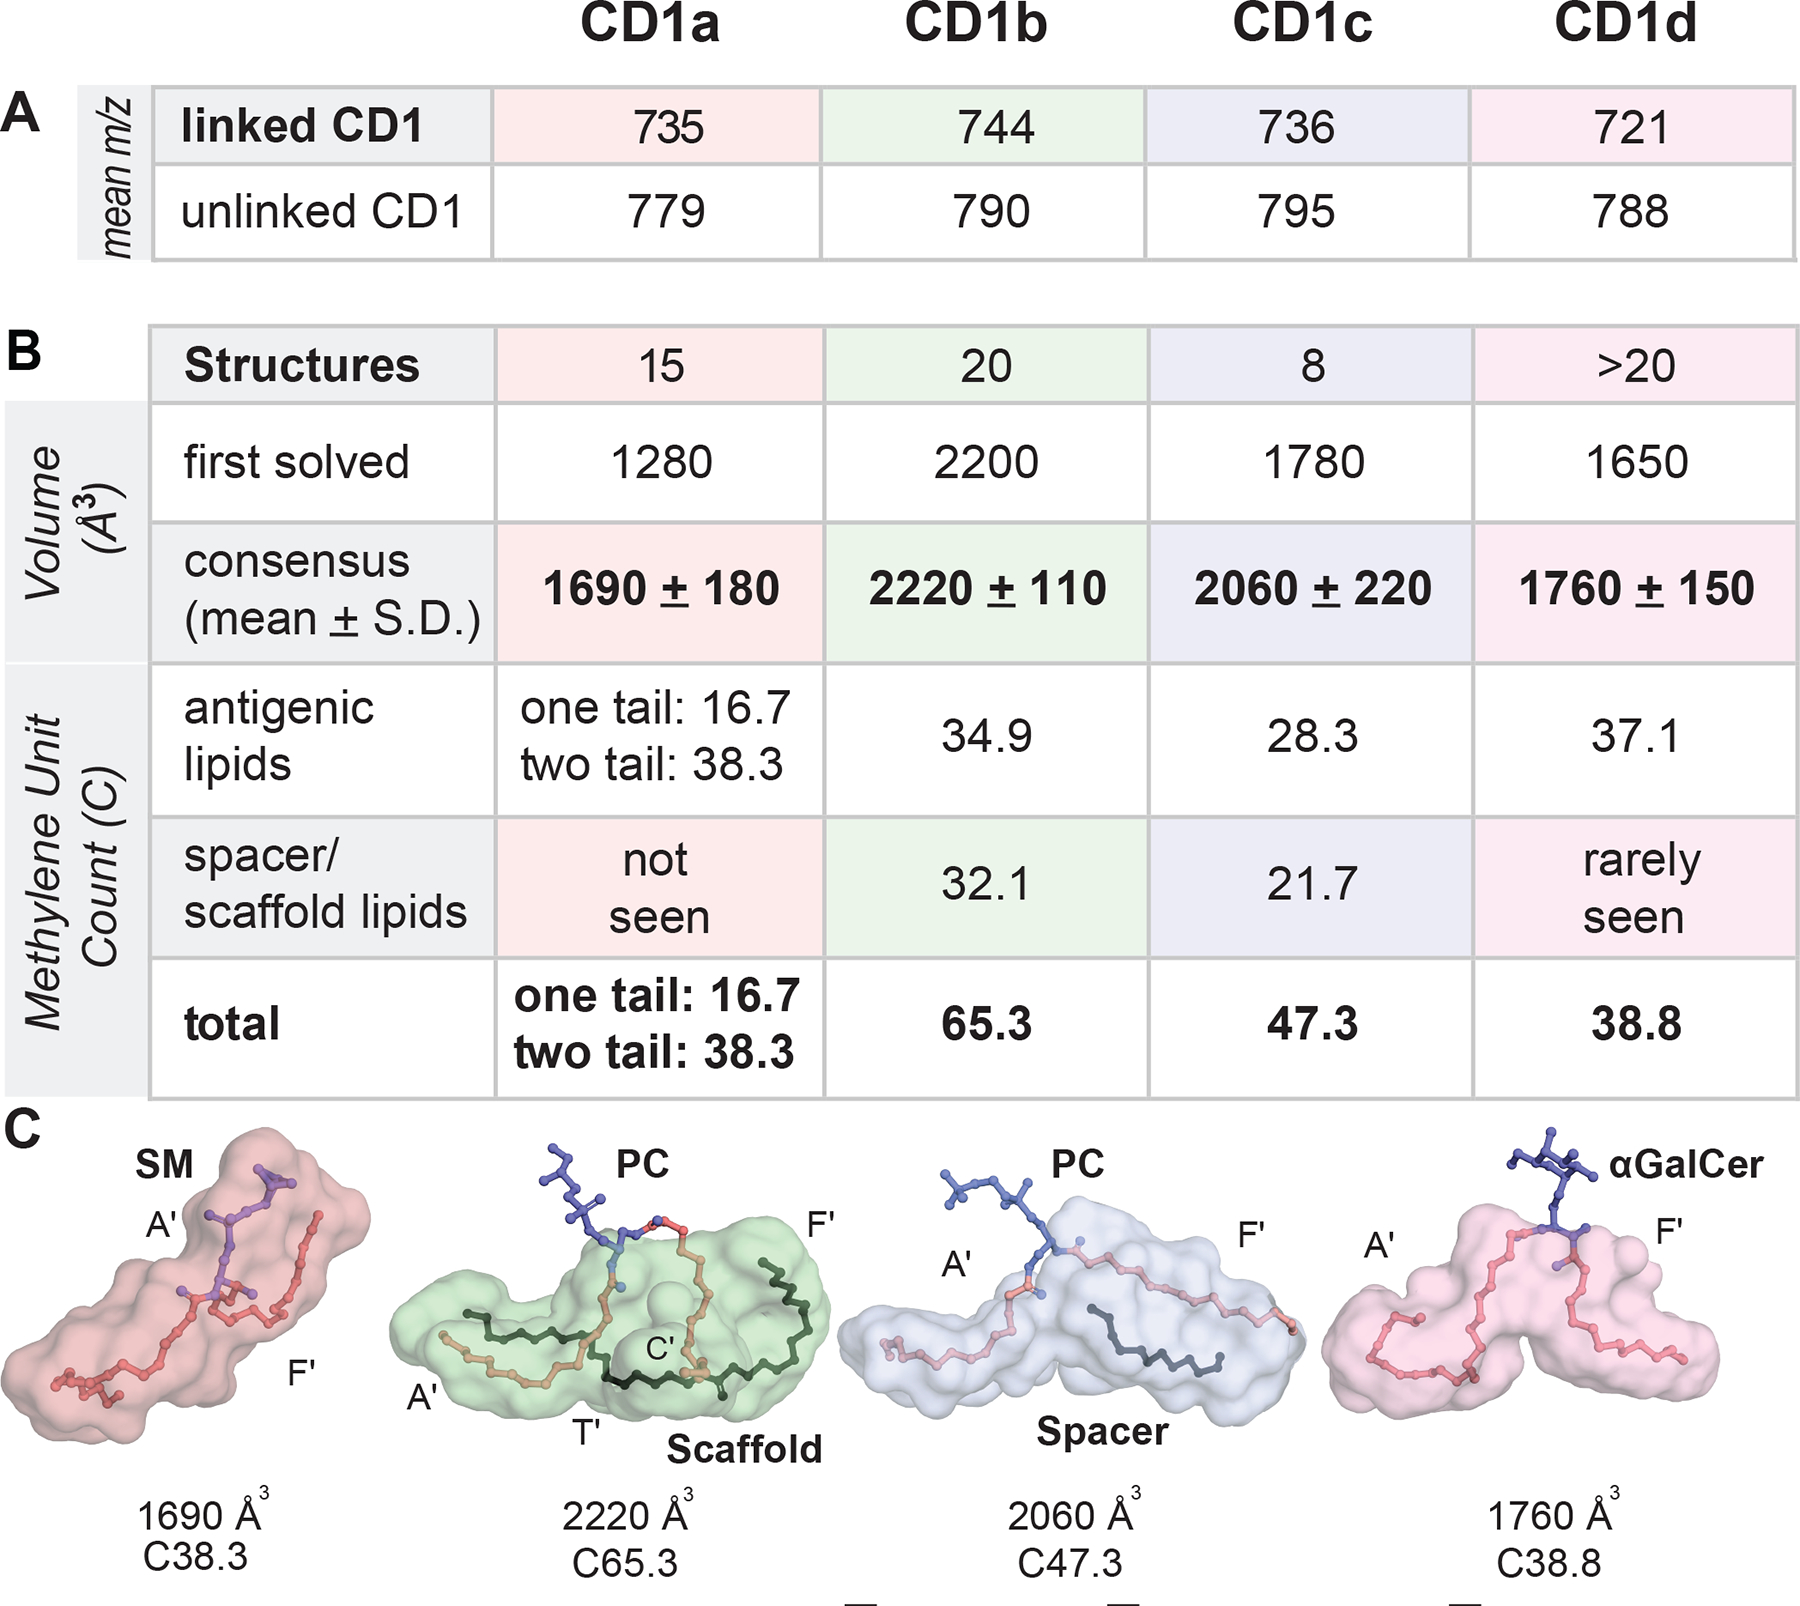
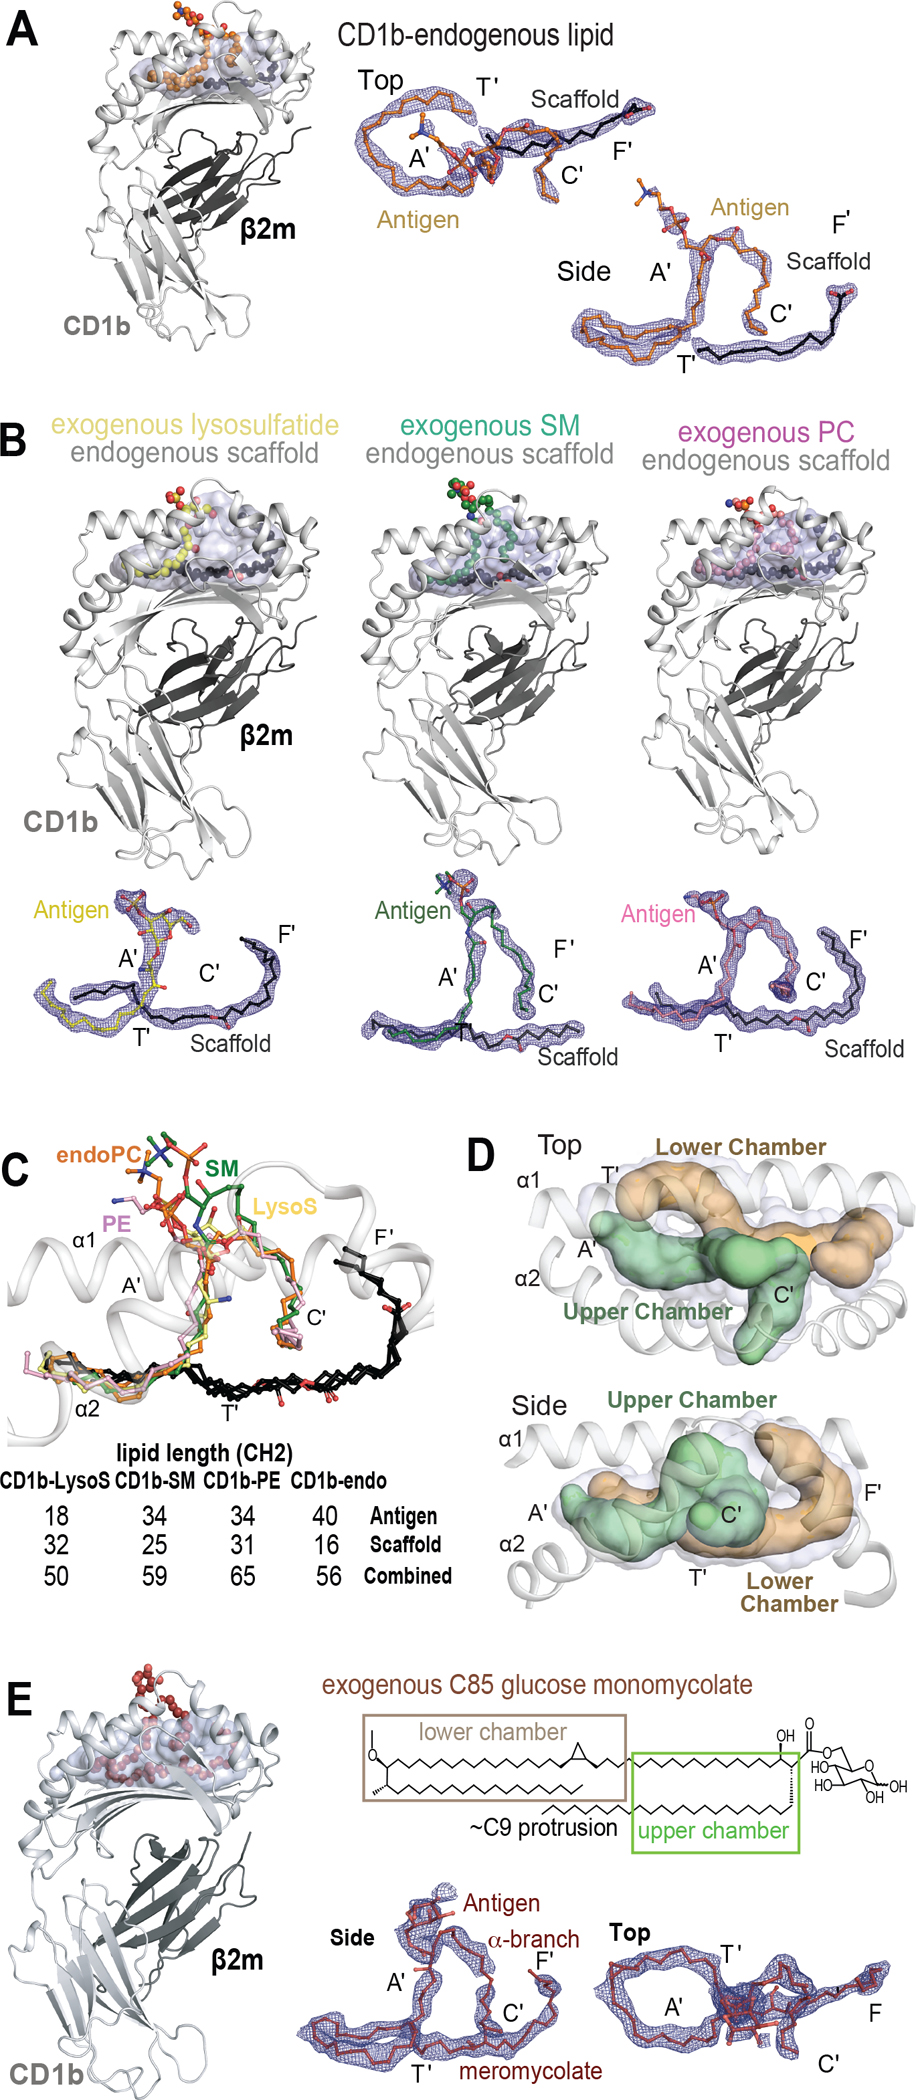
The CD1 system binds lipid antigens for display to T cells. Here, we solved lipidomes for the four human CD1 antigen-presenting molecules, providing a map of self-lipid display. Answering a basic question, the detection of >2,000 CD1-lipid complexes demonstrates broad presentation of self-sphingolipids and phospholipids. Whereas peptide antigens are chemically processed, many lipids are presented in an unaltered form. However, each type of CD1 protein differentially edits the self-lipidome to show distinct capture motifs based on lipid length and chemical composition, suggesting general antigen display mechanisms. For CD1a and CD1d, lipid size matches the CD1 cleft volume. CD1c cleft size is more variable, and CD1b is the outlier, where ligands and clefts show an extreme size mismatch that is explained by uniformly seating two small lipids in one cleft. Furthermore, the list of compounds that comprise the integrated CD1 lipidome supports the ongoing discovery of lipid blockers and antigens for T cells.

Keywords: CD1; T cell receptor; T cells; antigen presentation; antigen processing; dendritic cells; lipidomics; major histocompatibility complex; sphingolipids.


Conflict of interest statement

Declaration of interests The authors hold intellectual property through the Massachusetts General Brigham (D.B.M., G.S.O., and J.R.; filing 29618-0390P01) and the University of Oxford (G.S.O., C.S.H., and Y.-L.C.; filings 2116709.3, 2217923.8, 2217924.6). G.S.O. collaborates with UCB and Janssen, and D.B.M. consults for Pfizer.

Figures

Figure 1.
Figure 1.. A human CD1-lipidome.
A) Human CD1 and MHC (HLA-B27, Macaca mulatta A01) heavy chain genes were expressed with strep tag II (strep II), birA substrate peptide 85 (bsp85), polyhistidine tags, zippers, or peptide linkers for β2-microglobulin (β2-m). Extracellular secreted complexes were extracted to detect bound lipids via HPLC-MS-QToF-MS-based lipidomics. B) To measure media-derived lipids, K562 cells expressing CD1c or CD1d proteins were cultured with deuterated SM (m/z 733.759) or PC (m/z 790.769), followed by HPLC-MS detection of endogenous SM (m/z 702.568) and PC (m/z 759.577). C) Representative CD1a eluents analyzed in positive mode show discrete, countable ion chromatograms with linked m/z, retention time and intensity values. D) Extracted ion chromatograms of standards serve as benchmarks to identify lipids and illustrate the detection of increasingly polar lipid ligands during the run.
Figure 2.
Figure 2.. Scope of the human CD1 lipidome and patterns of CD1 isoform specificity.
A) To determine non-specific lipid adherence to proteins, events with equivalent m/z and retention time values generate intensity ratios for lipids eluted from CD1 protein versus equivalently sized MHC proteins, which lack lipid binding clefts. B) The total number of CD1-associated features was corrected to remove events with characteristics of false positive or redundant detection of isotopes, alternate adducts and ion finding artifacts, yielding the number of unique events associated with each CD1 protein. C) Analysis of the linked and unlinked CD1 lipidomes yielded similar patterns for the number of ligands bound to each CD1 protein and similar percentages of lipids binding to 1, 2, 3 or 4 isoforms. Results in A-C are representative of two experiments for each protein set.
Figure 3.
Figure 3.. Influence of cell type and CD1 transmembrane tethering on lipidomic outcomes.
A) Total extracted lipids were compared to determine the percent lipidomic overlap by cell type. B) Cellular lipids were extracted in chloroform and methanol. CD1a proteins with a truncated transmembrane domain (secreted) were secreted into media. Transmembrane tethered CD1a was released into media by cleavage (cleaved) with human rhinovirus 3C protease. After captured with nickel or streptactin, CD1a-eluted lipids were subjected to MS analysis to detect SM/PC ratios, showing that CD1a captures a higher ratio compared to cellular lipids as reported previously. C) CD1b proteins with intact transmembrane and cytoplasmic tail sequences encoding a four-residue tyrosine containing (YXXZ) motif that directs endosomal recycling in THP-1 cells and K562 cells were released by TEV protease and captured with nickel and streptactin, following by elution of lipids analyzed in comparison to a mass normalized preparation of secreted CD1b proteins. Eluted PCs and SMs (length: saturation) were detected as ion chromatograms (C) and quantitated in by determining replicate chromogram areas (D). Results in (A-D) are representative of two experiments in each indicated cell type.
Figure 4.
Figure 4.. Annotating compounds binding to all four human CD1 isoforms.
A) The indicated chemical assignments derive from co-elution with standards (Figure 1D) and matching detected mass values to diacylglycerol (m/z 612.557), triacylglycerol (m/z 812.691), hexosylceramide (m/z 810.681), dihexosylceramide (m/z 972.734), cardiolipin (CL, m/z 1419.002), ether-phosphatidylethanolamine (EPE, m/z 728.557), PE (m/z 768.552), lyso-phosphatidylethanolamine (LPE, m/z 566.416), lyso-PC (LPC, m/z 608.465), EPC (m/z 746.606), PC (m/z 760.585), or SM (m/z 813.685), as well as CID-MS that detected diagnostic fragments (Figure S2). B) For example, the unknown at m/z 746.622 matched the mass of an ether-PC, and CID revealed neutral loss of phosphatidylcholine (m/z 563.540) and C16 or C18:1 fatty acyl units (m/z 339.279, 482.360). C) Plotting events yields clusters, where recognizable mass intervals identified 25 EPCs with the indicated total chain length (colors), with varied saturation that influences retention. D) Repeating this process, clusters were solved as the indicated molecules, where unsaturation positions are inferred.
Figure 5.
Figure 5.. Chemical determinants of capture by individual CD1 isoforms.
A) Principle components analysis of differentially abundant lipids (Benjamini Hochberg adjusted p < 0.05 based on F-statistic) determines lipid patterns released from linked (K562 cells) or unlinked (293T cells) CD1 proteins. B) Bubble plot of 70 lipids with significantly different abundance in both data sets (adjusted p < 0.05) showed isoform specific capture of lipids based on lipid subclass, length and saturation. C) After normalizing signal intensity for each named lipid to total PC, named lipids in eluents from each CD1 protein are reported using total lipid signal (dotted line) as the background value. D) After initial studies detected mono- and di-hexosyl ceramides, their identification as β-glucosyl ceramide, β-galactosyl ceramide and lactosyl ceramide was accomplished based on co-elution with standards and the indicated CID-MS fragments (Figure S2K–L). CD1d-specific binding of three long chain self sphingolipids identified here have anchors (red) that chemically resemble known foreign long glycolipids presented by CD1d.
Figure 6.
Figure 6.. Measurements of CD1 cleft volume.
A) Mean m/z values of lipids eluted from each CD1 isoform are shown. B-C) Volume (Å3) calculations for the first solved structures of each human isoform were reported using differing modeling assumptions. Consensus values derive from reanalyzing these four structures and 56 subsequently solved structures a uniform method (Table S3). The mean number of methylene units (CH2) in was calculated gtom structures with single or double tailed antigens (CD1a), and with the combined size of antigens, spacer and scaffold lipids (CD1b, CD1c, CD1d). Cleft surface traces depict the volume (Å3), as well as the number of methylene units in lipid tails within each CD1 isoform cleft.
Figure 7.
Figure 7.. Upper and lower chambers of CD1b.
A) Structural overviews of CD1b carrying endogenous lipids (CD1b-endo) shows densities corresponding to the antigenic (orange) and a spacer lipid (black). B) CD1b-endo complexes were treated with SM (green), phosphatidylethanolamine (pink), or lysosulfatide (yellow). Electron density maps (contoured to 0.9 σ) demonstrate seating of antigenic (colored) lipids in the upper chamber that overlaps with the A’ and C’ pockets, whereas scaffold lipids reside in the lower chamber that overlaps with the T’ and F’ pockets. (C) Overlay of CD1b-endo complexes, including those treated with exogenous antigens, shows similar positioning of antigens (colors) and scaffolds (black). For exogenous lipids, chain lengths were known from the molecules added, which also matched the size of the observed density. D) The upper chamber (green) holds the antigenic lipid and the lower chamber (brown) contains the scaffold lipid. E) CD1b solved in complex with C85 GMM, which contains a C26 α-branch and a C59 meromycolate chain. The density corresponds to a C76 lipid, suggesting that the α-branch protrudes (C9 protrusion). Viewed from above, the meromycolate chain threads clockwise in the A’ pocket and couterclockwise in the A’T’ junction. The path of the exogenous mycolate lipid (E) is similar to the threaded position of two self-lipids seen in CD1b-endo and CD1b-antigen structures in (B-C).

References

    1. Garboczi DN, Ghosh P, Utz U, Fan QR, Biddison WE, Wiley, and DC (1996). Structure of the complex between human T-cell receptor, viral peptide and HLA-A2. Nature 384, 134–141. - PubMed
    1. Garcia KC, Degano M, Stanfield RL, Brunmark A, Jackson MR, Peterson PA, Teyton L, and Wilson IA (1996). An alphabeta T cell receptor structure at 2.5 A and its orientation in the TCR-MHC complex. Science 274, 209–219. - PubMed
    1. Beckman EM, Porcelli SA, Morita CT, Behar SM, Furlong ST, and Brenner MB (1994). Recognition of a lipid antigen by CD1-restricted àá T cells. Nature 372, 691–694. - PubMed
    1. Zeng Z, Casta AR, Segelke BW, Stura EA, Peterson PA, and Wilson IA. (1997). Crystal structure of mouse CD1: an MHC-like fold with a large hydrophobic binding groove. Science 277, 339–345. - PubMed
    1. Fowlkes BJ, Kruisbeek AM, Ton-That H, Weston MA, Coligan JE, Schwartz RH, and Pardoll DM (1987). A novel population of T-cell receptor alpha beta-bearing thymocytes which predominantly expresses a single V beta gene family. Nature 329, 251–254. - PubMed

Publication types

LinkOut - more resources