. 2023 Oct 11;31(10):1700-1713.e4.
doi: 10.1016/j.chom.2023.08.016. Epub 2023 Sep 18.

IκBζ is an essential mediator of immunity to oropharyngeal candidiasis

Affiliations

IκBζ is an essential mediator of immunity to oropharyngeal candidiasis

Tiffany C Taylor et al. Cell Host Microbe. .

Abstract

Fungal infections are a global threat; yet, there are no licensed vaccines to any fungal pathogens. Th17 cells mediate immunity to Candida albicans, particularly oropharyngeal candidiasis (OPC), but essential downstream mechanisms remain unclear. In the murine model of OPC, IκBζ (Nfkbiz, a non-canonical NF-κB transcription factor) was upregulated in an interleukin (IL)-17-dependent manner and was essential to prevent candidiasis. Deletion of Nfkbiz rendered mice highly susceptible to OPC. IκBζ was dispensable in hematopoietic cells and acted partially in the suprabasal oral epithelium to control OPC. One prominent IκBζ-dependent gene target was β-defensin 3 (BD3) (Defb3), an essential antimicrobial peptide. Human oral epithelial cells required IκBζ for IL-17-mediated induction of BD2 (DEFB4A, human ortholog of mouse Defb3) through binding to the DEFB4A promoter. Unexpectedly, IκBζ regulated the transcription factor Egr3, which was essential for C. albicans induction of BD2/DEFB4A. Accordingly, IκBζ and Egr3 comprise an antifungal signaling hub mediating mucosal defense against oral candidiasis.

Keywords: Candida albicans; IL-17 signaling; cytokines; defensins; oral epithelium; signal transduction.


Conflict of interest statement

Declaration of interests The authors declare no competing interests.

Figures

Figure 1.
Figure 1.. IκBζ is induced by IL-17 in OPC
(A) The stratified oral epithelium and cytokine receptor localization. (B) Timeline of oral C. albicans infection procedure. (C) Heat map of TF mRNAs upregulated in tongues from WT mice (Nfkbiz+/+ animals obtained from breeding colonies) or Il17ra−/− mice on day 2 p.i. Data derived from published RNA-Seq data (n= 2 or 3) (D) The indicated mice were subjected to OPC and RNA extracted from tongue at day 2. Nfkbiz levels were assessed by qPCR normalized to Gapdh. Data are mean ± SEM, analyzed by ANOVA with Tukey’s multiple comparisons test. (E) Top: Tongue homogenates from WT and Il17ra−/− mice isolated 2 days p.i. were immunoblotted for IκBζ and β-actin. Size markers are shown. Bottom: Densitometry analysis normalized to β-actin (n=3). Data are mean ± SEM, analyzed by 1-way ANOVA with Tukey’s multiple comparisons test. (F) Top: TR146 cells were treated ± IL-17 (100 ng/ml) for the indicated times and immunoblotted for IκBξ and β-actin. Bottom: Densitometry analysis normalized to β-actin (n=3). Data are from 3 independent experiments. Data are mean ± SEM, analyzed by 1-way ANOVA with Tukey’s multiple comparisons test.
Figure 2.
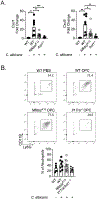
Figure 2.. IκBζ in non-hematopoietic cells protects against OPC
(A) The indicated mice were treated with TAM on days −12 to −8, rested for 7-9 d, and infected orally with C. albicans. Fungal loads were assessed on days 4-5. Data show geometric mean of CFU/g tongue homogenates, analyzed by ANOVA with Dunn’s multiple comparisons test. The percentage of mice per cohort with a detectable fungal load is shown. Weight loss is shown as percentage of starting weight, analyzed by 2-way ANOVA with Tukey’s multiple comparisons test. Pooled from 2 independent experiments. (B, C) Expression of indicated genes in tongue was assessed by qPCR normalized to Gapdh. Data are ± SEM relative to WT untreated mice, analyzed by ANOVA with Tukey’s multiple comparisons test. (D) The indicated mice were subjected to OPC and cells from tongue harvested at day 2 were analyzed by flow cytometry. Left: Representative plot showing percentage of CD11b+ Ly6G+ cells in neutrophils (gated on live, CD45+ cells). Right: Data compiled from two independent experiments. (E) Bone marrow from indicated donors was transferred into irradiated recipients (KO = NfkbizR26ERT2). After 6 weeks, recipients were given TAM on days −12 to −8, subjected to OPC, and fungal burden assessed on day 5. Data show geometric mean, analyzed by ANOVA with Dunn’s multiple comparisons test. Data pooled from two independent experiments, analyzed by ANOVA test with Dunn’s multiple comparison test.
Figure 3.
Figure 3.. IκBζ functions within the oral epithelium
(A, B) The indicated mice were infected orally with C. albicans. Fungal loads, percentage of mice with detectable fungal loads, and weight loss were assessed on day 5 (A) or day 10 (B). Data were pooled from 3 independent experiments. (C) The indicated mice were treated with TAM on days −12 to −8, rested for 7 d, and infected orally with C. albicans. Fungal loads, percent of mice with detectable fungal loads, and weight loss were assessed on day 5. Throughout: Bars show geometric mean. Data were analyzed by ANOVA with Dunn’s multiple comparison test. Weight loss was analyzed by 2-way ANOVA with Tukey’s multiple comparison test.
Figure 4.
Figure 4.. IκBζ in the SEL regulates β-defensins
(A) WT and NfkbizK13 were infected orally with C. albicans, and fungal loads assessed on day 2. Data show geometric mean, analyzed by ANOVA with Tukey’s multiple comparison test. Data pooled from 3 independent experiments. (B) RNA-seq data (n=3) from C. albicans-infected tongues of WT and NfkbizK13 mice on day 2 was analyzed by Partek pathway analysis. (C) Comparison of transcriptional responses induced in tongue during OPC from WT and NfkbizK13 mice on day 2. (D) Defb3 was assessed by qPCR normalized to Gapdh. Data are mean ± SEM relative to WT untreated mice, analyzed by ANOVA with Tukey’s multiple comparisons test. (E) TR146 cells transfected with indicated siRNAs targeting were treated with IL-17 and DEFB4A was assessed by qPCR normalized to GAPDH. Data are as fold-increase compared to untreated (time 0), analyzed by ANOVA with Dunn’s multiple comparison test. (F) Supernatants from TR146 samples from panel D were analyzed for human BD2 by ELISA. Data are mean ± SEM, analyzed by ANOVA with Holm-Sidak’s multiple comparisons test. (G) Top: Diagram of predicted TF binding sites in DEFB4A proximal promoter. Bottom: TR146 cells were treated ± IL-17 (100 ng/ml) for 4 h and subjected to ChIP with anti-IκBξ Abs or IgG control. Indicated promoter regions were analyzed by PCR, normalized to input. Data are mean ± SEM of three independent experiments. Data analyzed pairwise by Student’s t test. (H) Comparison of transcriptional responses induced in tongue during OPC from WT and Defb3−/− mice on day 1. Data are from 3 mice.
Figure 5.
Figure 5.. IκBζ in the SEL does is not required for neutrophil recruitment in OPC
(A) WT and NfkbizK13 mice were subjected to OPC. On day 2, Cxcl1 and Cxcl5 were assessed by qPCR normalized to Gapdh. Data are presented as mean ± SEM normalized to WT untreated mice, analyzed by ANOVA with Tukey’s multiple comparisons test. (B) Cells from tongue harvested at day 2 p.i. were stained with the indicated Abs and analyzed by flow cytometry. Left: Representative plot showing percentage of CD11b+ Ly6G+ cells in neutrophils (gated on live, CD45+ cells). Right: Data pooled from two independent experiments, analyzed by ANOVA with Tukey’s multiple comparisons test.
Figure 6.
Figure 6.. Egr3 regulates β-defensins in OECs
(A) Heatmap of differentially expressed transcription factor genes in WT (Nfkbizfl/fl littermates) or NfkbizK13 mice (n=3) on day 2. Red asterisk highlights TFs examined in this study. (B) Top: Tongue homogenates from infected WT and Il17ra−/− mice on day 2 were probed for EGR3 or β-actin. Bottom: Densitometry analysis normalized to β-actin, analyzed using ANOVA with Tukey’s multiple comparisons test (Note: these data are from same experiment as Figure 1e, so the β-actin loading control is repeated). (C) TR146 cells were transfected with the indicated siRNAs, treated ± IL-17 and EGR3 assessed by qPCR normalized to GAPDH. Data are fold-increase compared to untreated (time 0), analyzed by ANOVA with Dunn’s multiple comparisons test. (D) TR146 cells were co-cultured with PBS or C. albicans (MOI = 10) for the indicated times. EGR3 was assessed by qPCR normalized to GAPDH and presented as fold-increase compared to untreated cells (time 0) and analyzed by ANOVA. (E) TR146 cells were transfected with the indicated siRNAs, treated ± IL-17 and DEFB4A assessed by qPCR normalized to GAPDH. Data are fold-increase compared to untreated (time 0), analyzed by ANOVA with Dunn’s multiple comparisons test. (F) Supernatants from samples in panel E were analyzed for human BD2 by ELISA and analyzed by ANOVA with Holm-Šídák's multiple comparisons test (G) Top: Diagram of predicted TF binding sites in DEFB4A proximal promoter. Bottom: TR146 cells were treated ± IL-17 (100 ng/ml) for 4 h and subjected to ChIP with anti-EGR3 Abs or IgG control. Indicated promoter regions were analyzed by PCR, normalized to input. Data are mean ± SEM of three independent experiments. Data analyzed pairwise by Student’s t test.
Figure 7.
Figure 7.. EGR3 responses in oral candidiasis
(A) TR146 cells were infected with the indicated strains of C. albicans (MOI = 10) for 4 h and EGR3 levels were assessed by qPCR, normalized to GAPDH, analyzed by ANOVA with Tukey’s multiple comparisons test. Representative of three independent experiments. Diagram of C. albicans virulence components and interactions with oral epithelium. (B, C) TR146 cells were transfected with indicated siRNAs and infected with C. albicans for 4 h. Indicated mRNAs were analyzed by qPCR normalized to GAPDH, analyzed by Mann Whitney U. Data were pooled from four independent experiments.

Comment in

References

    1. Brown GD, Denning DW, Gow NA, Levitz SM, Netea MG, and White TC (2012). Hidden killers: human fungal infections. Sci Transl Med 4, 165rv113. 10.1126/scitranslmed.3004404. - DOI - PubMed
    1. Lionakis MS, and Levitz SM (2018). Host Control of Fungal Infections: Lessons from Basic Studies and Human Cohorts. Annual Rev Immunol 36, 157–191. 10.1146/annurev-immunol-042617-053318. - DOI - PubMed
    1. Becker KL, Ifrim DC, Quintin J, Netea MG, and van de Veerdonk FL (2015). Antifungal innate immunity: recognition and inflammatory networks. Semin Immunopathol 37, 107–116. 10.1007/s00281-014-0467-z. - DOI - PubMed
    1. Fidel PL Jr. (2011). Candida-Host Interactions in HIV Disease: Implications for Oropharyngeal Candidiasis. Adv Dent Res 23, 45–49. 23/1/45 [pii] 10.1177/0022034511399284. - DOI - PMC - PubMed
    1. Gaffen SL, and Moutsopoulos N (2020). Regulation of host-microbe interactions at oral mucosal barriers by type 17 immunity. Sci Immunol 5, eaau4594. - PMC - PubMed

Substances