Review
. 2023 Oct 12;12(1):012001.
doi: 10.1088/2050-6120/acfb58.

A new twist on PIFE: photoisomerisation-related fluorescence enhancement

Affiliations
Review

A new twist on PIFE: photoisomerisation-related fluorescence enhancement

Evelyn Ploetz et al. Methods Appl Fluoresc. .

Abstract

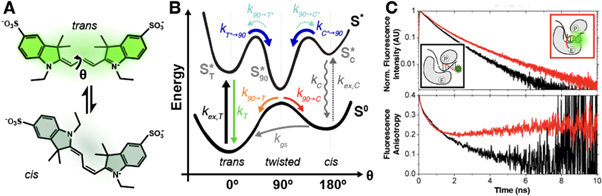
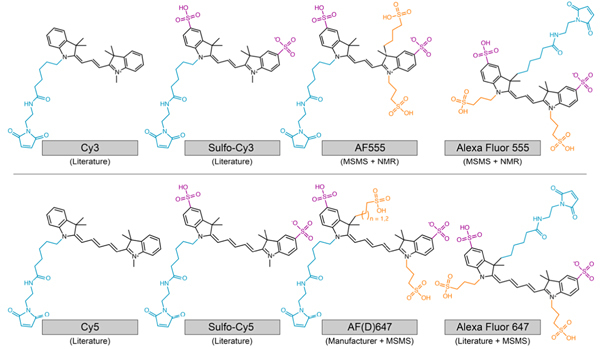
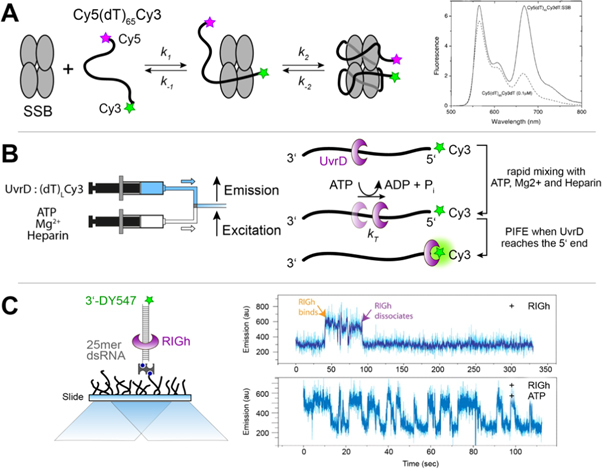
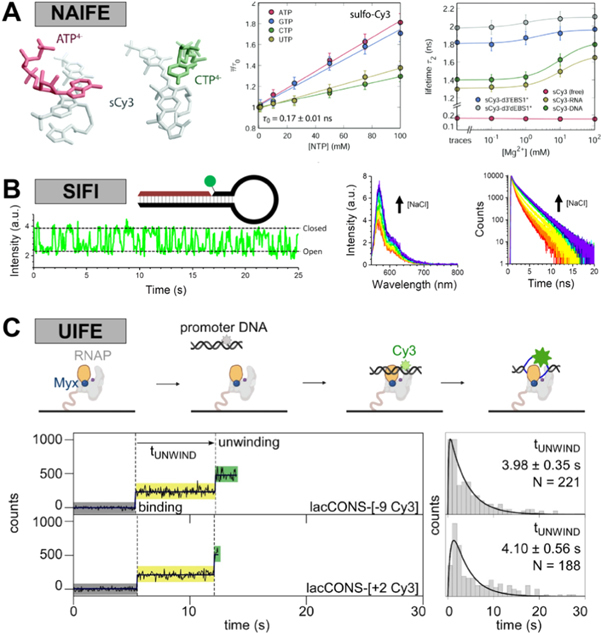
PIFE was first used as an acronym for protein-induced fluorescence enhancement, which refers to the increase in fluorescence observed upon the interaction of a fluorophore, such as a cyanine, with a protein. This fluorescence enhancement is due to changes in the rate ofcis/transphotoisomerisation. It is clear now that this mechanism is generally applicable to interactions with any biomolecule. In this review, we propose that PIFE is thereby renamed according to its fundamental working principle as photoisomerisation-related fluorescence enhancement, keeping the PIFE acronym intact. We discuss the photochemistry of cyanine fluorophores, the mechanism of PIFE, its advantages and limitations, and recent approaches to turning PIFE into a quantitative assay. We provide an overview of its current applications to different biomolecules and discuss potential future uses, including the study of protein-protein interactions, protein-ligand interactions and conformational changes in biomolecules.

Keywords: PIFE; biophysics; fluorescence spectroscopy; photoisomerisation; single-molecule.


Figures

Figure 1.
Figure 1.
PIFE concepts. (A) Molecular structure of the cyanine dye sCy3 as trans (top) and cis isomer (bottom). Isomerisation along the polymethine chain modulates the fluorescence of sCy3. (B) Energy diagram of sCy3 as a function of the rotation coordinate θ in the trans (0o) and cis (180o) state. Upon excitation into the excited trans state (ST*), deactivation occurs upon internal conversion and fluorescence (summarized by the decay rate k T) or by isomerisation (k T*→90) into the twisted state (90o). The excited cis state (SC*) decays via internal conversion to the cis ground-state with a decay rate (k C) or by isomerisation (k C*→90). From the excited-state minimum in the twisted state, sCy3 forms the trans and cis ground-state with rates k 90→T or k 90→C, respectively. In the ground-state, the reconversion from cis to trans isomer is again thermally driven with a rate kgs. Adapted from Lerner, Ploetz et al. [18] under the terms of the Creative Commons CC-BY License 4.0. (C) Using smPIFE at the single-molecule level allows, for example, monitoring the position of a Cy3-labelled dsDNA construct outside (black) and inside (red) a Klenow fragment via time-resolved fluorescence (top) and anisotropy (bottom). The transition of the primer to the exonuclease site pulls the Cy3-labelled fragment from a solvent-exposed to protein-surrounded position, leading to a change in environment detected by PIFE. License: C) Adapted with permission from {Stennett E M S, Ciuba M A, Lin S and Levitus M 2015 Demystifying PIFE: The Photophysics Behind the Protein-Induced Fluorescence Enhancement Phenomenon in Cy3 The Journal of Physical Chemistry Letters 6 1819–23} [19]. Copyright {2015} American Chemical Society.
Figure 2.
Figure 2.
Confirmed chemical structures of cyanine dyes (Cy-, Alexa Fluor-, and the AF-series) frequently used for biological applications. Please note that the AF-dye homologs of Cy5 are available in two distinct versions called AFD647 (n = 1) and AF647 (n = 2). Formerly unpublished structures were confirmed by NMR and MS/MS [34]. To highlight structural differences compared to the parental cyanine fluorophore, we coloured linkers for labelling, e.g., via maleimide groups in blue, sulfo-groups in purple and sulfonated alkyl groups in orange. Please note that linkers for other types of dyes might differ in length.
Figure 3.
Figure 3.
Pioneering work using PIFE for probing the interaction between proteins and nucleic acids. (A) The interaction between the tetrameric single-strand binding protein (SSB) and ssDNA leads to a 1:1 complex. Since the ssDNA is labelled with Cy5 and Cy3 at the 5’- and 3’-ends, respectively, complex formation is observed by a shortening of the inter-dye distance, leading to FRET between both dyes and an increase in brightness in Cy3 due to PIFE. (B) Translocation of the UvrD protein along ssDNA from the 3’- to 5’-end can be probed using stopped-flow experiments via the enhancement of the Cy3 fluorescence intensity once it reaches the 5’-end. (C) Binding and translocation of the RIGh-I protein to single-stranded RNA was probed at the single-molecule level by TIRF microscopy and observed via fluorescence fluctuations in an ATP-dependent manner. Licenses: (A) Adapted with permission from {Kozlov A G and Lohman T M 2002 Stopped-Flow Studies of the Kinetics of Single-Stranded DNA Binding and Wrapping around the Escherichia coli SSB Tetramer Biochemistry 41 6032–44} [4]. Copyright {2002} American Chemical Society; (C) Adapted with permission from Reference [6].
Figure 4.
Figure 4.
Methods inspired by and related to PIFE. (A) Nucleic acid-induced fluorescence enhancement (NAIFE). Interactions with nucleic acids lead to fluorescence enhancement of Cy3. (B) Stacking-induced fluorescence increase (SIFI). Stacking of Cy3 in a nick, gap or overhang of DNA leads to an increase in fluorescence intensity and lifetime. (C) Unwinding-induced fluorescence enhancement (UIFE). The unwinding of a dsDNA and bubble formation inside the bacterial RNA polymerase during transcription initiation can be investigated by labelling the nucleic acid with Cy3. Binding and melting of the DNA leads to contact between Cy3 and the RNAP and to an increase in fluorescence. Licenses: (A) Reproduced from [75] with permission from the PCCP Owner Societies; (B) Reproduced from [93] under the terms of a Creative Commons CC-BY 4.0 license. (C) Reproduced from Mazumder et al, 2021, eLife [74] with permission, published under the Creative Commons Attribution 4.0 International Public License (CC BY 4.0; https://creativecommons.org/licenses/by/4.0/). Further reproduction of this panel would need permission from the copyright holder.
Figure 5.
Figure 5.
Photophysical measurements and computational modelling of NAIFE. (A) Photoisomerisation of cyanine dyes is reduced by stacking on nucleobases and interaction with secondary and tertiary structure elements of RNA. (B) The average fluorescence lifetime,τ , is modulated depending on the degree of dye-RNA interaction. (C) The rotational correlation time, τ r , and the residual anisotropy, r , reflect the motional restriction of the dye by the RNA. (D) Surface trapping is modelled by the accessible contact volume (ACV). (E) An atomic-level description of dye-RNA contacts is provided by in-silico labelling and subsequent (F) molecular dynamics simulations. Licenses: (A) Adapted from [75] with permission from the PCCP Owner Societies, and, (B-F) from [89] under the terms of a Creative Commons CC-BY 4.0 license.
Figure 6.
Figure 6.
Chemical structures of restrained cyanine dyes. The chemical structures of the rigidified cyanine dyes (A) Cy3B and (B) Cy5B lack a flexible polymethine chain and do not show any fluorescence-modulating cis/trans isomerisation. The chemical structures of the unrestricted sulfo-Cy dyes are highlighted in color.
Figure 7.
Figure 7.
Choosing the labelling site for the PIFE experiment. As an example, the binding reaction of a 93-residue bacterial DNA-binding protein domain (brown) to DNA (grey) is shown. The snapshot of the DNA-protein complex is generated by CafeMol, a coarse-grained simulation package[123]. (A) The AV of the dye in a free or ‘reference’ state is displayed by the green surface, while the dye attachment site (dT) on the DNA is indicated by the inner dark sphere. (B) The AV of dye in the bound or ‘PIFE’ state is reduced by the presence of the bound protein, which will likely result in detectable PIFE. (C) The comparison between the AV of the free and bound states (cf. panels A and B) reveals a volume difference of 23% - represented by the grey surface.
Figure 8.
Figure 8.
Single-molecule PIFE-FRET monitored by μsALEX spectroscopy. (A)–(C) Protein-nucleic acid interaction. (A) Dye AV calculation for sCy3 attached at the 5’-end in the presence of BamHI bound to dsDNA. (B) E-S 2D histograms and (C) Stoichiometry change due to PIFE for BamHI and EcoRV bound to dsDNA as a function of the proximity of the sCy3 dye from the palindromic binding sequence. (D)–(F) Protein-protein interaction probed by PIFE-FRET between substrate-binding domains 1 and 2 of the bacterial ABC importer GlnPQ. (D) Assay for SBD2 as an isolated domain and in tandem with SBD1. (E) Working principles to probe conformations and interaction between SBD1 and SBD2 via PIFE-FRET. (F) PIFE occurs between both domains for shortened linker length in the open and substrate-bound state of SBD2. (G) Disentangling of PIFE and FRET in PIFE-FRET assays. Accurate FRET and PIFE-enhancement for BamHI and the polymerase gp5/trx and BamHI on dsDNA. Licenses: A-C,) Reprinted from Ploetz, Lerner et al [72] under the terms of an ACS AuthorChoice License. D-F) Reprinted from Ploetz, Schuurman-Wolters et al [143] under the terms of the Creative Commons CC-BY License 4.0. G) Reprinted from Lerner, Ploetz et al [18] (https://pubs.acs.org/doi/10.1021/acs.jpcb.6b03692) under the terms of the Creative Commons CC-BY License 4.0. Further permissions related to the material excerpted should be directed to the ACS.
Figure 9.
Figure 9.
Probing PIFE within bursts in single-molecule fluorescence experiments. (A) Divisor-approach for analysing within-burst fluorescence lifetime dynamics. (B) MpH2MM analysis of the unbound α-syn monomer labelled at positions 26 and 56 with sCy3 provides histograms of mean nanotimes of state dwells. License: Reprinted from Harris PD & Lerner E, ‘Identification and quantification of within-burst dynamics in singly labelled single-molecule fluorescence lifetime experiments’, 2:100071, Copyright (2022) [146], with permission from Elsevier.

Update of

References

    1. Lakowicz J R. Principles of Fluorescence Spectroscopy. New York, NY: Springer; 2006.
    1. Valeur B, Berberan-Santos M N. Molecular Fluorescence: Principles and Applications. Wiley; 2012.
    1. Borisov S M, Wolfbeis O S. Optical Biosensors. Chem. Rev. 2008;108:423–61. doi: 10.1021/cr068105t. - DOI - PubMed
    1. Kozlov A G, Lohman T M. Stopped-flow studies of the kinetics of single-stranded DNA binding and wrapping around the Escherichia coli SSB tetramer. Biochemistry. 2002;41:6032–44. doi: 10.1021/bi020122z. - DOI - PubMed
    1. Luo G, Wang M, Konigsberg W H, Xie X S. Single-molecule and ensemble fluorescence assays for a functionally important conformational change in T7 DNA polymerase. Proc. Natl Acad. Sci. 2007;104:12610–5. doi: 10.1073/pnas.0700920104. - DOI - PMC - PubMed

MeSH terms

LinkOut - more resources