. 2023 Sep 19;14(1):5820.
doi: 10.1038/s41467-023-41499-w.

Network controllability of structural connectomes in the neonatal brain

Affiliations

Network controllability of structural connectomes in the neonatal brain

Huili Sun et al. Nat Commun. .

Abstract

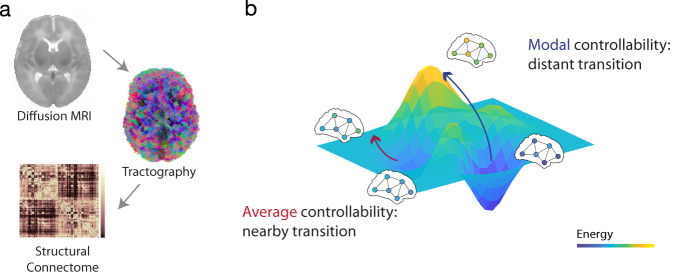
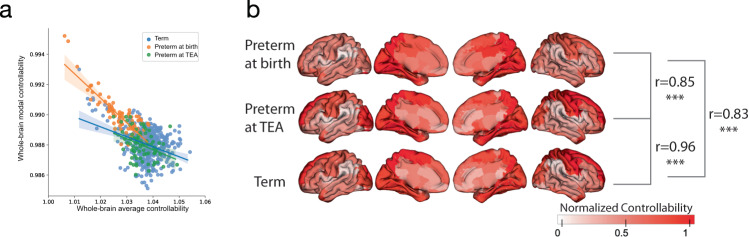
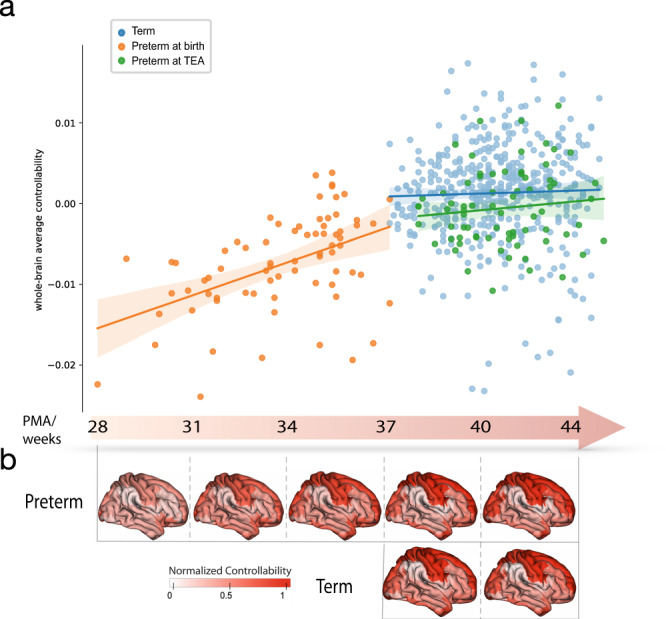
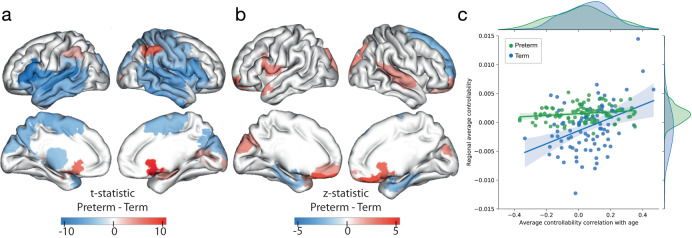
White matter connectivity supports diverse cognitive demands by efficiently constraining dynamic brain activity. This efficiency can be inferred from network controllability, which represents the ease with which the brain moves between distinct mental states based on white matter connectivity. However, it remains unclear how brain networks support diverse functions at birth, a time of rapid changes in connectivity. Here, we investigate the development of network controllability during the perinatal period and the effect of preterm birth in 521 neonates. We provide evidence that elements of controllability are exhibited in the infant's brain as early as the third trimester and develop rapidly across the perinatal period. Preterm birth disrupts the development of brain networks and altered the energy required to drive state transitions at different levels. In addition, controllability at birth is associated with cognitive ability at 18 months. Our results suggest network controllability develops rapidly during the perinatal period to support cognitive demands but could be altered by environmental impacts like preterm birth.


Conflict of interest statement

The authors declare no competing interests.

Figures

Fig. 1
Fig. 1. Network control theory.
a Using diffusion-weighted imaging (DWI), structural connectomes were created from automatic fiber tracking for 521 infants. From these connectomes, average and modal controllability were calculated. b Controllability represents the ease of switching between different dynamic brain states. Average controllability measures a regional capability to support nearby state transitions. Modal controllability measures a regional capability to support distant state transitions.
Fig. 2
Fig. 2. Controllability distribution of the infant’s brain.
a Negative associations between whole-brain (or, the mean controllability across every brain region for a single infant) average controllability and whole-brain modal controllability among three subgroups (Pearson’s correlation: term r = −0.37, p = 6.6e−16; preterm at birth r = −0.84, p = 8.5e−21; preterm at TEA r = −0.34, p = 0.0031; two-sided). Each dot represents the whole-brain average and modal controllability for a single infant. The shaded envelope denotes the 95% confidence interval. b Normalized regional average controllability was spatially similar across the preterm at birth, preterm at TEA infants, and term groups (Pearson’s correlation: preterm at birth vs preterm at TEA: r = 0.85, p = 5.5e−26; preterm at TEA vs term: r = 0.96, p = 1.1e−49; preterm at birth vs term: r = 0.83, p = 4.0e−24; two-sided). (*, **,*** indicates results are significant at p < 0.05, p < 0.01, and p < 0.001 for Pearson’s correlation.) Source data are provided as a Source Data file.
Fig. 3
Fig. 3. Controllability development during the perinatal period.
a Average controllability changes more rapidly between 28 and 36 weeks and begins to level out around birth (Pearson’s correlation: preterm at birth:r = 0.54, p = 9.5e−7; preterm at TEA: r = 0.11, p = 0.36; term: r = 0.029, p = 0.54; two-sided). The shaded envelope denotes the 95% confidence interval. b The gradual change in normalized average controllability is shown underneath the timeline on the brain maps. Source data are provided as a Source Data file.
Fig. 4
Fig. 4. Group differences in controllability between preterm and term infants.
a Average controllability distribution differences between preterm and term infants (t stats value from the two-sampled two-sided t-test). b Average controllability development rate differences between preterm and term infants (z stats value from correlation comparison). c Positive correlations between regional average controllability and their rate of development (correlation with age) for both preterm (Pearson’s r = 0.40, p = 1.1e−4; two-sided) and term infants (Pearson’s r = 0.18, p = 0.083; two-sided). The shaded envelope denotes the 95% confidence interval. Source data are provided as a Source Data file.
Fig. 5
Fig. 5. Control energy cost to activate brain networks.
Whole-brain control energy cost to activate each brain functional network were compared between term (dark box on the left) and preterm infant (light box on the right) groups with an unpaired two-sided t-test: Visual: t = 1.96, p = 0.050; Somatomotor: t = −4.74, p = 2.7e−6; Dorsal attention: t = 5.42, p = 9.2e−8; Ventral attention: t = −3.23, p = 0.0010; Limbic: t = 2.84, p = 0.005; Frontoparietal: t = −5.35, p = 1.3e−7; Default mode: t = 0.41, p = 0.68; Subcortical: t = −1.83, p-0.067. Boxes denote the 25th to 75th percentile and the median line. (*, **,*** indicates results are significant at p < 0.05, p < 0.01, and p < 0.001 for the two-sample two-sided t-test.) Regional control energy required for term (on the left) and preterm infants (on the right) to reach each network activation target were shown on the corresponding brain maps. Source data are provided as a Source Data file.

References

    1. van den Heuvel MP, Sporns O. Network hubs in the human brain. Trends Cogn. Sci. 2013;17:683–696. doi: 10.1016/j.tics.2013.09.012. - DOI - PubMed
    1. Honey CJ, Thivierge J-P, Sporns O. Can structure predict function in the human brain? NeuroImage. 2010;52:766–776. doi: 10.1016/j.neuroimage.2010.01.071. - DOI - PubMed
    1. Ouyang M, Dubois J, Yu Q, Mukherjee P, Huang H. Delineation of early brain development from fetuses to infants with diffusion MRI and beyond. NeuroImage. 2019;185:836–850. doi: 10.1016/j.neuroimage.2018.04.017. - DOI - PMC - PubMed
    1. Gilmore JH, Knickmeyer RC, Gao W. Imaging structural and functional brain development in early childhood. Nat. Rev. Neurosci. 2018;19:123–137. doi: 10.1038/nrn.2018.1. - DOI - PMC - PubMed
    1. Huang H, et al. Development of Human Brain Structural Networks Through Infancy and Childhood. Cereb. Cortex. 2015;25:1389–1404. doi: 10.1093/cercor/bht335. - DOI - PMC - PubMed

Publication types