. 2023 Sep 19;14(1):5799.
doi: 10.1038/s41467-023-41417-0.

Translating genomic tools to Raman spectroscopy analysis enables high-dimensional tissue characterization on molecular resolution

Affiliations

Translating genomic tools to Raman spectroscopy analysis enables high-dimensional tissue characterization on molecular resolution

Manuel Sigle et al. Nat Commun. .

Abstract

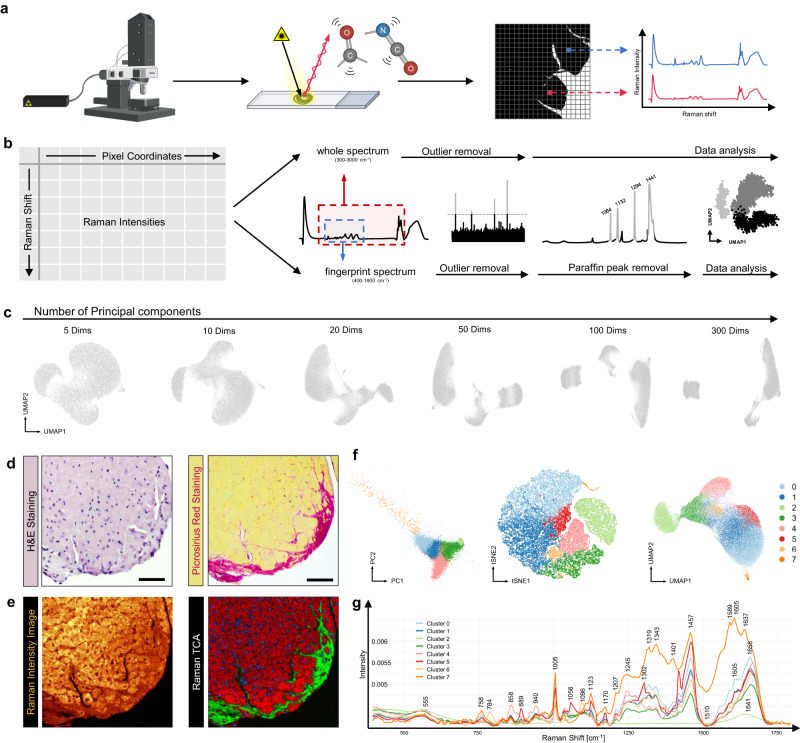
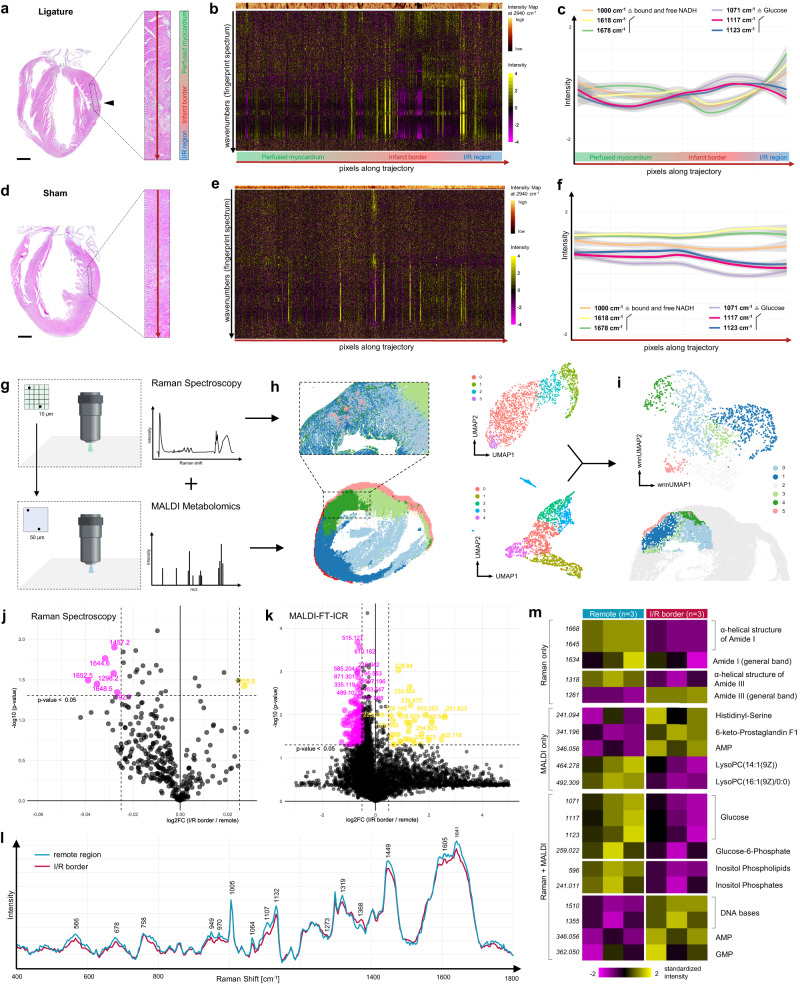
Spatial transcriptomics of histological sections have revolutionized research in life sciences and enabled unprecedented insights into genetic processes involved in tissue reorganization. However, in contrast to genomic analysis, the actual biomolecular composition of the sample has fallen behind, leaving a gap of potentially highly valuable information. Raman microspectroscopy provides untargeted spatiomolecular information at high resolution, capable of filling this gap. In this study we demonstrate spatially resolved Raman "spectromics" to reveal homogeneity, heterogeneity and dynamics of cell matrix on molecular levels by repurposing state-of-the-art bioinformatic analysis tools commonly used for transcriptomic analyses. By exploring sections of murine myocardial infarction and cardiac hypertrophy, we identify myocardial subclusters when spatially approaching the pathology, and define the surrounding metabolic and cellular (immune-) landscape. Our innovative, label-free, non-invasive "spectromics" approach could therefore open perspectives for a profound characterization of histological samples, while additionally allowing the combination with consecutive downstream analyses of the very same specimen.


Conflict of interest statement

The authors declare no competing interests.

Figures

Fig. 1
Fig. 1. Spatially-unaware spectra from Raman analysis show distinct clustering.
a Data analysis workflow, starting from data acquisition using a confocal Raman microspectroscope. b Data handling, transformation and correction. Biologically relevant spectrum between 300 and 3000 cm−1 (named “whole spectrum”) was corrected for outliers and then analyzed. Raman “fingerprint” spectrum between 400 and 1800 cm−1 was corrected for outliers and paraffin peaks and then analyzed. c Increasing the number of principal components concretizes cluster results for UMAP analysis of Raman data. Whole spectrum data from the section from d and e was used. d H&E (left) and Picrosirius Red Staining (right) of adjacent sections to the sample of subendocardial fibrosis which was subjected to Raman spectroscopy. Scale bar 50 µm. e Raman Intensity Image (left) and Raman TCA (right) as described in the Methods section. f Various projections after dimensionality reduction of the fingerprint spectrum from the section of d and e, including PCA, tSNE and UMAP. g Cluster-specific average spectra with characteristic peak annotations. UMAP: Uniform Manifold Approximation and Projection, TCA: True Component Analysis, PC: Principal Component, tSNE: t-distributed stochastic neighbor embedding.
Fig. 2
Fig. 2. Cluster characteristics, spatial decoding and biological assignment.
a Heatmap of top differential Raman peaks per cluster, sorted by average log2 foldchange. Wavenumbers are rounded by one decimal place. b Cluster characteristics, n is number of pixels assigned to specific cluster, percentages are overall cluster size. c Density contour lines overlayed on UMAP plot, underlining compactness and hence similarity/homogeneity within clusters. d Intensity distribution of selected peaks over UMAP of analyzed pixels. Corresponding intensity distribution images with spatially reordered pixels. Key wavenumbers for cluster 0, 2, 4 and 7 (from top to bottom) were identified by DEG analysis and cluster-specific average spectra. e Pixels reordered in correct spatial correlation and colored by clusters identified from analysis before. f Sankey plot visualizing supervised assignment of detected clusters to myocardial substructures. g Supervised “ground truth” coloring of identified clusters for comparison with classical histological staining. Scale bar 50 µm. DEG: differential expressed genes.
Fig. 3
Fig. 3. Integration of spatial information confirms tissue clustering and myocardial zonations.
a Implementation of spatial context into Raman spectroscopy analysis using the bioinformatic model of a Markov random field (see Methods), which considers similar tissue to be closer together in space. b, c Cluster averages and UMAP projection identified by spatially-aware cluster analysis of fingerprint spectrum using BayesSpace. d Spatially reordered pixels, colored by cluster identified by BayesSpace. Scale bar 50 µm. e Heatmap of top differential intensities of Raman peaks per cluster, sorted by average log2 foldchange. f, g PCA to decipher molecular differences between healthy und remodeling myocardium, identified by spatially-aware (f) and spatially-unaware (g) cluster analysis. h PC loadings indicating changes in protein secondary structure towards ß-sheet structures and metabolic changes driven by myocardial remodeling.
Fig. 4
Fig. 4. Deciphering intra- and intercluster heterogeneity by repurposing pseudotime trajectories and employing spatial trajectories towards fibrosis.
a UMAP projection of spatially-unaware of Raman data with overlayed pseudotime trajectories. Branches denote crucial differences from pixels along the main trajectory and are predominantly found in clusters assigned to myocardium (dashed box). b DDRTree based pseudotime trajectory of pixels from center of Raman scan (area highlighted in red). c Branches almost exclusively occur with pixels assigned to cluster 1 (remodeling myocardium, dark blue), while spectra derived from healthy myocardium (light blue) appear homogenously. d Spatial trajectory along red arrow in section of subendocardial fibrosis. Heatmap of log2 normalized intensity changes in Raman fingerprint spectrum along this trajectory. Corresponding clusters along trajectory are plotted on bottom by their color code. e, f Selected wavenumbers with intensity shifts along the spatial trajectory. Blue lines are mean, grey ribbons are 0.95 confidence intervals. 858 cm−1 band corresponds to hydroxyproline from collagen, 1314 cm−1 to cytochrome c. g A similar myocardial pattern with a distinct healthy (light blue) and remodeling (dark blue) cluster when approaching fibrotic regions (pink) was reproduced in 4 individual hearts. Scale bar 50 µm. h Reproduction of intensity shifts of collagen and cytochrome c (n = 4). i Log2 normalized intensity changes filtered to pixels assigned to cluster 0 and 1 along the spatial trajectory (red arrow). j Representative wavenumber demonstrating intensity dynamics within cluster 0 and 1. 1569 cm−1 corresponds to NH bending especially found in in α-helical protein structures. Grey ribbons are 0.95 confidence intervals. k Violin plots showing significantly lower dynamics in all spectra from cluster 0 (light blue, healthy myocardium) in comparison to cluster 1 (dark blue), implying molecular dynamics of myocardium under remodeling. Quantification by calculating the maximum variability of the local polynomial regression fitting (loess) curve (left, p = 5.02 × 10⁻⁴) and thresholding of the derivation from loess curve (right, p < 2.2*10−16). Welch two-sided, paired t-test. n = 1 (sample from a). l Reproduction of spectral dynamics in the remodeling subcluster in n = 4 individual hearts. Welch two-sided, paired t-test. Bars display mean ± SEM.
Fig. 5
Fig. 5. High-dimensional characterization of metabolic alterations in myocardial infarction by spatial trajectories and multimodal Raman-MALDI imaging.
a H&E Staining of a murine sagittal heart section after induction of myocardial infarction by transient ligature of the LAD. Dashed box denotes cardiac tissue with transition from healthy to ischemic/reperfused (I/R) myocardium. Black arrow points at the ligation site. Long red arrow depicts spatial trajectory passing the infarct border and heading towards the ischemic heart region. Scale bar 1 mm. n = 1 individual sample. b Heatmap of log2 normalized intensity changes in Raman fingerprint spectrum along this trajectory. c Intensity shifts of three characteristic peaks for NADH and glucose were tracked along the trajectory and show a specific pattern when crossing the infarct border and entering the ischemic heart region. Grey ribbons are 0.95 confidence intervals. df Intensity alterations in a sham-operated heart, where the suture around the LAD was not closed. Grey ribbons are 0.95 confidence intervals. n = 1 individual sample. Scale bar 1 mm. g Illustration of the multi-omics approach of combining Raman and MALDI imaging on the same tissue regions. For best fitting, resolution of Raman imaging was 5 times higher than MALDI imaging (10 vs. 50 µm). h, left Cluster analysis of both datasets separately. Both methods uncover distinct spatially organized clusters at the infarct border region. h, right Cluster analysis of overlaying data points after spatial co-registration of Raman and MALDI scans. i Integration of these datasets into a multimodal analysis using weighted nearest neighbor (wnn) dimension reduction and cluster analysis (top). The resulting cluster image (bottom) fits well with the boundaries of the infarcted region identified in the H&E staining (Supplementary Fig. 12). j, k Volcano plot of n = 3 individual hearts exploring spectral differences from cluster-identified I/R border regions vs. remote (healthy) regions. Welch two-sided, paired t-test. l Average Raman spectrum for I/R border regions and remote regions. m Heatmap of standardized mean difference between I/R and remote regions from n = 3 individual hearts. Raman-only section with modalities only identifiable by Raman spectroscopy, MALDI-only those using MALDI imaging. Raman + MALDI show reproducibility of measurements across the different methods. Raman wavenumbers (no decimals) and m/z values (three decimal places) are shown on the left of the heatmap.
Fig. 6
Fig. 6. Defining the surrounding cellular (immune-) landscape in the model of acute myocardial infarction.
a Multi-omics approach to decipher spectra from cells by combination of Raman spectroscopy with consecutive MACSimaTM multicolor immunofluorescence staining. b H&E staining of an adjacent section of murine myocardial infarction. Scale bar 300 µm. c MACSima™ multiplexed immunofluorescence imaging was performed on the identical section and region as Raman spectroscopy was done previously. Scale bar 50 µm. n = 1 individual sample. d Raman Intensity images at 2940 cm−1 (general band for lipids and proteins). Scale bar 100 µm. e Cluster image identified by the Seurat workflow. Cluster 0 was assigned to myocardium. f tSNE plot after dimensionality reduction of Raman spectra of identified cell types. Clear separation into cardiomyocytes, erythrocytes and immune cells. g Spectral subphenotyping of immune cells. Neutrophils display the largest cluster while MHC II+ professional antigen-presenting cells (pAPCs) and CD68+ macrophages separate into a distinct cluster. h Donut chart showing frequency distribution of identified cells (percent from absolute number of analyzed number of pixels). i Venn diagram of surface markers analyzed for the immune cell subpopulation. E.g., most Ly6G+ cells were also CD45 + . j Average spectra for the different cell types and characteristic peaks, together with the spatial representation of the analyzed pixels. vSMCs: vascular smooth muscle cells.

References

    1. Rao A, Barkley D, Franca GS, Yanai I. Exploring tissue architecture using spatial transcriptomics. Nature. 2021;596:211–220. - PMC - PubMed
    1. Marx V. Method of the Year: spatially resolved transcriptomics. Nat. Methods. 2021;18:9–14. - PubMed
    1. Mosca, S., Conti, C., Stone, N. & Matousek, P. Spatially offset Raman spectroscopy. Nat. Rev. Meth. Primers1, 10.1038/s43586-021-00019-0 (2021).
    1. Butler HJ, et al. Using Raman spectroscopy to characterize biological materials. Nat. Protoc. 2016;11:664–687. - PubMed
    1. Du J, et al. Raman-guided subcellular pharmaco-metabolomics for metastatic melanoma cells. Nat. Commun. 2020;11:4830. - PMC - PubMed

Publication types