. 2023 Sep 19;13(1):15480.
doi: 10.1038/s41598-023-42468-5.

Maternal and paternal obesity differentially reprogram the ovarian mitochondrial biogenesis of F1 female rats

Affiliations

Maternal and paternal obesity differentially reprogram the ovarian mitochondrial biogenesis of F1 female rats

Amina G Ramadan et al. Sci Rep. .

Abstract

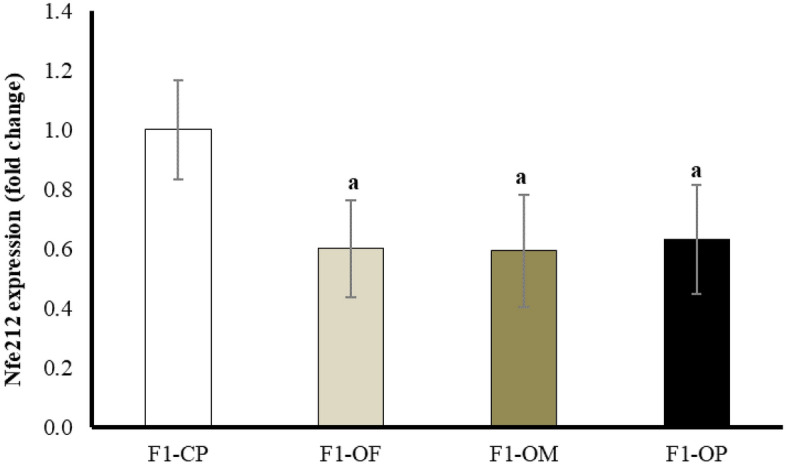
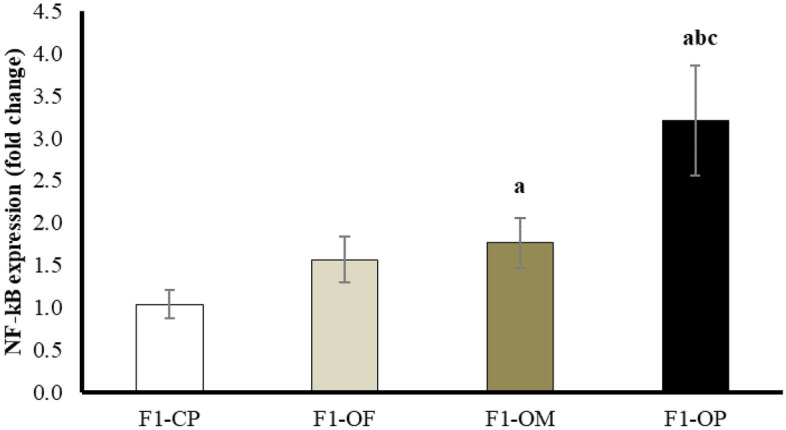
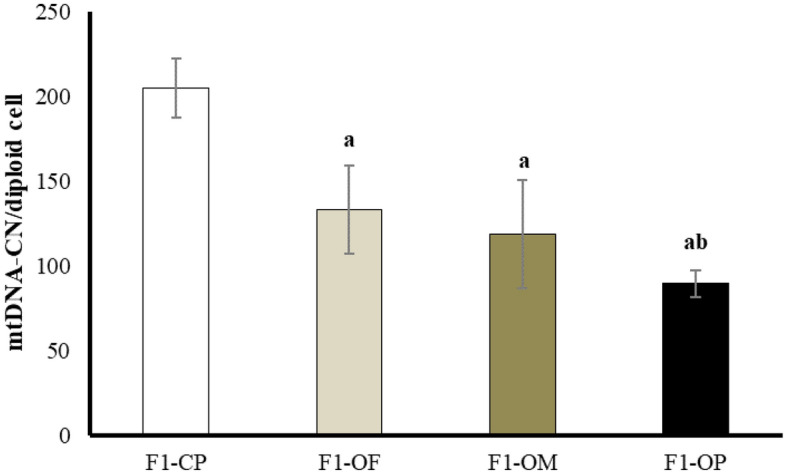
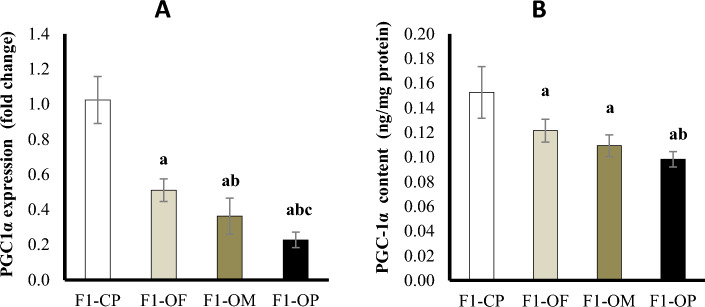
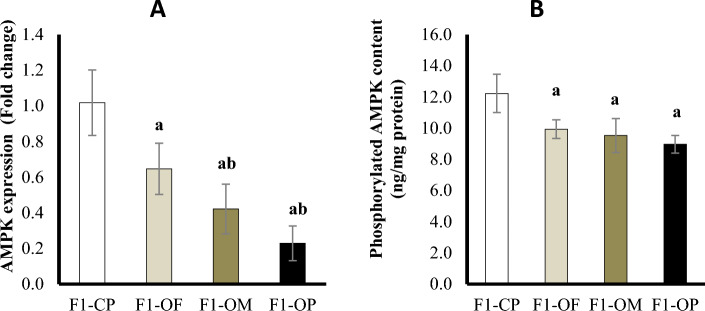
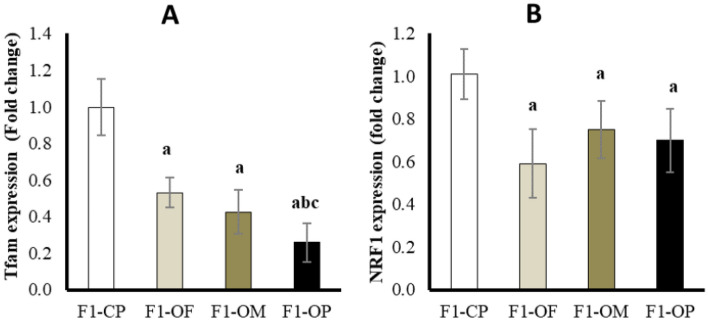
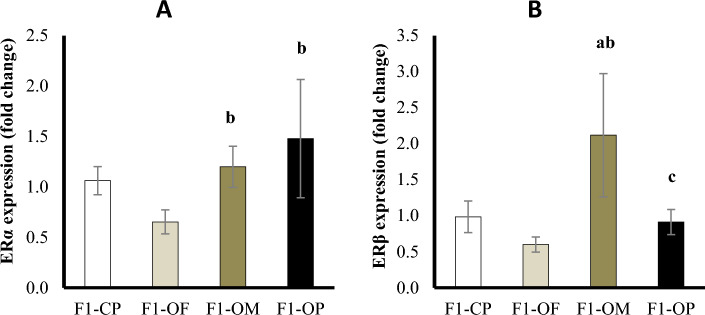
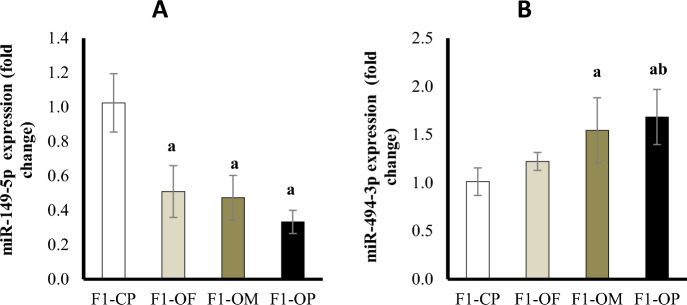
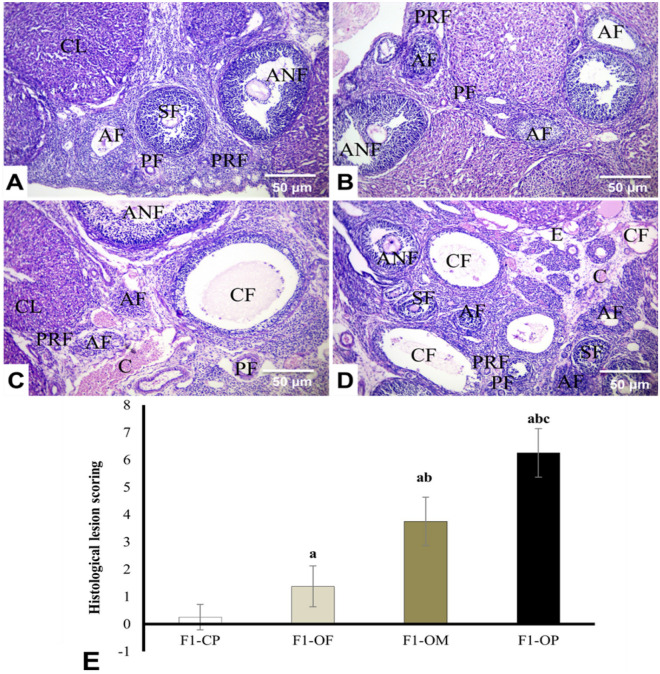
Obesity has harmful consequences on reproductive outcomes and the rapid increase in obesity is assumed to be influenced by epigenetics and trans-generation effects. Our study aimed to explore the effect of maternal and/or paternal obesity on the ovarian tissues of the first-generation female offspring in rats. The study was conducted on 40 adult Wistar albino rats (20 males and 20 females). Obesity was induced by feeding them an obesogenic diet for 3 months. The pregnancy was induced in the females by mating with males in four combinations: healthy mother with healthy father (control parents, CP), healthy mother with obese fathers (OF), obese mothers with healthy father (OM), and obese mother with obese father (obese parents, OP). After delivery, the female offspring at two months were sacrificed, and the blood and ovarian tissues were collected to assess the studied parameters. Our result showed differential impacts of maternal and paternal obesity on the ovarian health of the female offspring. The female offspring of obese OM or OP showed early signs of obesity. These metabolic abnormalities were associated with signs of ovarian lesions, impaired folliculogenesis, and decreased oocyte quality and also showed significant alterations in mitochondrial biogenesis, redox status, inflammation, and microRNAs expression (miR-149 and miR-494). In conclusion, altered ovarian expression of microRNAs and associated impaired mitochondrial biogenesis pathways may be the root causes for the observed intergeneration transmission of the obesogenic phenotype.


Conflict of interest statement

The authors declare no competing interests.

Figures

Figure 1
Figure 1
Nuclear factor erythroid 2 related factor 2 expression in different studied groups. Data are presented as mean ± SD and n = 8. aSignificantly different compared with offspring of control parents by ANOVA followed by Post Hoc test (Tukey), at P < 0.05. (Abbreviations: F1 first generation female offspring, CP control parents, OF obese father, OM obese mother, and OP obese parents).
Figure 2
Figure 2
Nuclear factor kappa B expression in different studied groups. Data are presented as mean ± SD and n = 8. a: Significantly different compared with offspring of control parents, b: significantly different compared with offspring of obese fathers, c: significantly different compared with offspring of obese mothers by ANOVA followed by Post Hoc test (Tukey), at P < 0.05. (Abbreviations: F1 first generation female offspring, CP control parents, OF obese father, OM obese mother, OP; obese parents).
Figure 3
Figure 3
Mitochondrial DNA copy number/diploid cell in different studied groups. Data are presented as mean ± SD and n = 8. a: Significantly different compared with offspring of control parents, and b: significantly different compared with offspring of obese fathers by ANOVA followed by Post Hoc test (Tukey), at P < 0.05. (Abbreviations: F1 first generation female offspring, CP control parents, OF obese father, OM obese mother, and OP obese parents).
Figure 4
Figure 4
Ovarian peroxisome proliferator-activated receptor γ coactivator-1 alpha (PGC-1α) at mRNA expression (A) and protein level (B) in different studied groups. Data are presented as mean ± SD and n = 8. a: Significantly different compared with offspring of control parents, b: significantly different compared with offspring of obese fathers, c: significantly different compared with offspring of obese mothers by ANOVA followed by Post Hoc test (Tukey), at P < 0.05. (Abbreviations: F1 first generation female offspring, CP control parents, OF obese father, OM obese mother, OP obese parents).
Figure 5
Figure 5
Ovarian AMP-activated protein kinase (AMPK) at mRNA expression (A) and protein level (B) in different studied groups. Data are presented as mean ± SD and n = 8. a: Significantly different compared with offspring of control parents, and b: significantly different compared with offspring of obese fathers by ANOVA followed by Post Hoc test (Tukey), at P < 0.05. (Abbreviations: F1 first generation female offspring, CP control parents, OF obese father, OM obese mother, and OP obese parents).
Figure 6
Figure 6
Ovarian mitochondrial transcription factors-A (Tfam) (A) and nuclear respiratory factor 1 NRF1 expression (B) in different studied groups. Data are presented as mean ± SD and n = 8. a: Significantly different compared with offspring of control parents, b: significantly different compared with offspring of obese fathers, c: significantly different compared with offspring of obese mothers by ANOVA followed by Post Hoc test (Tukey), at P < 0.05. (Abbreviations: F1 first generation female offspring, CP control parents, OF obese father, OM obese mother, OP obese parents).
Figure 7
Figure 7
Estrogen receptor α (A) and estrogen receptor β (B) gene expression in different studied groups. Data are presented as mean ± SD and n = 8. a: Significantly different compared with offspring of control parents, b: significantly different compared with offspring of obese fathers, c: significantly different compared with offspring of obese mothers by ANOVA followed by Post Hoc test (Tukey), at P < 0.05. (Abbreviations: F1 first generation female offspring, CP control parents, OF obese father, OM obese mother, OP obese parents).
Figure 8
Figure 8
MiR-149-5p (A) and miR-494-3p (B) gene expression (fold change) in different studied groups. Data are presented as mean ± SD and n = 8. a: Significantly different compared with offspring of control parents, and b: significantly different compared with offspring of obese fathers by ANOVA followed by Post Hoc test (Tukey), at P < 0.05. (Abbreviations: F1 first generation female offspring, CP control parents, OF obese father, OM obese mother, and OP obese parents).
Figure 9
Figure 9
Representative photomicrograph of rat ovaries (HE, × 400). Female offspring of Control parents (A), obese father (B), obese mother (C), and obese parents (D). Primordial follicle (PRF), primary follicle (PF), secondary follicle density (SF) antral follicle (ANF), atretic Follicle (AF), corpus lutea (CL), cystic follicles (CF) vascular congestion (C) and edema (E). Quantification of the histological lesion scoring in different studied groups. Data are presented as mean ± SD and n = 8. a: Significantly different compared with offspring of control parents, b: significantly different compared with offspring of obese fathers, c: significantly different compared with offspring of obese mothers by ANOVA followed by Post Hoc test (Tukey), at P < 0.05. (Abbreviations: F1 first generation female offspring, CP control parents, OF obese father, OM obese mother, OP obese parents).

References

    1. Abd El-aty NS, et al. Overweight and obesity prevalence among upper Egypt primary schools' children using Egyptian and CDC growth charts. Appl. Nurs. Res. 2020;56:151346. - PubMed
    1. Aktar N, Qureshi NK, Ferdous HS. Obesity: A review of pathogenesis and management strategies in adult. Delta Med. Coll. J. 2017;5(1):35–48.
    1. Cuda SE, Censani M. Pediatric obesity algorithm: A practical approach to obesity diagnosis and management. Front. Pediatr. 2019;6:431. - PMC - PubMed
    1. Gao X, et al. Obesity induces morphological and functional changes in female reproductive system through increases in NF-κB and MAPK signaling in mice. Reprod. Biol. Endocrinol. 2021;19(1):1–15. - PMC - PubMed
    1. Richards JS, Pangas SA. The ovary: Basic biology and clinical implications. J. Clin. Investig. 2010;120(4):963–972. - PMC - PubMed

Publication types