. 2023 Sep 19;14(1):5814.
doi: 10.1038/s41467-023-41387-3.

Epithelial plasticity and innate immune activation promote lung tissue remodeling following respiratory viral infection

Affiliations

Epithelial plasticity and innate immune activation promote lung tissue remodeling following respiratory viral infection

Andrew K Beppu et al. Nat Commun. .

Abstract

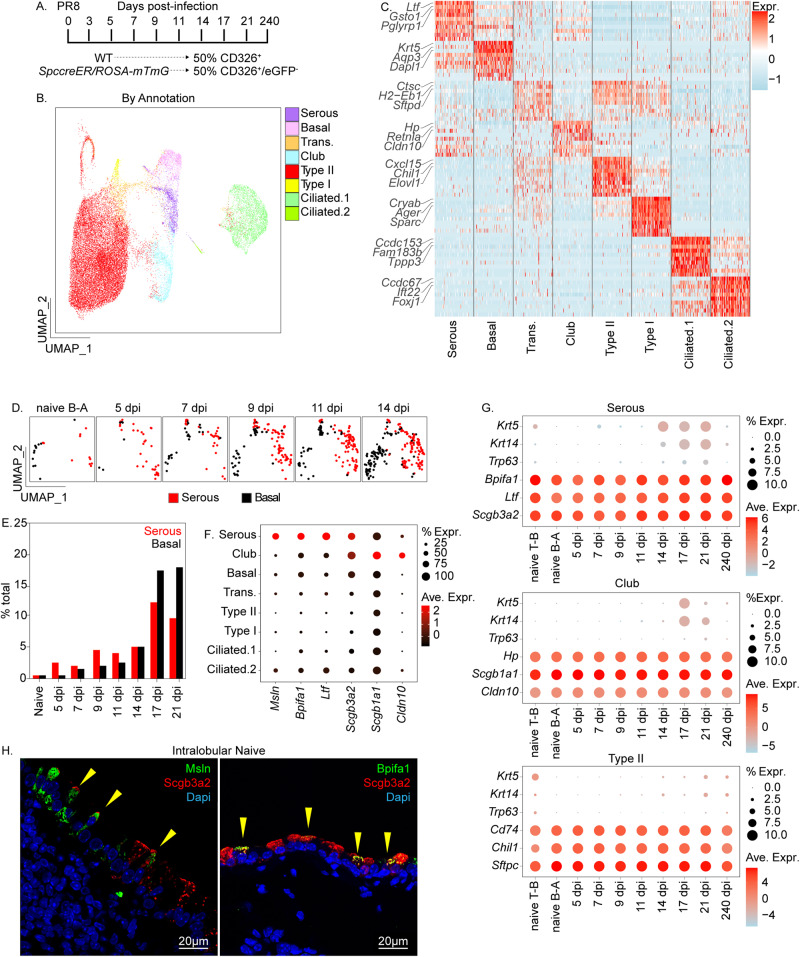
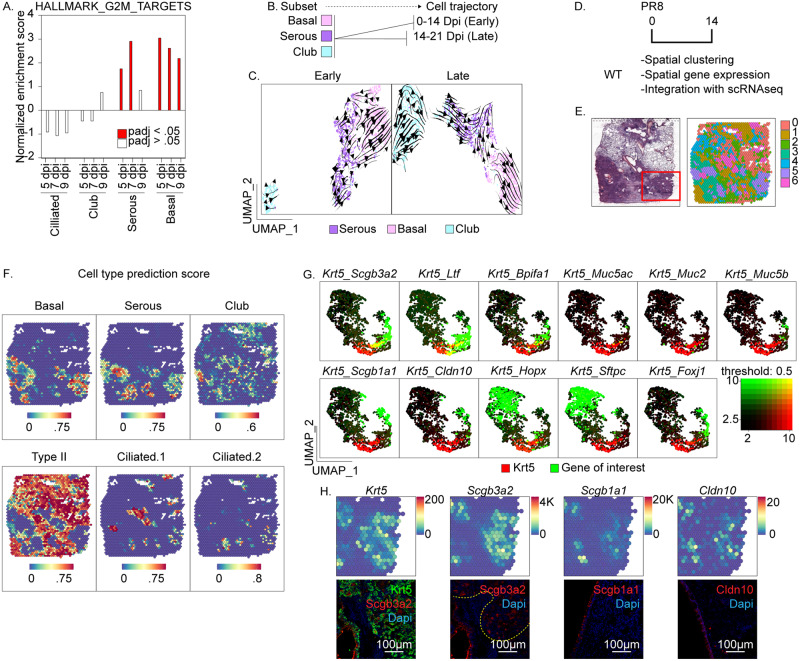
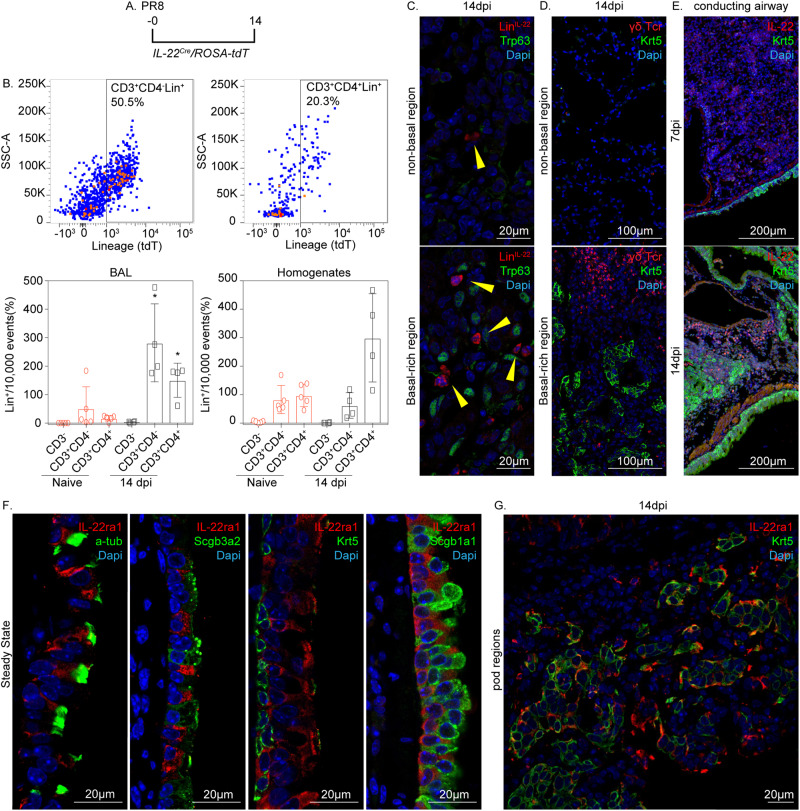
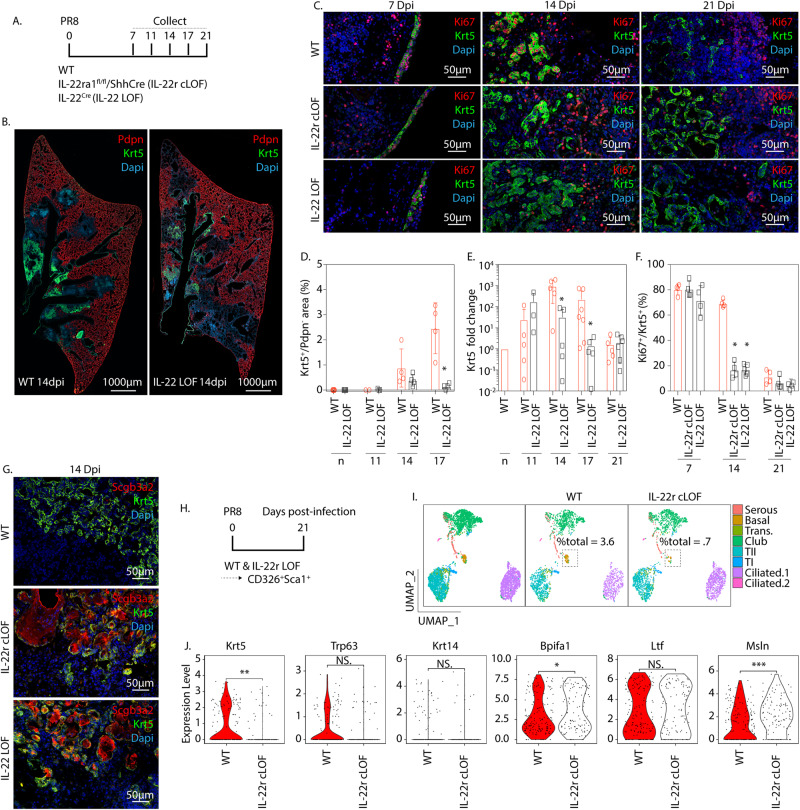
Epithelial plasticity has been suggested in lungs of mice following genetic depletion of stem cells but is of unknown physiological relevance. Viral infection and chronic lung disease share similar pathological features of stem cell loss in alveoli, basal cell (BC) hyperplasia in small airways, and innate immune activation, that contribute to epithelial remodeling and loss of lung function. We show that a subset of distal airway secretory cells, intralobar serous (IS) cells, are activated to assume BC fates following influenza virus infection. Injury-induced hyperplastic BC (hBC) differ from pre-existing BC by high expression of IL-22Ra1 and undergo IL-22-dependent expansion for colonization of injured alveoli. Resolution of virus-elicited inflammation results in BC to IS re-differentiation in repopulated alveoli, and increased local expression of protective antimicrobial factors, but fails to restore normal alveolar epithelium responsible for gas exchange.


Conflict of interest statement

The authors declare no competing interests.

Figures

Fig. 1
Fig. 1. ScRNAseq to reveal the molecular phenotype of lung epithelial cells during the course of PR8 influenza virus infection.
A Experimental design. Mouse lung homogenates were collected from 8 to 12-week-old C57/Bl6 and Sftpc-CreER/ROSA-mTmG mice (n = 5 per group). Lung tissue was collected at indicated time points and either total epithelial cells (C57/Bl6 mice; CD31-CD45CD326+) or AT2-depleted epithelial cells (Sftpc-CreER/ROSA-mTmG mice; CD31CD45CD326+eGFP) enriched by FACS. B UMAP plot of combined scRNAseq data. Unsupervised clustering was used to distinguish distinct cell phenotypes which were assigned to known epithelial cell types based upon gene signatures. Pie chart shows a fractional representation of each cell types within the entire data set. C Heatmap showing unique molecular profiles between cell types. Top 3 genes for each cell category are annotated to the left. Full gene lists for each cell category are provided in Supplementary Fig. 1A. D UMAP plot tracking relative changes in basal and serous cell populations for indicated samples. B-A bronchioalveolar. E Representation of serous (red bars) and basal (black bars) cell types as a function of percent total sampled cells at each time point. Analysis was performed on AT2-depleted samples (i.e. using the FACs enrichment strategy CD31CD45CD326+eGFP from Sftpc-CreER/ROSA-mTmG mice). dpi days post-infection. F Dot plot comparing expression of selected club and serous cell-specific genes between cell types. G Assessment of BC gene signature from PR8-induced injury. T-B tracheal bronchial. H Representative immunofluorescence colocalization of either Msln or Bpifa1 (green) with Scgb3a2 (red) within conducting airway epithelium (1 experiment, n = 5 biological replicates).
Fig. 2
Fig. 2. Single-cell and spatial gene expression profiling to investigate lineage relationships between serous and basal cells following PR8 infection.
A Comparative analysis of normalized enrichment for mitotic gene sets by cell type & condition. Red bars represent conditions with adjusted p-value < 0.05. p-value calculation is based upon an adaptive multi-level split Monte-Carlo scheme. B Experimental design for the generation of RNA velocity projections. Single-cell RNAseq data were first subsetted by cell type (basal, serous, and club), followed by time following infection (early: naïve, 3, 5, 7, 9, 11, 14 dpi, or late: 14, 17, and 21 dpi). C Trajectory inference based upon RNA velocity profiling among basal, serous, and club cell subsets. D Experimental design for the generation of spatial gene expression data. E Projection of spot clusters onto H&E image of the tissue sample. F Cell type prediction scores of epithelial populations represented within spatial RNAseq data. Cell type-specific gene signatures were generated using scRNAseq data in Fig. 1A. Color scale at the bottom reflects the intensity of cell type prediction scores. G Co-expression of selected epithelial markers 14 days following PR8 exposure: Krt5 (basal), Scgb3a2 (serous and club), Ltf, Bpifa1 (serous), Muc5ac, Muc2, Muc2(goblet), Scgb1a1, Cldn10 (club), Hopx (Type I), Sftpc (Type II), Foxj1 (Ciliated). H Spatial gene expression and corresponding immunofluorescence of cell type-specific markers. Transcripts were mapped onto spot coordinates from the region sampled in the red box in Fig. 2E: Krt5 (basal), Scgb3a2 (serous and club), Scgb1a1 (club), and Cldn10 (club) markers. Immunofluorescence colocalization of either Cldn10, Scgb1a1, or Scgb3a2 (red), with Krt5 (green), within the injured distal airway of 14 dpi PR8 infected mice (1 experiment, n = 5 biological replicates). Color scale reflects the abundance of indicated transcripts.
Fig. 3
Fig. 3. Rare Scgb3a2+/Scgb1a1- serous cells reside within intralobar epithelium and assume BC fates in response to PR8-induced airway injury.
A Schematic illustration of recombinase driver and reporter alleles used in Dre/Cre recombinase (DR) mice for independent lineage labeling of serous and club cells. B Experimental design. DR mice (n = 5 per experimental group) were treated with three doses of TM, infected with PR8, and recovered for the indicated time points. C Representative immunofluorescence localization of tdT (Lin3a2; red) and eGFP (Lin3a2/1a1; green) lineage reporters reflective of serous and club cells, respectively (1 experiment, n = 3 biological replicates). Shown is a low-magnification image (left) and selected high-magnification images of either proximal (i) or distal (ii) airway epithelium (right). Bottom row shows representative immunofluorescence colocalization of lineage reporters (green or red) with either Bpifa1, Foxj1, or Krt5 (white) in the airways of naïve mice. D Representative immunofluorescence colocalization of lineage reporters (green or red) with Krt5 (white) 14 days after PR8 infection, demonstrating Lin3a2-high and Lin3a2-low epithelial cells (1 experiment, n = 3 biological replicates). E Representative immunofluorescence colocalization of lineage reporters (green or red) with Krt5 (white) 14 days after PR8 infection, demonstrating recruitment of Lin3a2 -low epithelial cells into damaged alveolar epithelium (1 experiment, n = 3 biological replicates). F Representative immunofluorescence colocalization of tdT (Lin3a2; red) with Krt5 (green) among lineage-positive alveolar clusters 21 days after PR8 infection (1 experiment, n = 3 biological replicates). G Experimental design for assessing lineage tagged populations using extended washout period. DR mice (n = 5 per experimental group) were treated with three doses of tamoxifen, infected with PR8, and recovered for the indicated time points. H Representative immunofluorescence colocalization of lineage reporters (red) with Krt5 (green) 14 and 21 days after PR8 infection using extended washout periods for tamoxifen (1 experiment, n = 5 biological replicates for all except 14 dpi DR, for which n = 6). I Experimental design for the generation of in-vitro organoids from tdT-lineage tagged cells (n = 5). J Representative scatter plot of tdT and eGFP lineage-labeled cells from tissue homogenate of DR mice. Lineage reporter (tdT; eGFP) was assessed as a function of surface expression of CD326+Sca1+ airway epithelium and CD326+Sca1 alveolar epithelium. K Representative immunofluorescence colocalization of lineage reporters (Lin3a2; red) with Krt5 (green) from organoid cultures demonstrating Lin3a2-high and Lin3a2-low epithelial cells. L Quantification of recombination efficiency following immunofluorescent staining for tdT, eGFP, and Scgb3a2 (as in ‘D’; tamoxifen washout period = 9 days). Red bars show either Scgb3a2 or lineage traced (either tdT or eGFP) cells per unit basement membrane. Black bar represents the fractional representation of Scgb3a2-immunofluorescent cells that are lineage-positive. Data are presented as mean values ± SEM. n = 3 biologically independent samples per condition, with significance determined by Mann–Whitney two-tailed U-test. Source data are provided as a Source Data file. M Contribution of lineage-tagged populations to hBC in alveolar ‘pods’ as a function of time (as in ‘H’; tamoxifen washout period = 28 days) after PR8 infection. Data are presented as mean values ± SEM. n = 5 per condition, with significance determined by Mann–Whitney two-tailed U-test (**P < 0.01). Source data are provided as a Source Data file. N Quantification of flow cytometry (as in ‘J’; tamoxifen washout period = 28 days) from tissue homogenate from PR8-infected DR mice. Lineage reporter (tdT; Lin+) was assessed as a function of surface expression of Sca1 and data was presented as the fraction of positive cells. Data are presented as mean values ± SEM. n = 4 biologically independent samples per condition, with significance determined by Mann–Whitney two-tailed U-test (*P < 0.05). Source data are provided as a Source Data file.
Fig. 4
Fig. 4. T lymphoid cells colocalize with hBC at sites of lung injury following PR8 infection.
A Representation of significant GO terms associated with immune > epithelial interaction enriched among PR8-infected BC (upper) and IS cells (lower) using a Panther overrepresentation test. Source data are provided as a Source Data file. B Assessment of selected cytokine levels in BALF during PR8 infection. Data are presented as mean values ± SEM. n = 4 for the 7-day post-PR8 condition. n = 5 For all other conditions. All analyzed samples were biologically independent. Statistical significance was determined by Mann–Whitney two-tailed U-test (*P < 0.05, **P < 0.01). Source data are provided as a Source Data file. C Experimental design. Mouse lung homogenates were collected from 8 to 12-week-old C57/Bl6 mice. CD31CD326+CD45+ immune cells were enriched by FACS and transcriptomes were assessed by scRNAseq (n = 5 per group). D UMAP plot of combined scRNAseq data. Unsupervised clustering was used to distinguish distinct cell phenotypes which were assigned to known immune cell types based upon gene signatures. E Dot Plot selected cell-type-specific gene expression for each annotated cluster. F Cell type prediction scores of immune populations represented within spatial RNAseq data. Cell type-specific gene signatures were generated using immune scRNAseq data in Fig. 5A and epithelial scRNAseq data in Fig. 1A. Color scale at the bottom reflects the intensity of cell type prediction scores. G Dot plot showing activation of type-17 gene signature (IL-17a, IL-23r, and IL-22) in γδT cells.
Fig. 5
Fig. 5. Identity of IL-22 expressing cells and their localization to regions of BC hyperplasia in lungs of PR8 infected mice.
A Experimental design for fate mapping of IL-22 expressing cells following PR8 infection using IL-22Cre/ROSA-tdT mice. (B) Flow cytometry analysis of either BAL or tissue homogenate from PR8-infected IL-22Cre/ROSA-tdT mice. IL-22 lineage reporter (tdT; Lin+) was assessed as a function of surface expression of CD3 and CD4 and data was presented as the fraction of positive cells. Data are presented as mean values ±± SEM. n = 5 per naïve condition and n = 4 per PR8 condition. All analyzed samples were biologically independent. Significance was determined by Mann–Whitney two-tailed U-test (*P < 0.05). Source data are provided as a Source Data file. C Immunofluorescence detection of Lin+ cells as a function of p63-immunoreactive BC within BC-rich vs. BC devoid alveolar epithelium of PR8-infected mice (1 experiment, n = 5 biological replicates). D Immunofluorescence detection of γδTcr+ cells as a function of Krt5-immunoreactive BC within BC-rich vs. BC devoid alveolar epithelium of PR8-infected mice (1 experiment, n = 5 biological replicates). E Immunofluorescence localization of IL-22 expressing cells 7 and 14 days post-PR8 infection (1 experiment, n = 5 biological replicates). F Immunofluorescence colocalization of IL-22ra1 (red) with either a-tub (ciliated), Scgb3a2 (serous/club), Krt5 (BC), Scgb1a1 (club) (green) in airways of naïve mice (1 experiment, n = 5 biological replicates). G Representative immunofluorescent colocalization of IL-22ra1 (red) and Krt5 (green) in BC-rich alveolar region of PR8-infected mouse lung (1 experiment, n = 5 biological replicates).
Fig. 6
Fig. 6. IL-22 regulates BC fate in the PR8-injured lung.
A Experimental design to assess BC expansion in IL-22Cre homozygous (IL-22 LOF) mice. Left lobes were collected for immunostaining and total RNA was isolated from the right cranial lobe for gene expression analysis. B Representative immunofluorescence localization of Pdpn (red) and Krt5 (green) in lungs of WT and IL-22 LOF mice 14 days post-PR8 infection. C Representative immunofluorescence localization of Ki67 (red) and Krt5 (green) in lung tissue of PR8-infected WT, IL-22 LOF, and IL-22ra1fl/fl/Shh-Cre (IL-22r cLOF) mice. D Quantification of (B). The fraction of the Krt5 stained area was normalized to the area of the damaged alveolar epithelium (DAPI+Pdpn). Data are presented as mean values ± SEM. n = 5, 3, 4, 4 for naïve, 11dpi, 14dpi, and 17dpi conditions, respectively). All analyzed samples were biologically independent. Statistical analysis was performed by Mann–Whitney two-tailed U-test (*P < 0.05). Source data are provided as a Source Data file. E qPCR detection of Krt5 mRNA in total lung RNA of PR8-infected WT and IL-22 LOF mice. Data are presented as mean values ± SEM. n = 5, 3, 5, 5, 7, 5, 5, 6 for 11dpi WT/KO, 14dpi WT/KO, 17dpi WT/KO, 21dpi WT/KO conditions, respectively. All analyzed samples were biologically independent. Statistical analysis was performed by Mann–Whitney two-tailed U-test (*P < 0.05). Source data are provided as a Source Data file. F Quantification of (C). Shown is the Ki67-labeling index for BC, expressed as a percentage of Ki67+, Krt5+ cells within areas of BC hyperplasia.). Data are presented as mean values ± SEM. n = 5 per IL-22 KO 14 dpi condition. n = 4 for all other conditions. All analyzed samples were biologically independent. Statistical analysis was performed by Mann-Whitney two-tailed U-test (*P < 0.05). Source data are provided as a Source Data file. G Representative immunofluorescence localization of Krt5 (green) and Scgb3a2 (red) in lungs of PR8-infected WT, IL-22 LOF and IL-22r cLOF mice. H Experimental design for scRNAseq of PR8-infected IL-22r cLOF mice (n = 5 biological replicates per group). I UMAP plot of Sca1+ airway enriched cells from IL-22r cLOF and C57/Bl6 control. Cell type annotation of clusters was performed based upon the expression of cell type-specific genes. UMAP plot were re-clustered based on genetic permutation to better represent changes in BC populations between experimental conditions. J Assessment of selected basal (Krt5, Krt14, Trp63) and serous (Bpifa1, Ltf, Msln) genes between IL-22r cLOF and WT control. Statistical analysis was performed by Wilcox Test (*P < 0.05, **P < 0.01, ***P < 0.001).

References

    1. Blanpain C, Fuchs E. Stem cell plasticity. Plasticity of epithelial stem cells in tissue regeneration. Science. 2014;344:1242281. - PMC - PubMed
    1. Tata PR, et al. Dedifferentiation of committed epithelial cells into stem cells. in vivo. Nature. 2013;503:218–223. - PMC - PubMed
    1. Tata PR, Rajagopal J. Plasticity in the lung: making and breaking cell identity. Development. 2017;144:755–766. - PMC - PubMed
    1. Hogan BL, et al. Repair and regeneration of the respiratory system: complexity, plasticity, and mechanisms of lung stem cell function. Cell Stem Cell. 2014;15:123–138. - PMC - PubMed
    1. Rackley CR, Stripp BR. Building and maintaining the epithelium of the lung. J. Clin. Investig. 2012;122:2724–2730. - PMC - PubMed

Publication types