. 2023 Sep 19;14(1):5810.
doi: 10.1038/s41467-023-41518-w.

The tumor microenvironment shows a hierarchy of cell-cell interactions dominated by fibroblasts

Affiliations

The tumor microenvironment shows a hierarchy of cell-cell interactions dominated by fibroblasts

Shimrit Mayer et al. Nat Commun. .

Abstract

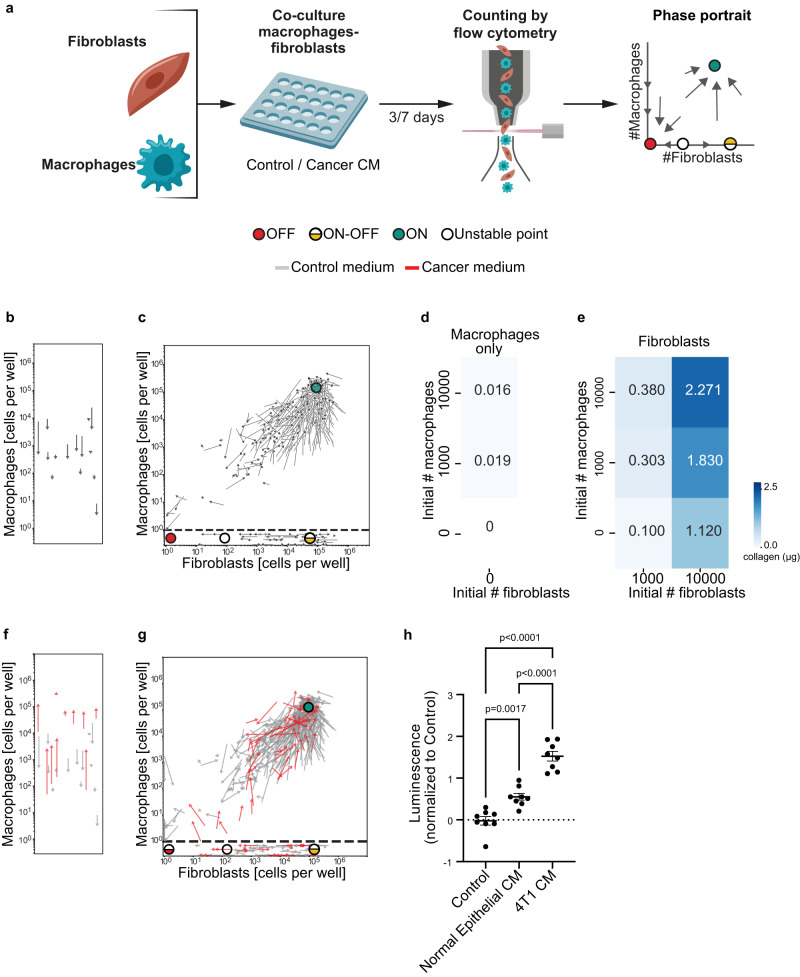
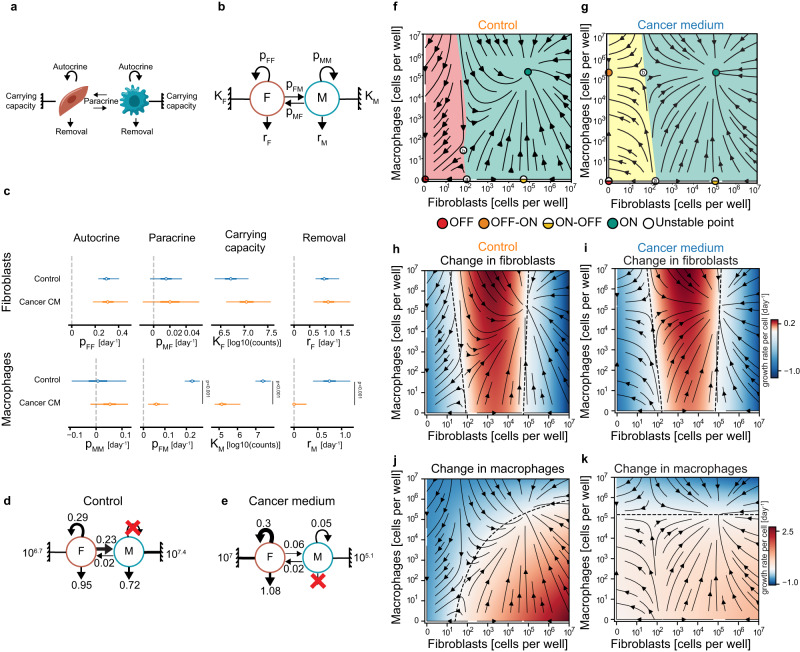
The tumor microenvironment (TME) is comprised of non-malignant cells that interact with each other and with cancer cells, critically impacting cancer biology. The TME is complex, and understanding it requires simplifying approaches. Here we provide an experimental-mathematical approach to decompose the TME into small circuits of interacting cell types. We find, using female breast cancer single-cell-RNA-sequencing data, a hierarchical network of interactions, with cancer-associated fibroblasts (CAFs) at the top secreting factors primarily to tumor-associated macrophages (TAMs). This network is composed of repeating circuit motifs. We isolate the strongest two-cell circuit motif by culturing fibroblasts and macrophages in-vitro, and analyze their dynamics and transcriptomes. This isolated circuit recapitulates the hierarchy of in-vivo interactions, and enables testing the effect of ligand-receptor interactions on cell dynamics and function, as we demonstrate by identifying a mediator of CAF-TAM interactions - RARRES2, and its receptor CMKLR1. Thus, the complexity of the TME may be simplified by identifying small circuits, facilitating the development of strategies to modulate the TME.


Conflict of interest statement

The authors declare no competing interests.

Figures

Fig. 1
Fig. 1. Network analysis reveals a hierarchy of interactions with a dominant CAF-TAM circuit in the breast tumor microenvironment.
a UMAP visualization of the main cell clusters in the breast TME in human scRNA-seq data from 32 patients. b Heatmap of interaction strengths between pairs of cells based on cumulative ligand-receptor interaction scores using CellChat applied to the scRNA-seq data of (a). c Illustration of the structure of the network based on the analysis in (b) shows hierarchy (the root node was chosen as the node with the highest weighted outdegree). Arrow width is proportional to the interaction score. d Network motif analysis of all 7 possible two-cell circuit patterns, tested for abundance relative to randomized degree-preserving networks (bootstrapping n = 10,000, see Methods). The dashed line represents a 0.05 p-value threshold. e The top three two-cell interaction subgraphs scored by the average weight all include CAFs. f Network motif analysis of the 13 possible three-cell-circuit patterns. The dashed line represents a 0.05 p-value threshold. g The top three scoring three-cell circuit subgraphs. h The three-cell circuit of CAFs, TAMs and cancer cells. Source data are provided as a Source Data file.
Fig. 2
Fig. 2. Isolation of the macrophage-fibroblast circuit in-vitro allows analysis of its dynamics and reveals bistability with a viable steady-state at high cell numbers.
a Illustration of the experimental procedure. Macrophages and fibroblasts were isolated from mice, co-cultured at different ratios for 3 or 7 days in control or cancer CM, and counted by flow cytometry. b, c Experimental phase portraits of macrophage-fibroblast dynamics in-vitro. Arrow tails represent cell counts at day 3 of co-culture, and arrowheads represent cell counts at day 7 (starting from the same initial cell concentration). b Mono-cultured macrophages. c Fibroblasts co-cultured with macrophages are presented above the horizontal dashed line, mono-cultured fibroblasts are below the line. Fixed points are denoted by dots: “ON”: green; “OFF”: red; unstable: white; “ON-OFF” state: half-yellow. The following number of biologically independent samples was used: macrophages only: n = 5; macrophages with fibroblasts: n = 24. The positions of the fixed points were determined by the modeling of Fig. 3. d, e Quantification of the amount of fibrillar collagen deposited after 7 days of co-culture of macrophages and fibroblasts. Macrophages only: n = 4; fibroblasts and fibroblast-macrophage co-cultures: n = 3 biologically independent samples. Data are presented as mean. f Experimental phase portrait of macrophages grown in mono-culture in the presence of 4T1 cancer CM (red arrows), overlayed on the control phase portrait presented in (b) (gray arrows; performed in parallel to control media cultures); n = 10 biologically independent samples. g Experimental phase portrait of macrophage-fibroblast dynamics following in-vitro co-culture with 4T1 cancer CM (red arrows), overlayed on the control phase portrait presented in (c) (gray arrows). Fibroblasts co-cultured with macrophages are presented above the horizontal dashed line; mono-cultured fibroblasts are presented below the line (performed in parallel to control media co-cultures); n = 12 biologically independent samples for the cancer CM. h Macrophage cell numbers following three days of growth in mono-culture in the presence of Control or CM from normal mouse epithelial cells or from 4T1 cancer cells; with n = 8 biologically independent samples. P-value was calculated using one way ANOVA. Error bars represent ± SEM. bh All data are combined from at least three independent experiments. Source data are provided as a Source Data file.
Fig. 3
Fig. 3. Circuit interactions and dynamics inferred by mathematical modeling.
a, b Theoretical cell circuits with the model parameters: pFF - fibroblast autocrine loop; KF - fibroblast carrying capacity; rF - fibroblast removal rate; and pMF - paracrine effect of macrophages on fibroblasts. Analogous parameters for the macrophages are: removal rM; paracrine and autocrine interactions pFM and pMM, respectively; and carrying capacity KM. c Best fit values for the parameters of the fibroblast-macrophage circuits in control and cancer CM. The distribution of each parameter is presented by its median (circle), interquartile range (thick line), and 95% confidence interval (CI; thin line). P-values and CI were calculated by bootstrapping (n = 5000) and contrast distributions (see Methods). d, e Theoretical cell circuits with the mean value of each parameter for control and cancer CM. Inferred phase portraits showing the population dynamics of macrophages and fibroblasts in control (f) or cancer CM (g). Basins of attraction are indicated by color: in the control medium cells can flow to the “OFF” state (red dot) if they start in the red region or to the “ON” state (green dot) if they start in the green region. A population of fibroblasts that resides to the right of the unstable fixed point, denoted a, will flow to the “ON-OFF” state (half-yellow dot). In the cancer CM the flow in the red region changes (indicated with a yellow region) - it drains to the “OFF-ON” state (orange dot). hk Heatmaps indicating the predicted average growth rate of fibroblasts and macrophages in control and cancer CM. Red indicates growth and blue indicates shrinkage of the cell population. Dashed lines are the nullclines of the system; along them there is no change in the cell population.
Fig. 4
Fig. 4. RNA sequencing supports predicted changes in macrophage and fibroblast cell circuits in cancer-conditioned medium.
a, b Heatmaps showing hierarchical clustering of differentially expressed genes (DEGs; basemean >5; |LogFoldChange | > 1; FDR < 0.1). a An interaction model (medium and culture) was used to compare DEGs between macrophages mono-cultured (only) or co-cultured, with mammary fibroblasts in DMEM vs cancer CM. The mono-cultured macrophages in DMEM were collected at day 0 (since they cannot maintain themselves in DMEM for 7 days), and at day 7 in cancer CM. The co-cultured macrophages were collected after 7 days of co-culture with mammary fibroblasts, in either DMEM or cancer CM. Macrophages in DMEM: n = 3 biologically independent samples, macrophages in cancer CM: n = 4 biologically independent samples. b An interaction model (medium and culture) was used to compare DEGs between fibroblasts mono-cultured (only), or co-cultured, with macrophages in cancer CM vs. DMEM. Fibroblasts in DMEM: n = 3 biologically independent samples for each condition, Fibroblasts in cancer CM: only n = 2 biologically independent samples, co-cultured n = 4 biologically independent samples. c, d Pathway analysis of the macrophage clusters from (a) and fibroblast clusters from (b) was conducted using Metascape. Selected significant pathways are shown, see full list in Supplementary Data 2–3 (FDR < 0.05). e The ssGSEA score of the protumorigenic TAM signature was applied to the macrophage RNA-seq data. Same biological replicates as indicated in (a). f Flow cytometry analysis was conducted on macrophages to evaluate the expression of the protumorigenic marker CD206. The macrophages were stained after being mono-cultured in the presence of control medium, 4T1-cancer CM, or a 1:1 mix of cancer CM and CM from fibroblasts induced by cancer (see Methods). n = 9 biologically independent samples from a total of three separate experiments, each experiment was normalized to the control mean fluorescence intensity (MFI). e, f P-value was calculated using one-way ANOVA followed by Tukey’s multiple comparisons test. Error bars represent ± SEM. Same biological replicates as indicated in (a). g The ssGSEA scores of the iCAF,myCAF and apCAF signatures were applied to the fibroblast RNA-seq data. P-value was calculated using two-way ANOVA followed by Tukey’s multiple comparisons test. Error bars represent ± SEM. Same biological replicates as indicated in (b). Source data are provided as a Source Data file.
Fig. 5
Fig. 5. RARRES2 and its receptor CMKLR1 are part of the CAF-TAM signaling axis in breast cancer.
a Venn diagram of potential CAF-to-TAM ligands shared between breast cancer patient tumors and 4T1 tumors in mice based on the NicheNet ligand-receptor tool. b Heatmap representation of the expression of the 77 shared ligands from (a) in fibroblasts from the in vitro cell-circuit, based on bulk RNA-seq data from Fig. 4b. c, d qPCR of Rarres2 and Cmklr1 from fibroblasts and macrophages. mono-cultured or co-cultured in control or cancer CM for 72 h. Data are combined from at least three independent experiments. P-value was calculated using two-way ANOVA followed by Tukey’s multiple comparisons test. Error bars represent ±SEM. c Fibroblasts mono-cultured in control or in cancer CM n = 5, fibroblasts co-cultured in control n = 5 or in cancer CM n = 4 biologically independent samples. d Macrophages mono-cultured in control n = 4 or in cancer CM n = 9, macrophages co-cultured in control or in cancer CM n = 7 biologically independent samples. e RARRES2 secretion levels in the media were assessed by ELISA from CAF n = 5 and 4T1 n = 4 biological biologically independent samples. P-value was calculated using two-sided students’ t test, Error bars represent ± SEM. f Transwell migration assay of macrophages in the presence of control medium n = 10, or 4T1 cancer CM with n = 9 or without n = 12 recombinant RARRES2 for 24 h, n indicates biologically independent samples. Luminescence values were normalized to 4T1-CM in log2. Data are combined from at least three independent experiments. P-value was calculated using one-way ANOVA followed by Tukey’s multiple comparisons test. Error bars represent ± SEM. g Violin plot of RARRES2 expression based on human scRNA-seq of normal fibroblasts n = 17 versus CAFs n = 32. P-value was calculated using two-sided students’ t test. h RARRES2 expression in different clusters from human scRNA-seq data, including CAF subclusters (defined using markers shown in Supplementary Fig. 6a). i Linear regression between RARRES2 expression in fibroblasts and TAM signature in macrophages. Each dot represents one patient, based on human scRNA-seq. P-value was calculated using F-test for linear regression. j RARRES2 gene expression in breast cancer patients stratified by grade, high grade = grade 3, n = 21; low-grade = grade 1 and 2, n = 10 patients. P-value was calculated using two-sided students’ t test. Source data are provided as a Source Data file.

References

    1. Mao X, et al. Crosstalk between cancer-associated fibroblasts and immune cells in the tumor microenvironment: new findings and future perspectives. Mol. Cancer. 2021;20:131. - PMC - PubMed
    1. Binnewies M, et al. Understanding the tumor immune microenvironment (TIME) for effective therapy. Nat. Med. 2018;24:541–550. - PMC - PubMed
    1. Quail DF, Joyce JA. Microenvironmental regulation of tumor progression and metastasis. Nat. Med. 2013;19:1423–1437. - PMC - PubMed
    1. Davidson S, et al. Fibroblasts as immune regulators in infection, inflammation and cancer. Nat. Rev. Immunol. 2021;21:704–717. - PubMed
    1. Buechler MB, et al. Cross-tissue organization of the fibroblast lineage. Nature. 2021;593:575–579. - PubMed

Publication types