. 2023 Sep 19;13(1):15522.
doi: 10.1038/s41598-023-42041-0.

Uncertainty analysis of contagion processes based on a functional approach

Affiliations

Uncertainty analysis of contagion processes based on a functional approach

Dunia López-Pintado et al. Sci Rep. .

Abstract

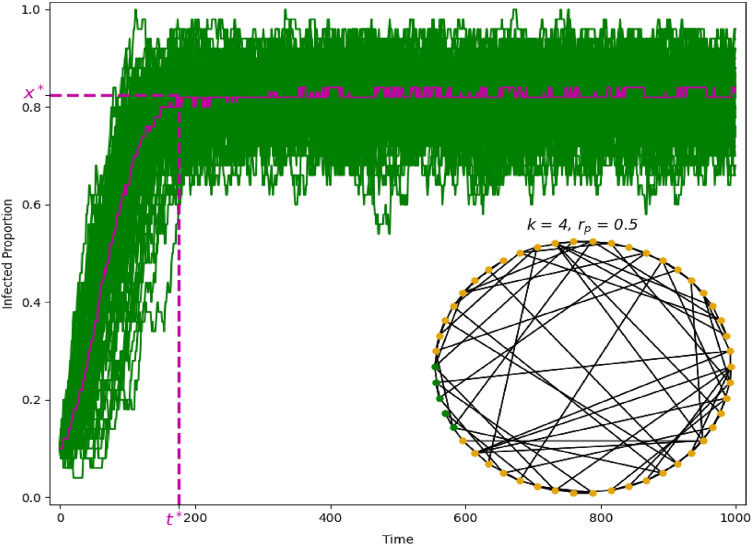
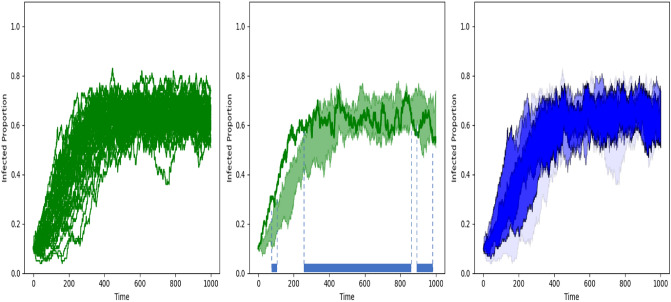
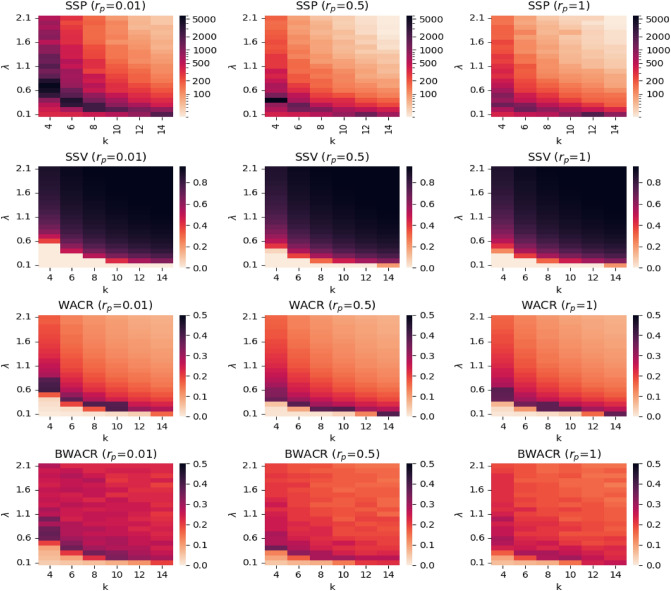
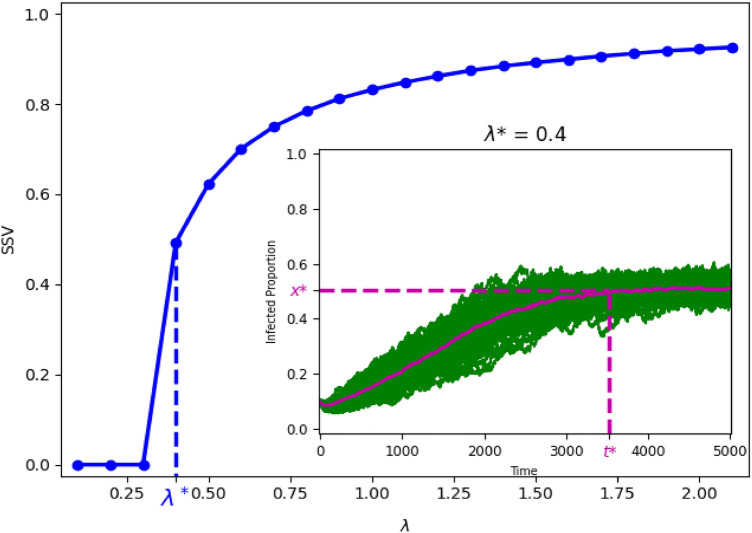
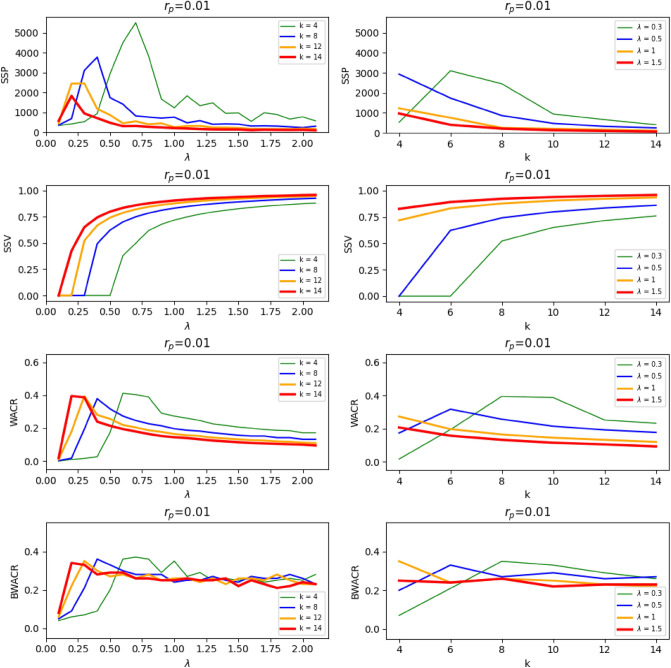
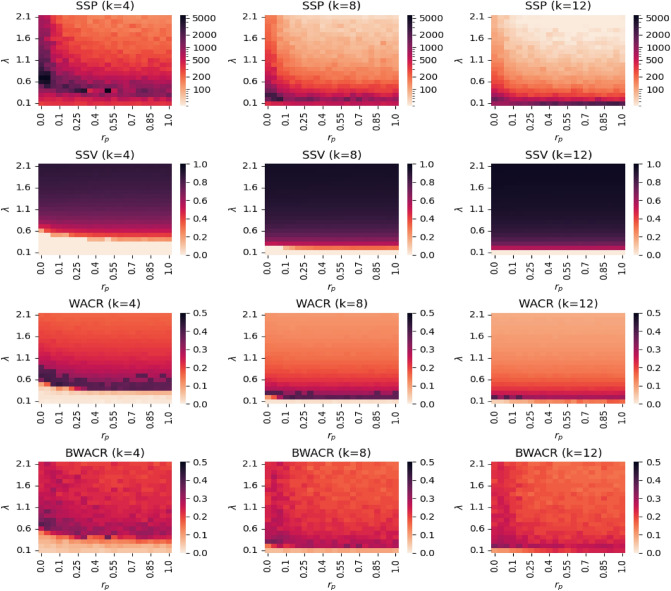
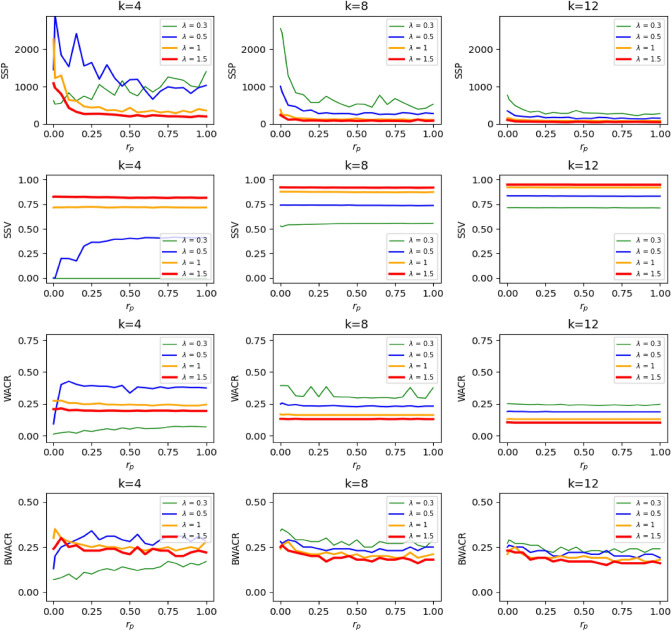
The spread of a disease, product or idea in a population is often hard to predict. We tend to observe one or few realizations of the contagion process and therefore limited information can be obtained for anticipating future similar events. The stochastic nature of contagion generates unpredictable outcomes throughout the whole course of the dynamics. This might lead to important inaccuracies in the predictions and to the over or under-reaction of policymakers, who tend to anticipate the average behavior. Through an extensive simulation study, we analyze properties of the contagion process, focusing on its unpredictability or uncertainty, and exploiting the functional nature of the data. In particular, we define a novel non-parametric measure of variance based on weighted depth-based central regions. We apply this methodology to the susceptible-infected-susceptible epidemiological model and small-world networks. We find that maximum uncertainty is attained at the epidemic threshold. The density of the network and the contagiousness of the process have a strong and complementary effect on the uncertainty of contagion, whereas only a mild effect of the network's randomness structure is observed.


Conflict of interest statement

The authors declare no competing interests.

Figures

Figure 1
Figure 1
A sample of infected proportion curves. The graph illustrates n=40 infected proportion curves simulated given a small-world network and the SIS model with λ=1. The corresponding network (inset) is formed by S=50 nodes, density k=4, randomness rp=0.5, and five concentrated initially infected nodes (colored in green). The point-wise median is represented, as well as the estimated steady state point t and steady state value x.
Figure 2
Figure 2
Left. Sample of curves. Middle. Visualization of how the modified band depth is calculated for the bold curve as the proportion of time such curve is in the band determined by two curves from the sample; the average of these proportions over all possible pairs of curves from the sample is the modified band depth. Right. Blue gradient representing the regions determined by the 25%, 50%, 75% and 100% deepest curves in the sample based on the modified band depth (MBD). See text for details.
Figure 3
Figure 3
Heatmaps of the steady state values and unpredictability. SSP, SSV, WACR and BWACR values (top, middle and bottom rows, respectively) as a function of λ and k at three levels of rp (left, middle and right columns, respectively). The darker the colour the higher the values. The SSP values are represented in logarithmic scale.
Figure 4
Figure 4
Representation of SSV as a function of λ in the case k=8 and rp=0.01. The value λ corresponds with the epidemic threshold and the situation of maximum uncertainty (regarding WACR and BWACR). The sample of proportion infected curves at λ is shown in the inset of the figure.
Figure 5
Figure 5
Left column. Representation of SSP, SSV, WACR and BWACR as a function of λ for k=4, 8, 12, and 14, and rp=0.01. Right column. Representation of SSP, SSV, WACR and BWACR as a function of k for λ=0.3, 0.5, 1, and 1.5, and rp=0.01.
Figure 6
Figure 6
Heatmaps of the steady state and unpredictability. SSP, SSV, WACR and BWACR values (top, middle and bottom rows, respectively) as a function of λ and  rp at three levels of k (left, middle and right columns, respectively). The darker the colour the higher the values. The SSP values are represented in logarithmic scale.
Figure 7
Figure 7
Uncertainty and network randomness. SSP, SSV, WACR and BWACR values as a function of rp given four values of λ and k = 4, 8 and 12 (left, middle and right columns, respectively).

Similar articles

References

    1. Watts DJ, Yariv L. The “new” science of networks. Ann. Rev. Sociol. 2004;30:243–270. doi: 10.1146/annurev.soc.30.020404.104342. - DOI
    1. Vega-Redondo, F. Complex Social Networks. Econometric Society Monographs (Cambridge University Press, 2007).
    1. Jackson MO, Yariv L. Diffusion of behavior and equilibrium properties in network games. Am. Econ. Rev. 2007;97:92–98. doi: 10.1257/aer.97.2.92. - DOI
    1. Ugander J, Backstrom L, Marlow C, Kleinberg J. Structural diversity in social contagion. Proc. Natl. Acad. Sci. 2012;109:5962–5966. doi: 10.1073/pnas.1116502109. - DOI - PMC - PubMed
    1. Pastor-Satorras R, Castellano C, Van Mieghem P, Vespignani A. Epidemic processes in complex networks. Rev. Modern Phys. 2015;87:925–979. doi: 10.1103/revmodphys.87.925. - DOI