. 2023 Nov;33(11):835-850.
doi: 10.1038/s41422-023-00874-4. Epub 2023 Sep 19.

Low glucose metabolite 3-phosphoglycerate switches PHGDH from serine synthesis to p53 activation to control cell fate

Affiliations

Low glucose metabolite 3-phosphoglycerate switches PHGDH from serine synthesis to p53 activation to control cell fate

Yu-Qing Wu et al. Cell Res. 2023 Nov.

Abstract

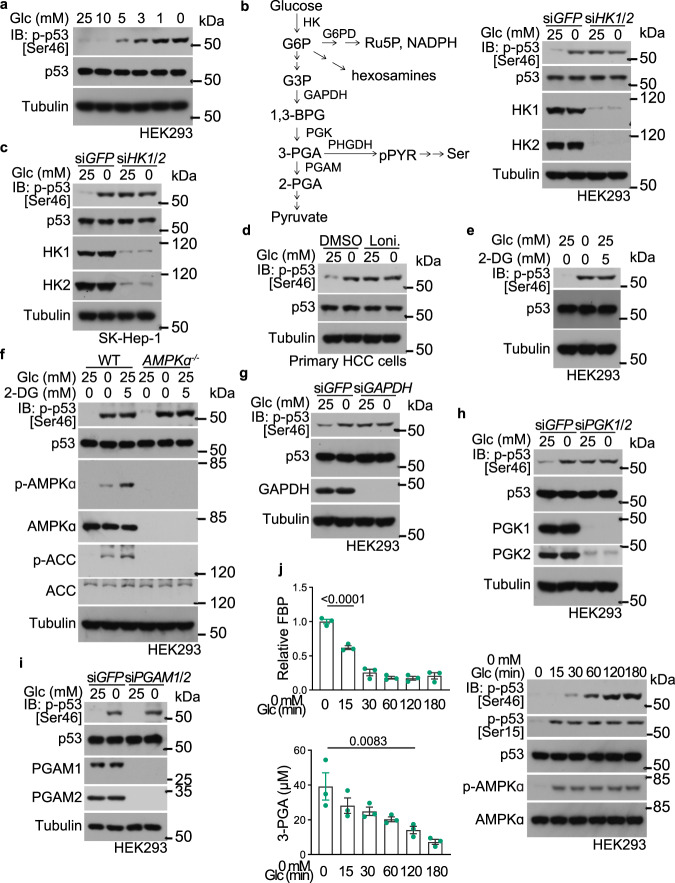
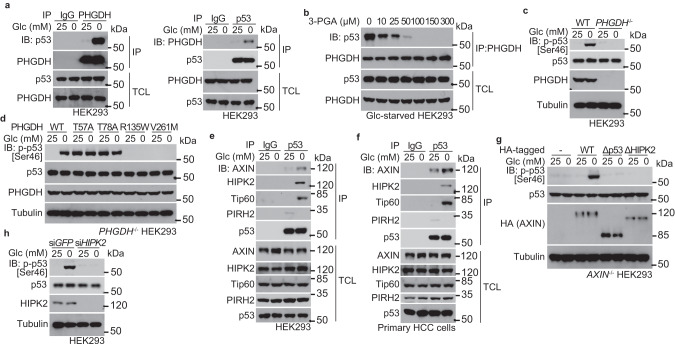
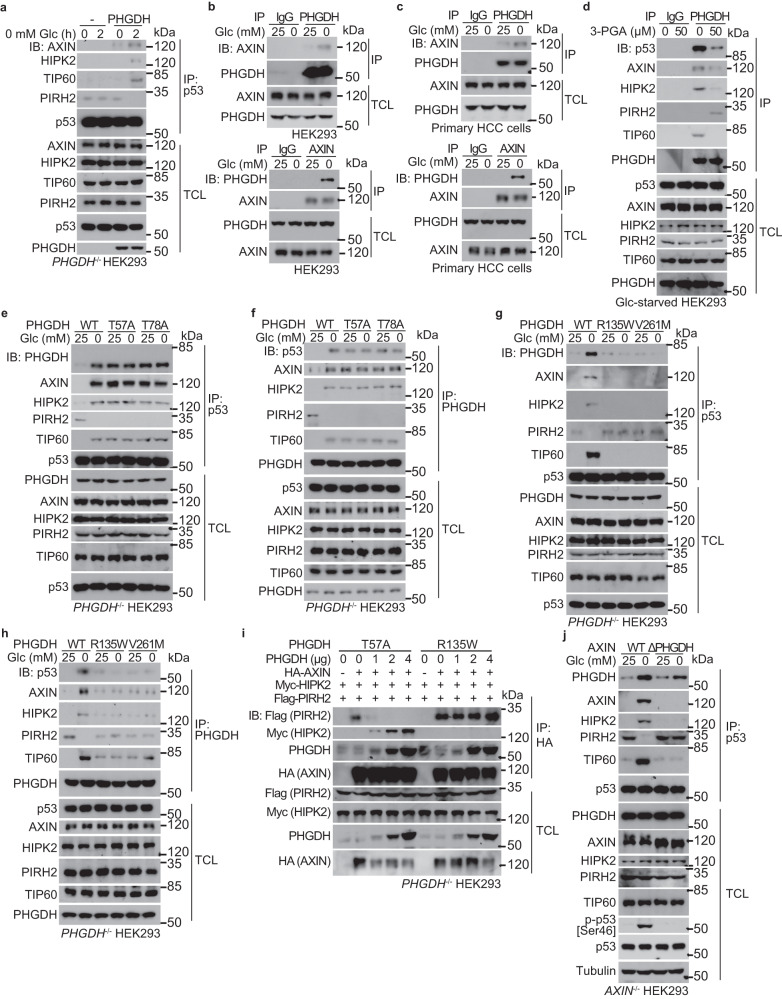
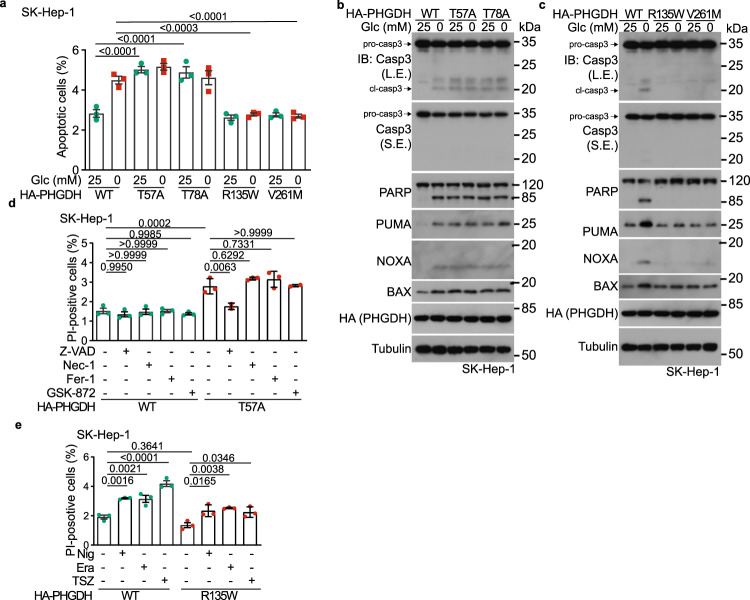
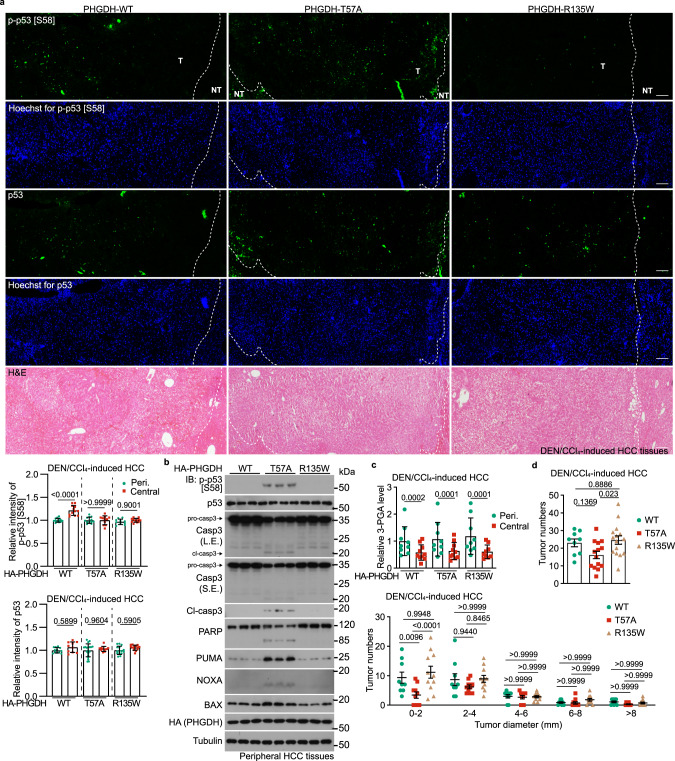
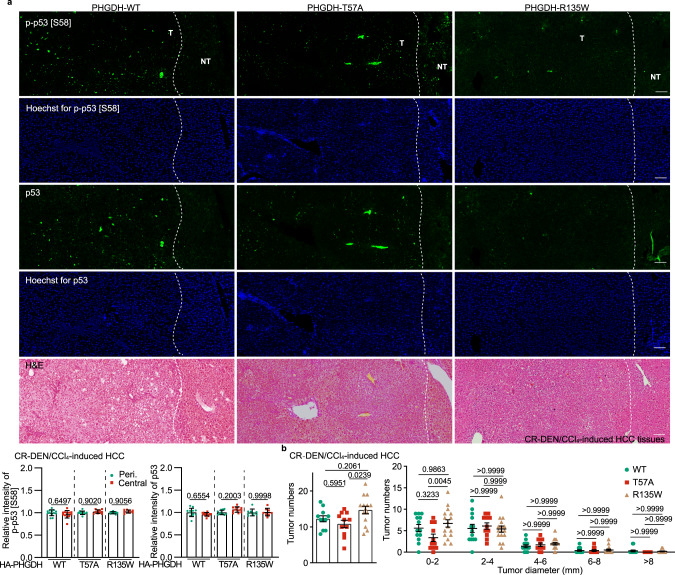
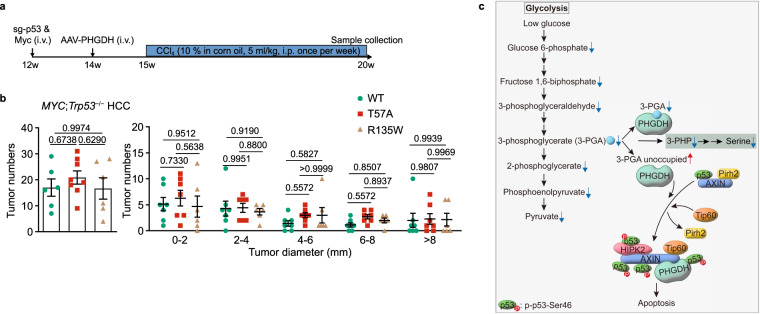
Glycolytic intermediary metabolites such as fructose-1,6-bisphosphate can serve as signals, controlling metabolic states beyond energy metabolism. However, whether glycolytic metabolites also play a role in controlling cell fate remains unexplored. Here, we find that low levels of glycolytic metabolite 3-phosphoglycerate (3-PGA) can switch phosphoglycerate dehydrogenase (PHGDH) from cataplerosis serine synthesis to pro-apoptotic activation of p53. PHGDH is a p53-binding protein, and when unoccupied by 3-PGA interacts with the scaffold protein AXIN in complex with the kinase HIPK2, both of which are also p53-binding proteins. This leads to the formation of a multivalent p53-binding complex that allows HIPK2 to specifically phosphorylate p53-Ser46 and thereby promote apoptosis. Furthermore, we show that PHGDH mutants (R135W and V261M) that are constitutively bound to 3-PGA abolish p53 activation even under low glucose conditions, while the mutants (T57A and T78A) unable to bind 3-PGA cause constitutive p53 activation and apoptosis in hepatocellular carcinoma (HCC) cells, even in the presence of high glucose. In vivo, PHGDH-T57A induces apoptosis and inhibits the growth of diethylnitrosamine-induced mouse HCC, whereas PHGDH-R135W prevents apoptosis and promotes HCC growth, and knockout of Trp53 abolishes these effects above. Importantly, caloric restriction that lowers whole-body glucose levels can impede HCC growth dependent on PHGDH. Together, these results unveil a mechanism by which glucose availability autonomously controls p53 activity, providing a new paradigm of cell fate control by metabolic substrate availability.


Conflict of interest statement

The authors declare no competing interests.

Figures

Fig. 1
Fig. 1. Low 3-PGA triggers phosphorylation of p53 at Ser46 (p-p53-Ser46).
a Glucose, below 6 mM, induces p-Ser46 levels of p53. HEK293 cells were incubated in medium containing different concentrations of glucose (Glc) for 2 h, followed by determination of levels of p-p53-Ser46 by immunoblotting. be Knockdown or inhibition of hexokinases, which impairs glycolysis, increases p-p53-Ser46. HEK293 (b, e), SK-Hep-1 (c) cells with knockdown of both HK1 and HK2, or human primary HCC cells (d), were glucose starved (b, c), or treated with 1 mM hexosekinase inhibitor lonidamine (Loni.; d), or with 5 mM 2-DG (e), all for 2 h, followed by immunoblotting to determine p-p53-Ser46. See also a schematic diagram of glycolysis and serine synthesis pathway on the left of b. f AMPK is not involved in p-p53-Ser46 induction in low glucose. HEK293 cells with knockout of both AMPKα1 and AMPKα2 were glucose starved or were treated with 5 mM 2-DG, for 2 h, followed by determination of p-p53-Ser46 by immunoblotting. gi Lack of glycolytic intermediate 3-PGA is responsible for inducing p-p53-Ser46. HEK293 cells with knockdown of GAPDH (g), PGK1 and PGK2 (h), or PGAM1 and PGAM2 (i), were glucose starved for 2 h, followed by immunoblotting for p-p53-Ser46. j Inverse correlation between 3-PGA and the levels of p-p53-Ser46. HEK293 cells were glucose starved for the indicated time durations, followed by determination of levels of 3-PGA and other glycolytic intermediates including fructose-1,6-bisphosphate (FBP; left panel; data are means ± SEM, n  =  3, with P values calculated by one-way ANOVA, followed by Tukey). Levels of p-p53-Ser46 were determined by immunoblotting, with p-ACC and p-AMPKα serving as indicators of AMPK activity (right panel). Experiments were performed three times.
Fig. 2
Fig. 2. PHGDH transmits low 3-PGA signal to Ser46 phosphorylation of p53.
a PHGDH interacts with p53. Cell lysates of HEK293 cells, regularly cultured or glucose starved for 2 h, were subjected to immunoprecipitation of endogenous PHGDH (left panel) or p53 (right panel), followed by immunoblotting of co-precipitated p53 (left panel) or PHGDH (right panel). TCL, total cell lysate. b Addition of 3-PGA to lysates of glucose-starved cells disrupts the PHGDH–p53 interaction. The 2-h-glucose-starved HEK293 cells were lysed, followed by addition of 3-PGA at indicated final concentrations into the lysates. Endogenous PHGDH was then immunoprecipitated, followed by immunoblotting with antibodies indicated. c PHGDH is required for p-p53-Ser46 induction in low glucose. HEK293 cells with knockout of PHGDH were glucose starved for 2 h, followed by immunoblotting to determine p-p53-Ser46. d Lack of occupancy of 3-PGA by PHGDH underlies the levels of p-p53-Ser46. PHGDH–/– HEK293 cells were re-introduced with PHGDH-T57A and PHGDH-T78A that are defective in binding to 3-PGA, or PHGDH-R135W and PHGDH-V261M that are constitutively occupied with 3-PGA, and were glucose starved for 2 h, followed by immunoblotting to determine levels of p-p53-Ser46. e, f Glucose starvation induces the formation of PHGDH–AXIN–TIP60–HIPK2–p53 complex. HEK293 cells (e) or human primary HCC cells (f) were glucose starved for 2 h, followed by immunoprecipitation of endogenous p53 and immunoblotting with antibodies indicated. g, h AXIN tethers the upstream kinase HIPK2 for phosphorylation of p53-Ser46 in low glucose. HEK293 cells with knockdown of HIPK2 (h), HEK293 cells with knockout of AXIN or with re-introduced AXIN truncation mutants defective in interacting with p53 (Δp53) or HIPK2 (ΔHIPK2) (g), were glucose starved for 2 h, followed by immunoblotting to determine p-p53-Ser46. Experiments were performed three times, except four times in c and d.
Fig. 3
Fig. 3. 3-PGA-unoccupied PHGDH promotes the formation of PHGDH–AXIN–HIPK2–p53 complex.
a PHGDH is required for the low glucose-induced complex formation with AXIN–HIPK2–p53 complex. PHGDH–/– HEK293 cells were re-introduced with PHGDH or vector control, and were glucose starved for 2 h, followed by immunoprecipitation of endogenous p53 and immunoblotting with antibodies indicated. bc Glucose starvation promotes the interaction between PHGDH and AXIN. HEK293 cells (b) or primary human HCC cells (c) were regularly cultured, or were glucose starved for 2 h, followed by immunoprecipitation of endogenous PHGDH (upper panel) or AXIN (lower panel) and immunoblotting for co-precipitated AXIN (upper panel) or PHGDH (lower panel). d 3-PGA dissociates the PHGDH–AXIN–HIPK2–p53 complex. The 2-h-glucose-starved HEK293 cells were lysed, followed by addition of 50 μM 3-PGA at indicated final concentrations into the lysates. Endogenous PHGDH was then immunoprecipitated, followed by immunoblotting. eh Non-occupation of 3-PGA underlies the formation of PHGDH with AXIN–p53–HIPK2 complex. HEK293 cells with PHGDH knockout were re-introduced with PHGDH-T57A and PHGDH-T78A (e, f), or PHGDH-R135W and PHGDH-V261M (g, h), and were glucose starved for 2 h, followed by immunoprecipitation of endogenous p53 (e, g) or PHGDH (f, h). i The 3-PGA-unoccupied PHGDH dissociates PIRH2 from and recruits HIPK2 to AXIN. HEK293T cells were transfected with 2 μg of HA-tagged AXIN, 2 μg of FLAG-tagged PIRH2, 2 μg of FLAG-tagged HIPK2, along with FLAG-tagged PHGDH at indicated amounts. Cells were then lysed, followed by immunoprecipitation of HA-tag. j AXIN interaction with PHGDH is required for the formation of PHGDH–AXIN–HIPK2–p53 complex and phosphorylation of p53-Ser46 in low glucose. HEK293 cells with AXIN knockout were re-introduced with full-length AXIN or AXIN truncation mutant defective in binding to PHGDH (ΔPHGDH), and were glucose starved for 2 h, followed by analyses of proteins co-precipitated with p53, and of the levels of p-p53-Ser46. Experiments were performed three times.
Fig. 4
Fig. 4. PHGDH mediates glucose starvation-induced apoptosis.
ac 3-PGA-unoccupied PHGDH induces apoptosis in SK-Hep-1 cells starved for glucose. Cells were infected with lentiviruses carrying HA-tagged PHGDH-T57A or PHGDH-T78A (a, b), or PHGDH-R135W or PHGDH-V261M (a, c) expressed under a doxycycline-inducible promoter. Cells were then incubated in RPMI 1640 medium or glucose-free RPMI 1640 medium, both containing doxycycline (100 ng/mL), for 8 h, followed by determining the levels of apoptotic cells via flow cytometry (a, see gating strategy for quantifying the populations of apoptotic cells in Supplementary information, Fig. S3a, and representative density plots in Supplementary information, Fig. S3b), and the levels of apoptotic markers by immunoblotting (b, c). Data in a are means ± SD, n  =  3, with P values calculated by two-way ANOVA, followed by Tukey. L.E., long exposure; S.E., short exposure. d, e PHGDH does not induce necroptosis, pyroptosis or ferroptosis in low glucose. SK-Hep-1 cells with inducible expression (as in a) of PHGDH-T57A (d) or PHGDH-R135W (e) were treated with 15 μM Necrostatin-1 (Nec-1; d), 0.75 μM GSK-872 (d), 0.5 μM Ferrostatin-1 (Fer-1; d), 20 μM Z-VAD (d), 10 nM Nigericin (Nig; e), 10 μM Erastin (Era; e), a combination of 10 IU/mL TNFα, 2.5 μM SM-164, and 10 μM Z-VAD (TSZ; e), all for 8 h, followed by determining the numbers of dead (PI-positive) cells via flow cytometry. Data are means ± SD, n = 3, with P values calculated by one-way ANOVA, followed by Tukey. See representative density plots in Supplementary information, Fig. S3h, i. Experiments were performed three times, except four times in a.
Fig. 5
Fig. 5. PHGDH mediates the inhibition of tumor growth in low glucose.
a, b 3-PGA binding of PHGDH controls apoptosis in liver tissues. Hepatic PHGDH mutant-expressing mice (established by injecting AAVs carrying individual PHGDH mutants) were treated with DEN plus CCl4, as depicted in Supplementary information, Fig. S4a to induce HCC, and the livers were excised, followed by determining the p-Ser58-p53 by immunohistochemistry (IHC) (a; data are means ± SD, n = 10–13 fields from 7 mice, with P values calculated by one-way ANOVA, followed by Dunnet; Peri., peripheral) or by immunoblotting (b). See also apoptotic markers in HCC tissues in b (immunoblots) and Supplementary information, Fig. S5a, b (IHC images). T, tumor; NT, non-tumor. The scale bars are 100 μm. c Apoptosis levels are inversely correlated with levels of 3-PGA in the regions of liver tissues. Peripheral and central regions of HCC tissues were homogenized, followed by determining levels of glycolytic intermediates via CE-MS. Data are means ± SD, n  =  18–24, with P values calculated by two-way ANOVA, followed by Tukey. See levels of other glycolytic intermediates in Supplementary information, Fig. S5d. d Lack of 3-PGA binding of PHGDH inhibits tumor growth. Statistics of total tumor numbers of each mouse (upper panel; shown as means ± SD, n  =  9–15, with P values calculated by one-way ANOVA, followed by Tukey), as well as the numbers of tumor in each size/diameter: 0–2 mm, 2–4 mm, 4–6 mm, 6–8 mm, or > 8 mm (lower panel; shown as means ± SD, n  =  9–11, with P values calculated by two-way ANOVA, followed by Tukey) in each genotype, were shown. Experiments were performed three times.
Fig. 6
Fig. 6. CR mimics the effects of PHGDH-T57A on HCC suppression.
a CR induces p-Ser58-p53 and apoptosis to an extent similar to PHGDH-T57A in HCC tissues. Mice with hepatic expression of wild-type PHGDH and PHGDH mutants were induced to develop HCC as in Fig. 5a, except that these mice were also subjected to CR starting at 16 weeks old. The level of p-Ser58-p53 was then determined by IHC (data are means ± SD, n = 8–13 fields from 7 mice, with P values calculated by one-way ANOVA, followed by Tukey). See also apoptotic markers in HCC tissues in Supplementary information, Fig. S6a. The scale bars are 100 μm. b CR mimics the effects of PHGDH-T57A on HCC development. Statistics of tumor numbers were determined and are shown as in Fig. 5d. Data are means ± SEM, n  =  11–14 (left) or 9–11 (right), with P values calculated by one-way ANOVA (left) or two-way (right) ANOVA, followed by Tukey. Experiments were performed three times.
Fig. 7
Fig. 7. PHGDH modulates HCC growth through p53.
a, b Liver-specific knockout of Trp53 abolishes the effects of PHGDH on apoptosis and HCC development. The MYC;Trp53−/− HCC mouse models with liver-specific expression of PHGDH mutants were established (a). Statistics of tumor numbers were determined and are shown in b (determined as in Fig. 5d; data are means ± SD, n  =  6–8 (left) or 6–7 (right), with P values calculated by one-way (left) or two-way (right) ANOVA, followed by Tukey). See also apoptotic markers of liver tissues from HCC mice in Supplementary information, Fig. S7a. c A schematic diagram depicting that PHGDH senses low 3-PGA to induce apoptosis in the control of cell fate. In low glucose, increased portion of PHGDH becomes unoccupied with 3-PGA, and displays a stronger affinity towards AXIN. As a result, TIP60 is recruited to AXIN, which helps dissociate PIRH2 from and promotes HIPK2 binding to AXIN. This leads to the formation of the AXIN–TIP60–HIPK2–p53 complex, where HIPK2 phosphorylates Ser46 of and activates p53 to induce apoptosis. Experiments were performed three times.

References

    1. Kruiswijk F, Labuschagne CF, Vousden KH. p53 in survival, death and metabolic health: a lifeguard with a licence to kill. Nat. Rev. Mol. Cell Biol. 2015;16:393–405. doi: 10.1038/nrm4007. - DOI - PubMed
    1. Hafner A, Bulyk ML, Jambhekar A, Lahav G. The multiple mechanisms that regulate p53 activity and cell fate. Nat. Rev. Mol. Cell Biol. 2019;20:199–210. doi: 10.1038/s41580-019-0110-x. - DOI - PubMed
    1. Kastenhuber ER, Lowe SW. Putting p53 in context. Cell. 2017;170:1062–1078. doi: 10.1016/j.cell.2017.08.028. - DOI - PMC - PubMed
    1. Labuschagne CF, Zani F, Vousden KH. Control of metabolism by p53 - cancer and beyond. Biochim. Biophys. Acta Rev. Cancer. 2018;1870:32–42. doi: 10.1016/j.bbcan.2018.06.001. - DOI - PMC - PubMed
    1. Liu Y, Tavana O, Gu W. p53 modifications: exquisite decorations of the powerful guardian. J. Mol. Cell Biol. 2019;11:564–577. doi: 10.1093/jmcb/mjz060. - DOI - PMC - PubMed

Publication types