

Enhanced spectroelectrochemistry with lossy-mode resonance optical fiber sensor
- PMID: 37726408
- PMCID: PMC10509163
- DOI: 10.1038/s41598-023-42853-0
Enhanced spectroelectrochemistry with lossy-mode resonance optical fiber sensor
Abstract
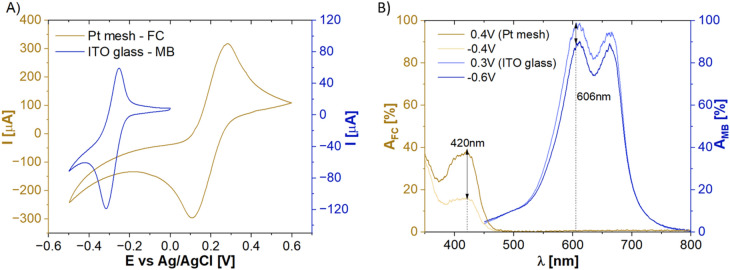
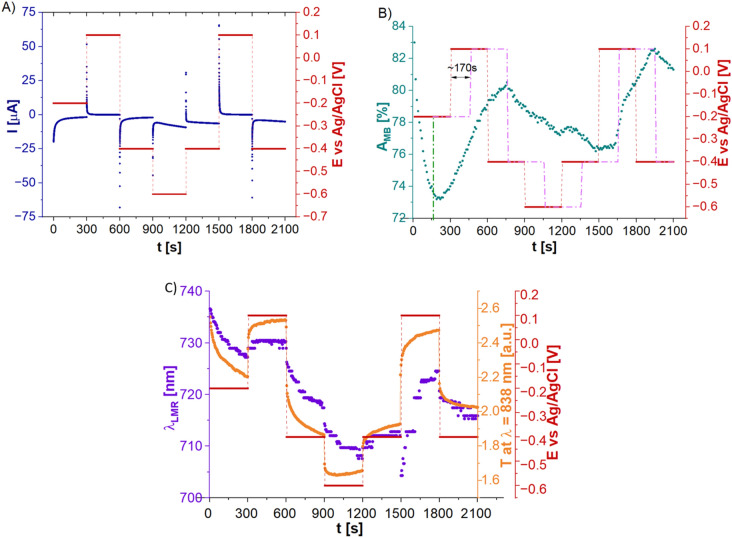
Spectroelectrochemical (SEC) measurements play a crucial role in analytical chemistry, utilizing transparent or semitransparent electrodes for optical analysis of electrochemical (EC) processes. The EC readout provides information about the electrode's state, while changes in the transmitted optical spectrum help identify the products of EC reactions. To enhance SEC measurements, this study proposes the addition of optical monitoring of the electrode. The setup involves using a polymer-clad silica multimode fiber core coated with indium tin oxide (ITO), which serves as both the electrode and an optical fiber sensor. The ITO film is specifically tailored to exhibit the lossy-mode resonance (LMR) phenomenon, allowing for simultaneous optical monitoring alongside EC readouts. The LMR response depends on the properties of the ITO and the surrounding medium's optical properties. As a result, the setup offers three types of interrogation readouts: EC measurements, optical spectrum analysis corresponding to the volume of the analyte (similar to standard SEC), and LMR spectrum analysis reflecting the state of the sensor/electrode surface. In each interrogation path, cyclic voltammetry (CV) experiments were conducted individually with two oxidation-reduction reaction (redox) probes: potassium ferricyanide and methylene blue. Subsequently, simultaneous measurements were performed during chronoamperometry (CA) with the sensor, and the cross-correlation between the readouts was examined. Overall, this study presents a novel and enhanced SEC measurement approach that incorporates optical monitoring of the electrode. It provides a comprehensive understanding of EC processes and enables greater insights into the characteristics of the analyte.
© 2023. Springer Nature Limited.
Conflict of interest statement
The authors declare no competing interests.
Figures


References
-
- Jeffery GH, Basset J, Mendham J, Denney RC. Textbook of Quantitative Chemical Analysis. 5. Uk: Wiley; 1990.
-
- Chiavaioli F, et al. Ultrahigh sensitive detection of tau protein as alzheimer’s biomarker via microfluidics and nanofunctionalized optical fiber sensors. Adv. Photon. Res. 2022;3(11):2200044. doi: 10.1002/adpr.202200044. - DOI
-
- Moro G, Chiavaioli F, Liberi S, Zubiate P, Del Villar I, Angelini A, De Wael K, Baldini F, Moretto LM, Giannetti A. Nanocoated fiber label-free biosensing for perfluorooctanoic acid detection by lossy mode resonance. Results Opt. 2021;5:100123. doi: 10.1016/j.rio.2021.100123. - DOI
Grants and funding
LinkOut - more resources
Full Text Sources
Research Materials
