. 2023 Nov;20(11):1328-1338.
doi: 10.1038/s41423-023-01083-0. Epub 2023 Sep 19.

Correlative CD4 and CD8 T-cell immunodominance in humans and mice: Implications for preclinical testing

Affiliations

Correlative CD4 and CD8 T-cell immunodominance in humans and mice: Implications for preclinical testing

Tertuliano Alves Pereira Neto et al. Cell Mol Immunol. 2023 Nov.

Erratum in

Abstract

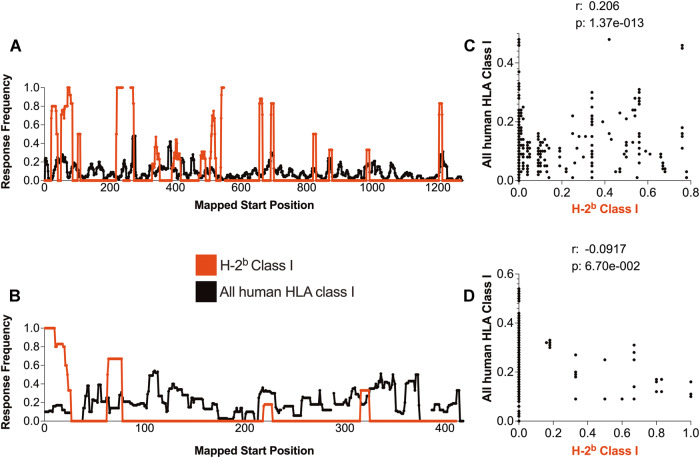
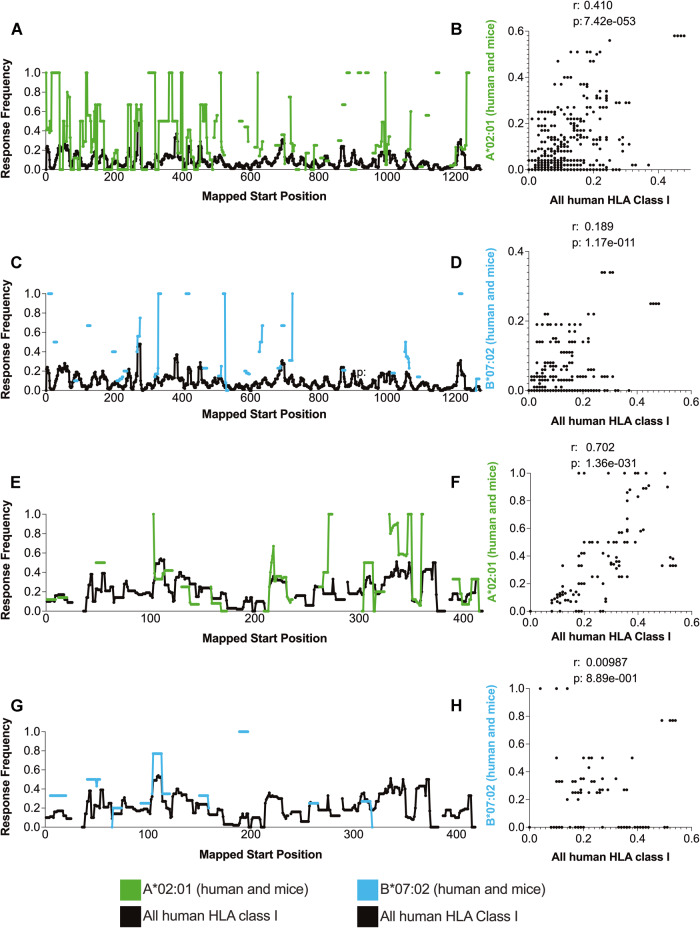
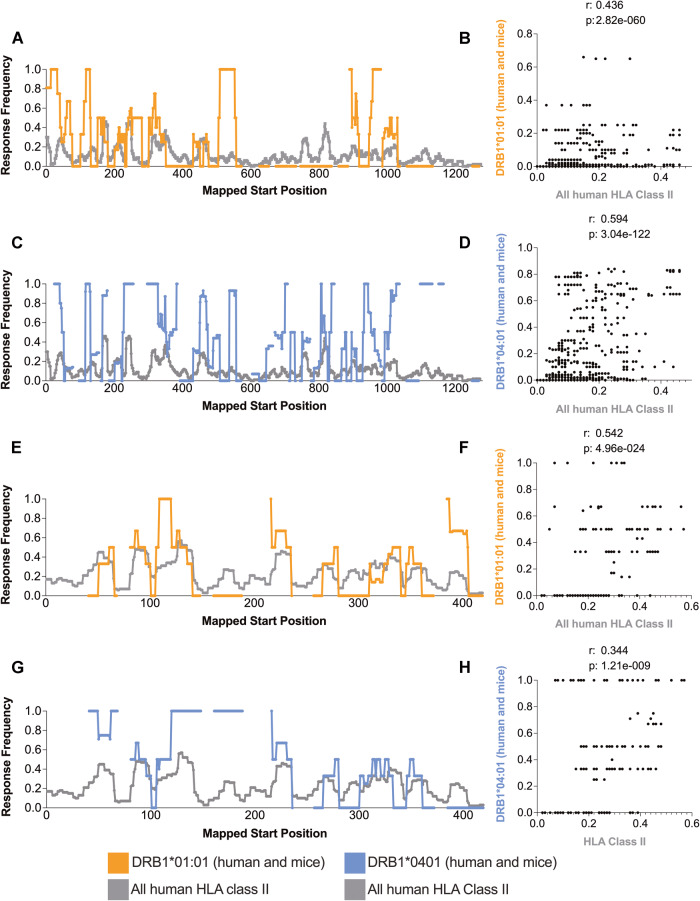
Antigen-specific T-cell recognition is restricted by Major Histocompatibility Complex (MHC) molecules, and differences between CD4 and CD8 immunogenicity in humans and animal species used in preclinical vaccine testing are yet to be fully understood. In this study, we addressed this matter by analyzing experimentally identified epitopes based on published data curated in the Immune Epitopes DataBase (IEDB) database. We first analyzed SARS-CoV-2 spike (S) and nucleoprotein (N), which are two common targets of the immune response and well studied in both human and mouse systems. We observed a weak but statistically significant correlation between human and H-2b mouse T-cell responses (CD8 S specific (r = 0.206, p = 1.37 × 10⁻¹³); CD4 S specific (r = 0.118, p = 2.63 × 10⁻⁵) and N specific (r = 0.179, p = 2.55 × 10⁻⁴)). Due to intrinsic differences in MHC molecules across species, we also investigated the association between the immunodominance of common Human Leukocyte Antigen (HLA) alleles for which HLA transgenic mice are available, namely, A*02:01, B*07:02, DRB1*01:01, and DRB1*04:01, and found higher significant correlations for both CD8 and CD4 (maximum r = 0.702, p = 1.36 × 10⁻³¹ and r = 0.594, p = 3.04-122, respectively). Our results further indicated that some regions are commonly immunogenic between humans and mice (either H-2b or HLA transgenic) but that others are human specific. Finally, we noted a significant correlation between CD8 and CD4 S- (r = 0.258, p = 7.33 × 10²¹) and N-specific (r = 0.369, p = 2.43 × 10¹⁴) responses, suggesting that discrete protein subregions can be simultaneously recognized by T cells. These findings were confirmed in other viral systems, providing general guidance for the use of murine models to test T-cell immunogenicity of viral antigens destined for human use.

Keywords: Animal testing; HLA; SARS-CoV-2; T cells; Vaccine.


Conflict of interest statement

AS is a consultant for AstraZeneca Pharmaceuticals, Calyptus Pharmaceuticals, Inc, Darwin Health, EmerVax, EUROIMMUN, F. Hoffman-La Roche Ltd, Fortress Biotech, Gilead Sciences, Granite bio., Gritstone Oncology, Guggenheim Securities, Moderna, Pfizer, RiverVest Venture Partners, and Turnstone Biologics. AG is a consultant for Pfizer. LJI has filed for patent protection for various aspects of T-cell epitope and vaccine design work. JS and TAPN declare no conflicts of interest.

Figures

Fig. 1
Fig. 1
SARS-CoV-2 S and N antigen immunodominance patterns for class I restricted epitopes in humans and H-2b mice. The response frequency of murine (H-2b; red) and human (black) class I-restricted epitopes for S (A) and N (B) SARS-CoV-2 antigens were calculated using the ImmunomeBrowser tool available at IEDB. Spearman’s correlations between mouse and human data are also shown for S (C) and N (D)
Fig. 2
Fig. 2
SARS-CoV-2 S and N antigen immunodominance patterns for class II restricted epitopes in humans and H-2b mice. The response frequency of murine (H-2b; maroon) and human (gray) class II-restricted epitopes for S (A) and N (B) SARS-CoV-2 antigens were calculated using the ImmunomeBrowser tool available at IEDB. Spearman’s correlations between mouse and human data are also shown for S (C) and N (D)
Fig. 3
Fig. 3
Comparative dominance of HLA A*02:01 and HLA B*07:02 epitopes over general HLA class I in SARS-CoV-2 S and N antigens. The response frequency of human nonspecific HLA class I (black) and transgenic mouse HLA class I A*02:01 (green) and B*07:02 (turquoise) epitopes for S (A, B) and N (C, D) SARS-CoV-2 antigens were calculated using the ImmunomeBrowser tool available at IEDB. Spearman’s correlations between mouse and human data are also shown for S (E, G) and N (F, H)
Fig. 4
Fig. 4
Relative dominance of HLA DRB1*01:01 and HLA DRB1*04:01 epitopes versus general HLA class II in SARS-CoV-2 S and N antigens. The response frequency of human nonspecific HLA class II (gray) and transgenic mouse HLA class II DRB1*01:01 (orange) and DRB1*04:01 (purple) epitopes for S (A, B) and N (C, D) SARS-CoV-2 antigens were calculated using the ImmunomeBrowser tool available at IEDB. Spearman’s correlations between mouse and human data are also shown for S (E, G) and N (F, H)
Fig. 5
Fig. 5
Correlation between reactivity patterns of class I and class II epitopes in human HLA data SARS-CoV-2 S and N antigens. The response frequency of human nonspecific HLA class I (black) and class II (gray) for S (A) and N (B) SARS-CoV-2 antigens were calculated using the ImmunomeBrowser tool available at IEDB. Spearman’s correlations between mouse and human data are also shown for S (C) and N (D)
Fig. 6
Fig. 6
Differences in correlation coefficient (R) as a function of class I and class II restrictions. The R coefficient for each protein was obtained by comparing selected class I and class II human alleles or murine H2b haplotypes to the global human HLA of the corresponding class which is shown in Table 1. Differences in the distribution of values among the different groups were assessed using the Mann‒Whitney test. Each dot corresponds to the correlation coefficient of one viral antigen. Black dots: (A) A*02:01 (B) DRB1*01:01, gray dots: (A) B*07:02 (B) DRB1*04:01, white dots: (A, B) H-2b mouse haplotypes. *p < 0.05; **p < 0.01; ns not significant

References

    1. Rydyznski Moderbacher C, Ramirez SI, Dan JM, Grifoni A, Hastie KM, Weiskopf D, et al. Antigen-specific adaptive immunity to SARS-CoV-2 in Acute COVID-19 and associations with age and disease severity. Cell. 2020;183:996–1012.e19. doi: 10.1016/j.cell.2020.09.038. - DOI - PMC - PubMed
    1. Tan AT, Linster M, Tan CW, Le Bert N, Chia WN, Kunasegaran K, et al. Early induction of functional SARS-CoV-2-specific T cells associates with rapid viral clearance and mild disease in COVID-19 patients. Cell Rep. 2021;34:108728. doi: 10.1016/j.celrep.2021.108728. - DOI - PMC - PubMed
    1. Tarke A, Potesta M, Varchetta S, Fenoglio D, Iannetta M, Sarmati L, et al. Early and polyantigenic CD4 T cell responses correlate with mild disease in acute COVID-19 donors. Int J Mol Sci. 2022;23:7155. doi: 10.3390/ijms23137155. - DOI - PMC - PubMed
    1. Kundu R, Narean JS, Wang L, Fenn J, Pillay T, Fernandez ND, et al. Cross-reactive memory T cells associate with protection against SARS-CoV-2 infection in COVID-19 contacts. Nature. Communications. 2022;13:80. - PMC - PubMed
    1. Scurr MJ, Lippiatt G, Capitani L, Bentley K, Lauder SN, Smart K, et al. Magnitude of venous or capillary blood-derived SARS-CoV-2-specific T cell response determines COVID-19 immunity. Nat Commun. 2022;13:5422. doi: 10.1038/s41467-022-32985-8. - DOI - PMC - PubMed

Publication types

Substances