. 2024 Jan;45(1):98-111.
doi: 10.1038/s41401-023-01155-x. Epub 2023 Sep 19.

Myeloid-derived growth factor suppresses VSMC dedifferentiation and attenuates postinjury neointimal formation in rats by activating S1PR2 and its downstream signaling

Affiliations

Myeloid-derived growth factor suppresses VSMC dedifferentiation and attenuates postinjury neointimal formation in rats by activating S1PR2 and its downstream signaling

Shuang Yang et al. Acta Pharmacol Sin. 2024 Jan.

Abstract

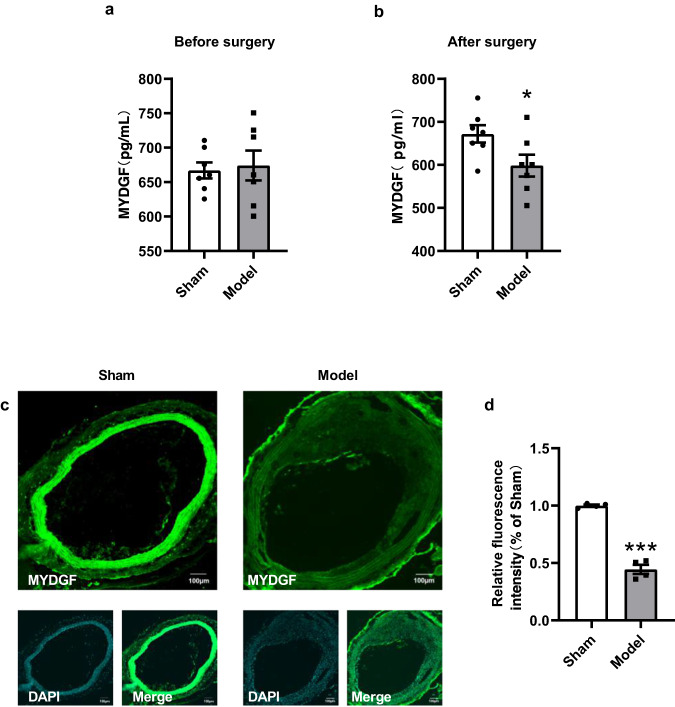
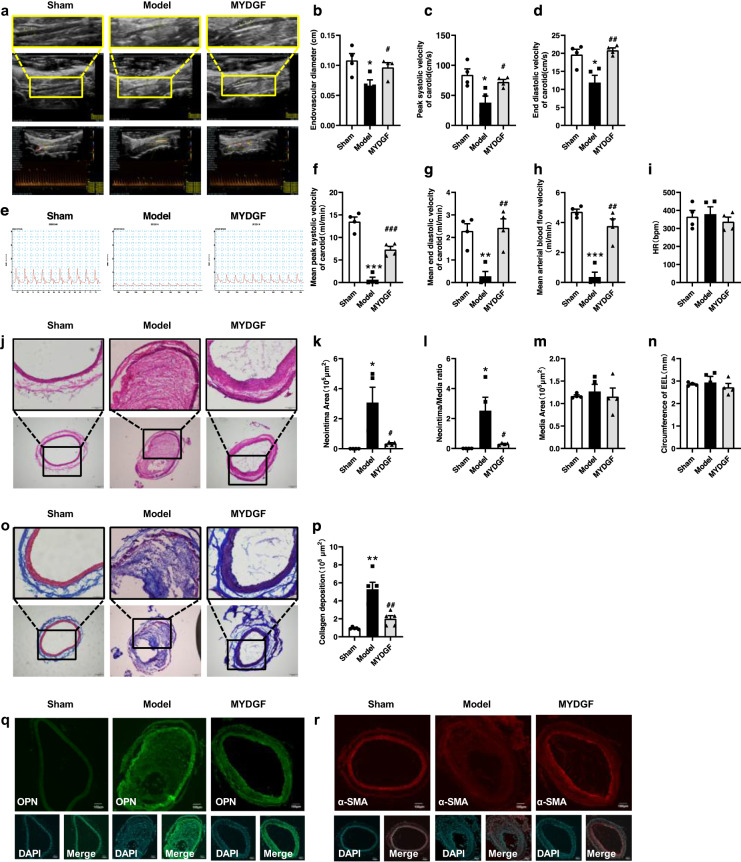
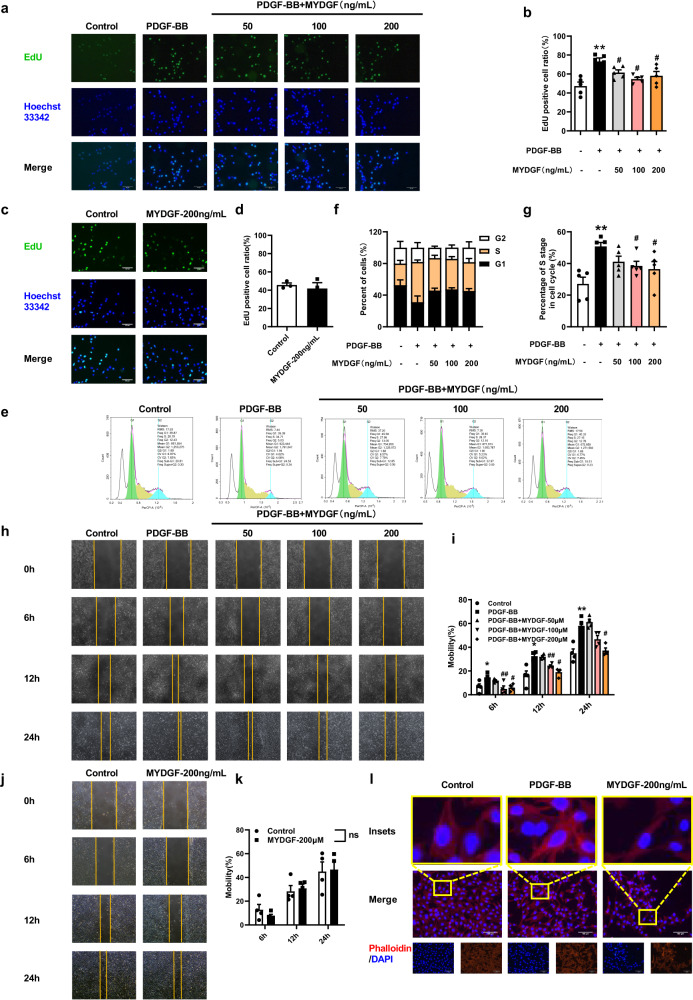
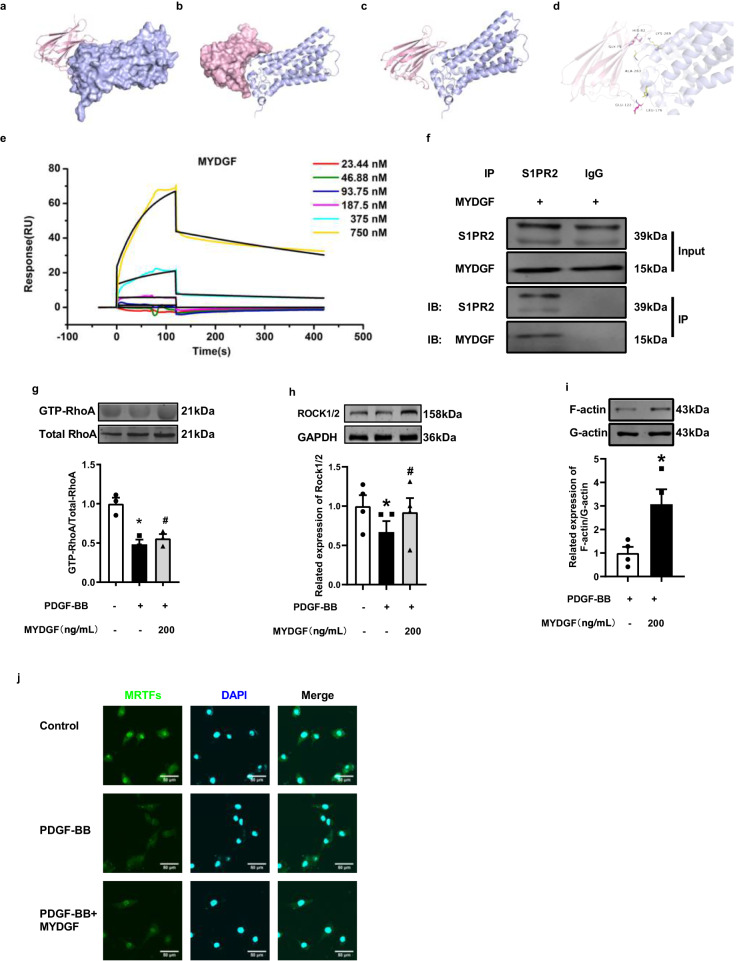
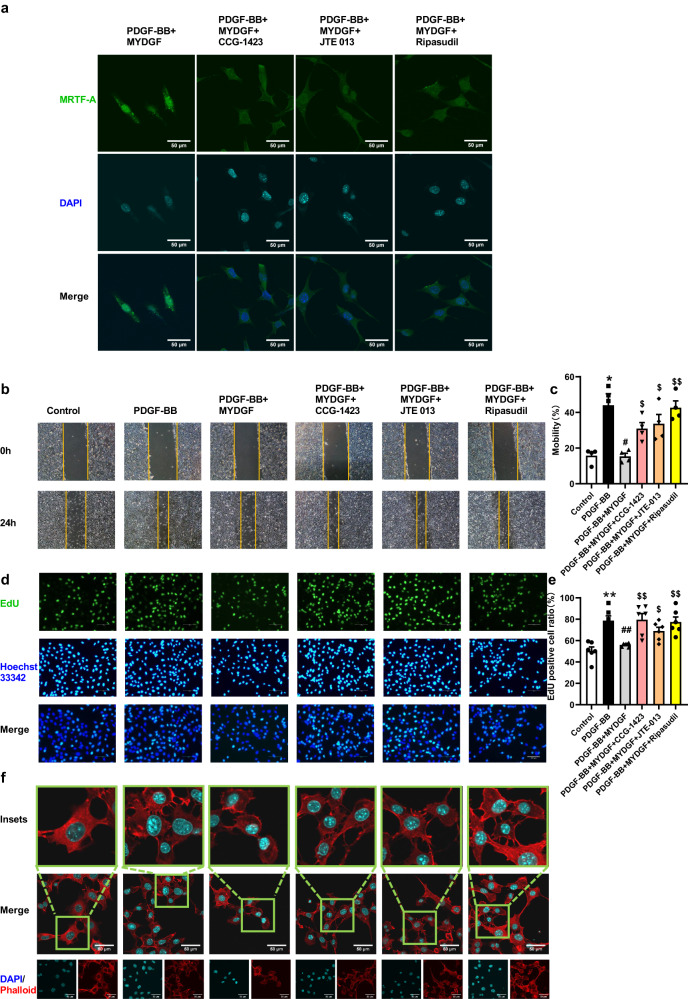
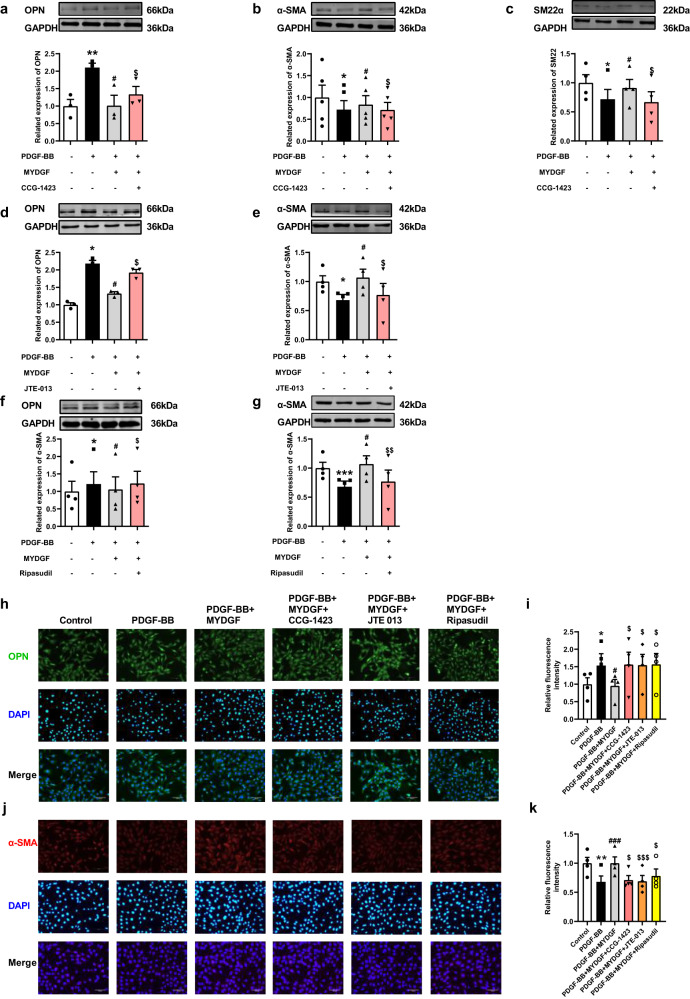
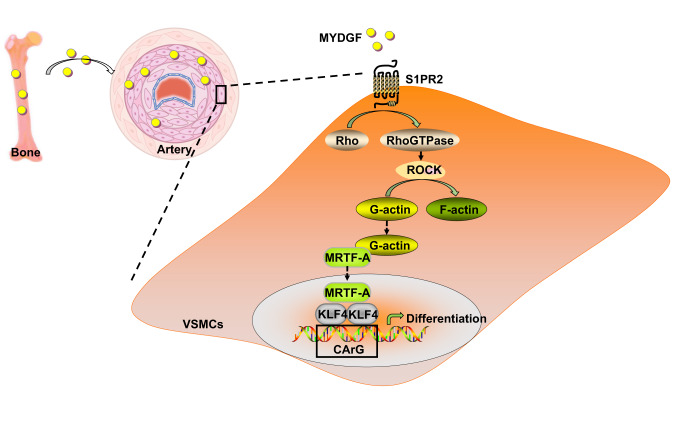
Restenosis after angioplasty is caused usually by neointima formation characterized by aberrant vascular smooth muscle cell (VSMC) dedifferentiation. Myeloid-derived growth factor (MYDGF), secreted from bone marrow-derived monocytes and macrophages, has been found to have cardioprotective effects. In this study we investigated the effect of MYDGF to postinjury neointimal formation and the underlying mechanisms. Rat carotid arteries balloon-injured model was established. We found that plasma MYDGF content and the level of MYDGF in injured arteries were significantly decreased after balloon injury. Local application of exogenous MYDGF (50 μg/mL) around the injured vessel during balloon injury markedly ameliorated the development of neointimal formation evidenced by relieving the narrow endovascular diameter, improving hemodynamics, and reducing collagen deposition. In addition, local application of MYDGF inhibited VSMC dedifferentiation, which was proved by reversing the elevated levels of osteopontin (OPN) protein and decreased levels of α-smooth muscle actin (α-SMA) in the left carotid arteries. We showed that PDGF-BB (30 ng/mL) stimulated VSMC proliferation, migration and dedifferentiation in vitro; pretreatment with MYDGF (50-200 ng/mL) concentration-dependently eliminated PDGF-BB-induced cell proliferation, migration and dedifferentiation. Molecular docking revealed that MYDGF had the potential to bind with sphingosine-1-phosphate receptor 2 (S1PR2), which was confirmed by SPR assay and Co-IP analysis. Pretreatment with CCG-1423 (Rho signaling inhibitor), JTE-013 (S1PR2 antagonist) or Ripasudil (ROCK inhibitor) circumvented the inhibitory effects of MYDGF on VSMC phenotypic switching through inhibiting S1PR2 or its downstream RhoA-actin monomers (G-actin) /actin filaments (F-actin)-MRTF-A signaling. In summary, this study proves that MYDGF relieves neointimal formation of carotid arteries in response to balloon injury in rats, and suppresses VSMC dedifferentiation induced by PDGF-BB via S1PR2-RhoA-G/F-actin-MRTF-A signaling pathway. In addition, our results provide evidence for cross talk between bone marrow and vasculature.

Keywords: MYDGF, Sphingosine-1-phosphate receptor 2; VSMC dedifferentiation; balloon injury; carotid artery; neointimal formation.


Conflict of interest statement

The authors declare no competing interests.

Figures

Fig. 1
Fig. 1. MYDGF decreases in rat plasma and carotid arteries after balloon injury.
ELISAs showed a no significant difference in MYDGF plasma content between groups before surgery, and b MYDGF plasma content was downregulated on d 7 after balloon injury compared with the control (n = 7 in each group). c Representative immunofluorescence images of left carotid arteries stained for MYDGF in control and model groups. Scale bar = 100 μm. d Quantitative data showing a marked increase in MYDGF expression in model groups compared with the control (n = 4 in each group). *P < 0.05 and ***P < 0.001 compared with the control group.
Fig. 2
Fig. 2. MYDGF alleviates abnormal blood flow velocity and histological remodeling of the carotid artery in rats with balloon injury.
a Representative ultrasonography images showing the endovascular linear diameter and blood velocity measurements of left common carotid arteries in control, model, and MYDGF groups. Top and bottom panels show blood vessel lumens and blood flow spectrograms at the sites of greatest narrowing, respectively. Quantitative analysis of the effect of MYDGF on b the endovascular diameter, c PSV, and d EDV of carotid arteries measured by Doppler ultrasonography (n = 4 in each group). e Representative blood velocity recordings obtained by the TS420 flowmeter. f The mean PSV, g mean EDV, h mean velocity, and i mean HR were measured in left common carotid arteries of rats (n = 4 in each group). j HE staining of left carotid arteries at d 28 after balloon injury. Scale bar = 200 μm. Quantitative data of the effect of MYDGF on k the neointimal area, l neointimal area/media area, m media area, and n circumference of the external elastic lamina (EEL) after balloon injury (n = 4 in each group). o Masson staining was performed in left common carotid arteries at d 28 after balloon injury. Blue areas indicate collagen deposition. Scale bar = 200 μm. p Quantitative data showing a marked increase in collagen deposition in model groups compared with controls. MYDGF strongly prevented collagen accumulation after balloon injury (n = 4 in each group). q Representative immunofluorescence images of left carotid arteries stained for MYDGF in control, model, and MYDGF groups. Scale bar = 100 μm. n = 4 in each group. r Representative immunofluorescence images of left carotid arteries stained for α-SMA in control, model, and MYDGF groups. Scale bar = 100 μm. n = 4 in each group. *P < 0.05, **P < 0.01, and ***P < 0.001 compared with the sham group. #P < 0.05 and ##P < 0.01, ###P < 0.001 compared with the model group.
Fig. 3
Fig. 3. MYDGF inhibits cell proliferation and migration stimulated by PDGF-BB in A10 VSMCs.
a Representative images of EdU staining in A10 VSMCs stimulated by 30 ng/mL PDGF-BB for 24 h with or without various concentrations of MYDGF (50, 100, and 200 ng/mL). Green indicates EdU staining, and blue indicates Hoechst 33342 staining. Scale bar = 100 μm. b Quantitative data of EdU staining revealed that PDGF-BB significantly increased cell proliferation of A10 VSMCs compared with untreated cells, which was suppressed by MYDGF pretreatment in a concentration-dependent manner (n = 5 in each group). c Representative images of EdU staining in A10 VSMCs treated with or without 200 ng/mL MYDGF. Scale bar = 100 μm. d Quantitative data of MYDGF showing no significant effect on cell proliferation of A10 VSMCs (n = 3 in each group). e Representative flow cytometric analysis of A10 VSMCs under various treatments. Green, yellow, and blue areas under the curve represent G1, S, and G2 phase cells, respectively. Quantitative data of f the distribution and g percentage of S phase A10 VSMCs under various treatments (n = 5 in each group). h Representative brightfield images of each group in the in vitro scratch assay. A10 VSMCs were treated with 30 ng/mL PDGF-BB in the absence or presence of MYDGF at various concentrations (50, 100, and 200 ng/mL). Cells images were obtained by microscopy in the indicated times. (i) Quantitative data of the scratch assay demonstrated that PDGF-BB had a strong migratory effect, and MYDGF dose-dependently inhibited the migration rate of PDGF-BB-treated cells (n = 4 in each group). j Representative brightfield images of the scratch assay of A10 VSMCs treated with or without 200 ng/mL MYDGF. k Quantitative data showed that MYDGF had no significant effect on cell migration (n = 4 in each group). l Representative immunofluorescence images of phalloidin (red) and DAPI (blue) staining in each group. A10 VSMCs were stimulated by PDGF-BB (30 ng/mL) for 15 min with or without MYDGF (200 ng/mL). Acquisition of lamellipodium-shaped morphology upon PDGF-BB exposure correlated to the phalloidin staining. MYDGF treatment abolished the PDGF-BB-induced phenotypic change. Scale bar = 100 μm (n = 4 in each group). *P < 0.05 and **P < 0.01 compared with control group. #P < 0.05 and ##P < 0.01 compared with the PDGF-BB group. ns indicates no statistical significance.
Fig. 4
Fig. 4. MYDGF maintains the differentiated phenotype of PDGF-BB-treated A10 VSMCs.
a OPN expression levels in A10 VSMCs under various treatments were measured by Western blotting. PDGF-BB significantly increased OPN expression compared with the control, which was suppressed by MYDGF administration (n = 4 in each group). b Relative expression of α-SMA in A10 VSMCs under various treatments was measured by Western blotting. PDGF-BB significantly decreased α-SMA expression compared with the control, which was suppressed by MYDGF treatment in a dose-dependent manner (n = 5 in each group). c Representative immunofluorescence images of OPN (green) and DAPI (blue) staining in A10 VSMCs of each group. Scale bar = 100 μm. d Quantitation of the relative fluorescence intensity of OPN in various cell groups. e Representative immunofluorescence images of α-SMA (green) and DAPI (blue) staining in A10 VSMCs of each group (n = 4 in each group). Scale bar = 100 μm f Quantitation of the relative fluorescence intensity of α-SMA in various cell groups (n = 4 in each group). *P < 0.05 and **P < 0.01 compared with the control group. #P < 0.05 and ##P < 0.01 compared with the PDGF-BB group.
Fig. 5
Fig. 5. Effect of MYDGF on the S1PR2-Rho-ROCK-F/G-actin-MRTF-A signaling pathway.
a, b Surface views of S1PR2 and MYDGF. c, d Molecular docking model contracted by Discovery Studio 3.5 revealed an interaction between MYDGF and S1PR2. e SPR analysis showed a direct interaction between S1PR2 and MYDGF. f Co-IP of MYDGF and S1PR2 in A10 VSMCs treated with or without 200 ng/mL MYDGF for 24 h (n = 3). Relative expression of g GTP-RhoA (n = 3), h ROCK1/2 (n = 4), and i F-actin (n = 4) in A10 VSMCs under various treatments was measured by Western blotting. MYDGF upregulated protein expression of GTP-RhoA, ROCK1/2, and F-actin compared with PDGF-BB groups. j Representative confocal images of nuclear MRTF-A in A10 VSMCs in control, PDGF-BB, and PDGF-BB + MYDGF groups. Scale bar = 50 μm (n = 3 in each group). *P < 0.05 compared with the control group and #P < 0.05 compared with the PDGF-BB group.
Fig. 6
Fig. 6. Blockade of S1PR2-Rho-ROCK signaling abolishes the inhibitory effect of MYDGF on cell proliferation and migration induced by PDGF-BB in A10 VSMCs.
a Representative images of MRTF-A staining in A10 VSMCs treated with CCG-1423 (Rho inhibitor; 0.1 μM), JTE-013 (S1PR2 inhibitor; 1 μM), or ripasudil (ROCK inhibitor; 0.1 μM) for 30 min before PDGF-BB and MYDGF treatment. Green: MRTF-A; blue: DAPI. Scale bar = 50 μm. b Representative brightfield images of each group in the in vitro scratch assay. A10 VSMCs were treated with CCG-1423, JTE-013, or ripasudil for 30 min before PDGF-BB and MYDGF treatment. c Quantitative data of the scratch assay demonstrated that PDGF-BB-treated cells showed a strong migration capacity. MYDGF inhibited the migration rate of PDGF-BB-treated cells, which was abolished by pretreatment with CCG-1423, JTE-013, or ripasudil (n = 4 in each group). d Representative images of EdU staining in A10 VSMCs treated with CCG-1423, JTE-013, or ripasudil for 30 min before PDGF-BB and MYDGF treatment. Scale bar = 100 μm. e Quantitative data of EdU staining revealed that PDGF-BB significantly increased cell proliferation of A10 VSMCs compared with untreated cells. MYDGF pretreatment suppressed PDGF-BB-treated cell proliferation, which was abolished by pretreatment with CCG-1423, JTE-013, or ripasudil (n = 6 in each group). f Representative confocal images of phalloidin (red) and DAPI (blue) staining in A10 VSMCs in each group. Acquisition of lamellipodium-shaped morphology upon PDGF-BB exposure correlated to phalloidin staining. MYDGF pretreatment inhibited the PDGF-BB-induced phenotypic change, which was abolished by pretreatment with CCG-1423, JTE-013, or ripasudil. Scale bar = 50 μm. *P < 0.05 and **P < 0.01 compared with the control group; #P < 0.05 and ##P < 0.01 compared with the PDGF-BB group; $P < 0.05 and $$P < 0.01 compared with the MYDGF group.
Fig. 7
Fig. 7. Blockade of the S1PR2-Rho-ROCK signaling pathway abolishes maintenance of the A10 VSMC differentiation phenotype by MYDGF.
Expression levels of a OPN (n = 3), b α-SMA (n = 5), and c SM22α (n = 4) in A10 VSMCs under various treatments were measured by Western blotting. PDGF-BB significantly increased OPN expression and decreased α-SMA and SM22α expression compared with controls. MYDGF treatment partially reversed the upregulation of OPN expression and the downregulation of α-SMA and SM22α expression induced by PDGF-BB, which were partially abolished by pretreatment with CCG-1423 (Rho inhibitor; 0.1 μM). Expression levels of d OPN (n = 3) and e α-SMA (n = 4) in A10 VSMCs under various treatments were measured by Western blotting. PDGF-BB significantly increased OPN expression and decreased α-SMA expression compared with controls. MYDGF treatment partially reversed the increase in OPN expression and the decrease in α-SMA expression induced by PDGF-BB, which were partially abolished by JTE-013 (S1PR2 inhibitor; 1 μM). Expression levels of f OPN (n = 4) and g α-SMA (n = 4) in A10 VSMCs under various treatments were measured by Western blotting. PDGF-BB significantly increased OPN expression and decreased α-SMA expression compared with controls. MYDGF treatment partially reversed the increase in OPN expression and the decrease in α-SMA expression induced by PDGF-BB, which were partially abolished by the pretreatment with ripasudil (ROCK inhibitor; 0.1 μM). h Representative immunofluorescence images of OPN (green) and DAPI (blue) staining in A10 VSMCs in each group. A10 VSMCs were treated with CCG-1423, JTE-013, or ripasudil for 30 min before PDGF-BB and MYDGF treatment. Scale bar = 100 μm. i Quantitation of the relative fluorescence intensity of OPN in various cell groups. The inhibitory effect of MYDGF on OPN expression induced by PDGF-BB was reversed by pretreatment with CCG-1423, JTE-013, or ripasudil (n = 3 in each group). j Representative immunofluorescence images of α-SMA (green) and DAPI (blue) staining in A10 VSMCs in each group. A10 VSMCs were treated with CCG-1423, JTE-013, or ripasudil (ROCK inhibitor; 0.1 μM) for 30 min before PDGF-BB and MYDGF treatment. Scale bar = 100 μm. k Quantitation of the relative fluorescence intensity of α-SMA in various cell groups. The inhibitory effect of MYDGF on the decrease in α-SMA expression was reversed by pretreatment with CCG-1423, JTE-013, ripasudil (n = 4 in each group). *P < 0.05 and **P < 0.01 compared with the control group. #P < 0.05 and ###P < 0.001 compared with the PDGF-BB group. $P < 0.05 and $$P < 0.01 compared with the MYDGF group.
Fig. 8
Fig. 8. Schematic diagram depicting the molecular mechanism of MYDGF in maintaining the smooth muscle cell differentiation phenotype.
Upon vessel injury, upregulated MYDGF activates S1PR2 in VSMCs, followed by activation of RhoA and downstream kinase ROCK. The activation of ROCK promotes polymerization of G-actin to F-actin. MRTF-A sequestered in the cytoplasm by direct binding to G-actin is released to the nucleus by polymerization of G-actin. Nuclear accumulation of MRTF-A triggers SMC-specific gene expression. Modulation of this signaling event maintains the VSMC differentiation phenotype, which counteracts the vessel injury and pathological stimulation.

Similar articles

Cited by

References

    1. Moussa ID, Mohananey D, Saucedo J, Stone GW, Yeh RW, Kennedy KF, et al. Trends and outcomes of restenosis after coronary stent implantation in the United States. J Am Coll Cardiol. 2020;76:1521–31. doi: 10.1016/j.jacc.2020.08.002. - DOI - PubMed
    1. Yang X, Yang Y, Guo J, Meng Y, Li M, Yang P, et al. Targeting the epigenome in in-stent restenosis: from mechanisms to therapy. Mol Ther Nucleic Acids. 2021;23:1136–60. doi: 10.1016/j.omtn.2021.01.024. - DOI - PMC - PubMed
    1. Giacoppo D, Alfonso F, Xu B, Claessen BEPM, Adriaenssens T, Jensen C, et al. Drug-coated balloon angioplasty versus drug-eluting stent implantation in patients with coronary stent restenosis. J Am Coll Cardiol. 2020;75:2664–78. doi: 10.1016/j.jacc.2020.04.006. - DOI - PubMed
    1. Giustino G, Colombo A, Camaj A, Yasumura K, Mehran R, Stone GW, et al. Coronary in-stent restenosis: JACC state-of-the-art review. J Am Coll Cardiol. 2022;80:348–72. doi: 10.1016/j.jacc.2022.05.017. - DOI - PubMed
    1. Zeng Z, Xia L, Fan S, Zheng J, Qin J, Fan X, et al. Circular RNA CircMAP3K5 acts as a microRNA-22-3p sponge to promote resolution of intimal hyperplasia via TET2-mediated smooth muscle cell differentiation. Circulation. 2021;143:354–71. doi: 10.1161/CIRCULATIONAHA.120.049715. - DOI - PubMed

LinkOut - more resources