

Pressure- vs. volume-controlled ventilation and their respective impact on dynamic parameters of fluid responsiveness: a cross-over animal study
- PMID: 37726649
- PMCID: PMC10507836
- DOI: 10.1186/s12871-023-02273-z
Pressure- vs. volume-controlled ventilation and their respective impact on dynamic parameters of fluid responsiveness: a cross-over animal study
Abstract
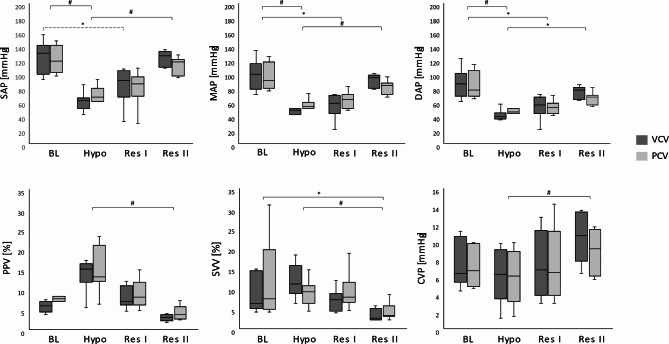
Background and goal of study: Pulse pressure variation (PPV) and stroke volume variation (SVV), which are based on the forces caused by controlled mechanical ventilation, are commonly used to predict fluid responsiveness. When PPV and SVV were introduced into clinical practice, volume-controlled ventilation (VCV) with tidal volumes (VT) ≥ 10 ml kg- 1 was most commonly used. Nowadays, lower VT and the use of pressure-controlled ventilation (PCV) has widely become the preferred type of ventilation. Due to their specific flow characteristics, VCV and PCV result in different airway pressures at comparable tidal volumes. We hypothesised that higher inspiratory pressures would result in higher PPVs and aimed to determine the impact of VCV and PCV on PPV and SVV.
Methods: In this self-controlled animal study, sixteen anaesthetised, paralysed, and mechanically ventilated (goal: VT 8 ml kg- 1) pigs were instrumented with catheters for continuous arterial blood pressure measurement and transpulmonary thermodilution. At four different intravascular fluid states (IVFS; baseline, hypovolaemia, resuscitation I and II), ventilatory and hemodynamic data including PPV and SVV were assessed during VCV and PCV. Statistical analysis was performed using U-test and RM ANOVA on ranks as well as descriptive LDA and GEE analysis.
Results: Complete data sets were available of eight pigs. VT and respiratory rates were similar in both forms. Heart rate, central venous, systolic, diastolic, and mean arterial pressures were not different between VCV and PCV at any IVFS. Peak inspiratory pressure was significantly higher in VCV, while plateau, airway and transpulmonary driving pressures were significantly higher in PCV. However, these higher pressures did not result in different PPVs nor SVVs at any IVFS.
Conclusion: VCV and PCV at similar tidal volumes and respiratory rates produced PPVs and SVVs without clinically meaningful differences in this experimental setting. Further research is needed to transfer these results to humans.
Keywords: Fluid responsiveness; Fluid therapy; Hemodynamic monitoring; Positive pressure respiration; Stroke volume.
© 2023. BioMed Central Ltd., part of Springer Nature.
Conflict of interest statement
D.A.R. provides scientific advisory services for Getinge and Edwards. All other authors declare that they do not have any conflicts of interest related to this study.
Figures

References
Publication types
MeSH terms
LinkOut - more resources
Full Text Sources
Research Materials
