. 2023 Sep 19;21(1):639.
doi: 10.1186/s12967-023-04469-w.

Brahma-related gene 1 acts as a profibrotic mediator and targeting it by micheliolide ameliorates peritoneal fibrosis

Affiliations

Brahma-related gene 1 acts as a profibrotic mediator and targeting it by micheliolide ameliorates peritoneal fibrosis

Shuting Li et al. J Transl Med. .

Abstract

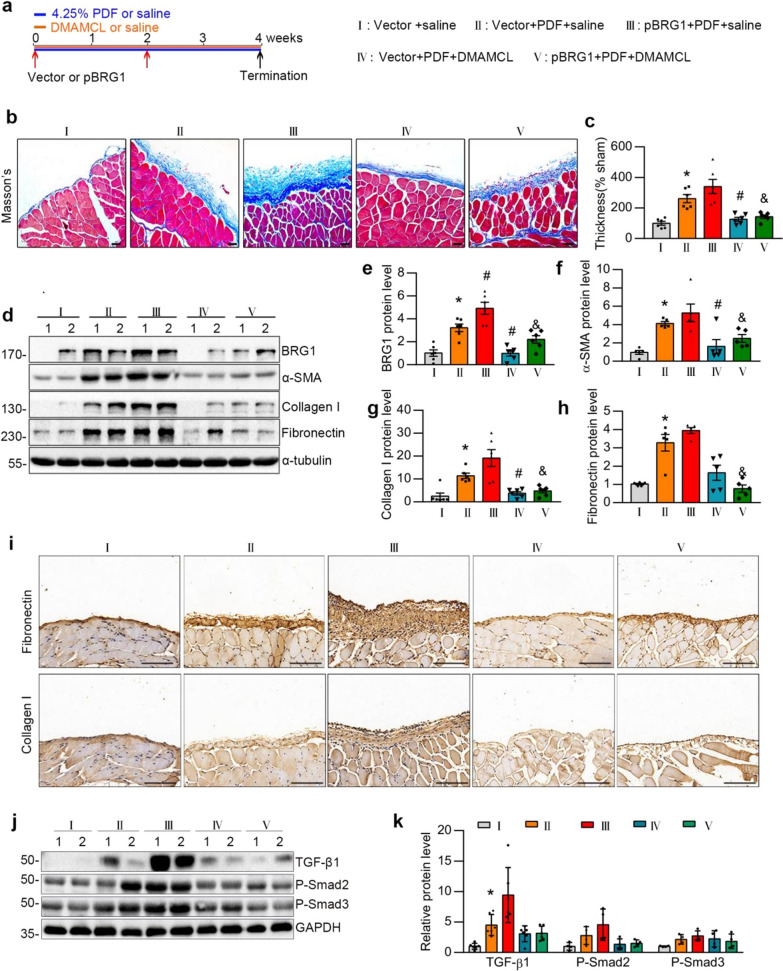
Background: Progressive peritoneal fibrosis is a worldwide public health concern impacting patients undergoing peritoneal dialysis (PD), yet there is no effective treatment. Our previous study revealed that a novel compound, micheliolide (MCL) inhibited peritoneal fibrosis in mice. However, its mechanism remains unclear. Brahma-related gene 1 (BRG1) is a key contributor to organ fibrosis, but its potential function in PD-related peritoneal fibrosis and the relationship between MCL and BRG1 remain unknown.

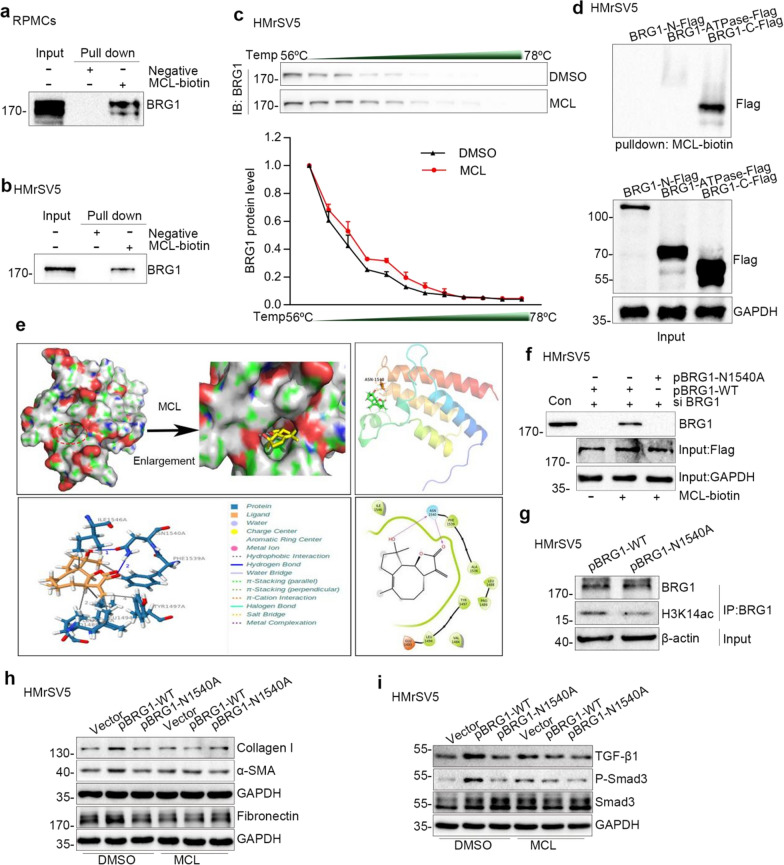
Methods: The effects of MCL on BRG1-induced fibrotic responses and TGF-β1-Smads pathway were examined in a mouse PD model and in vitro peritoneal mesothelial cells. To investigate the targeting mechanism of MCL on BRG1, coimmunoprecipitation, MCL-biotin pulldown, molecular docking and cellular thermal shift assay were performed.

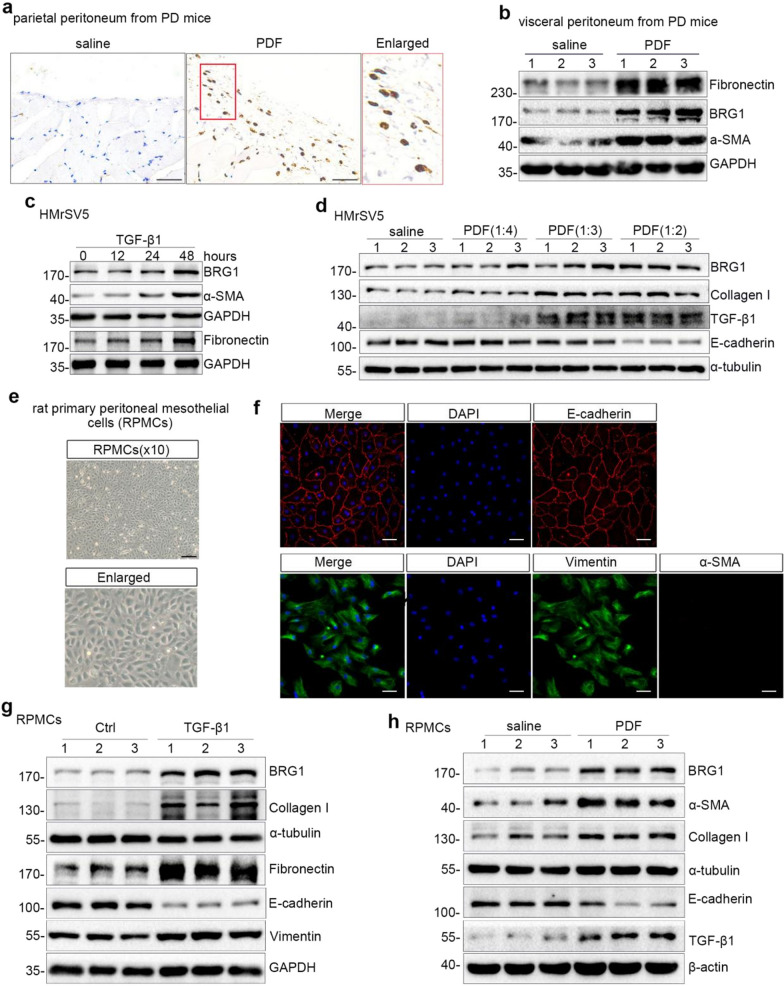
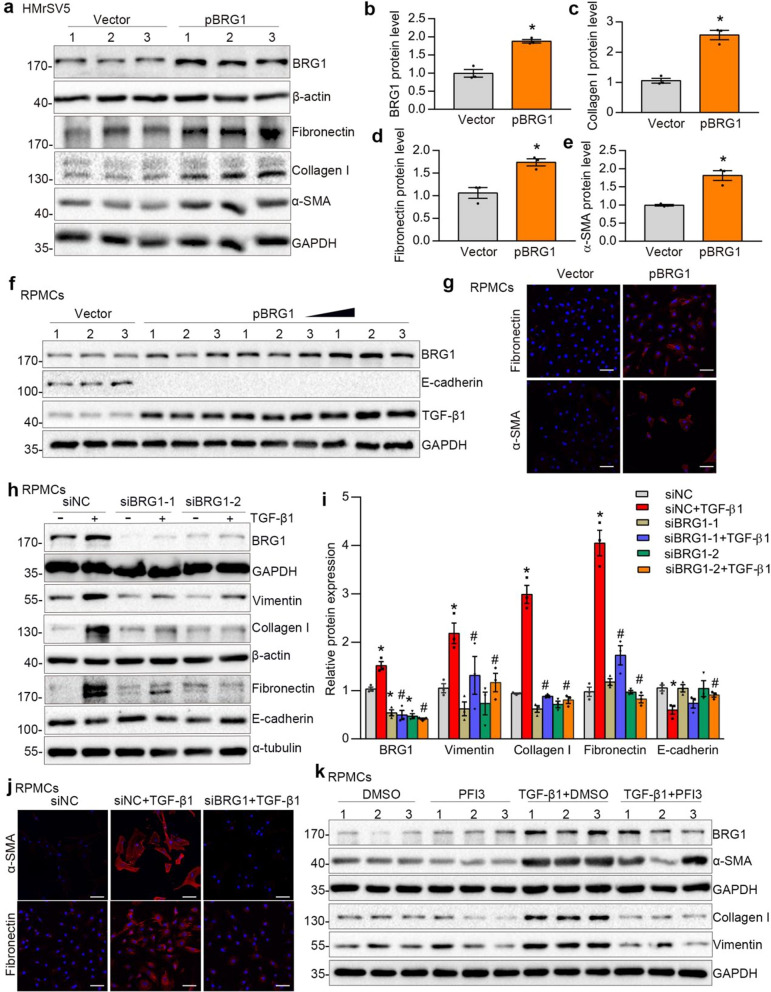
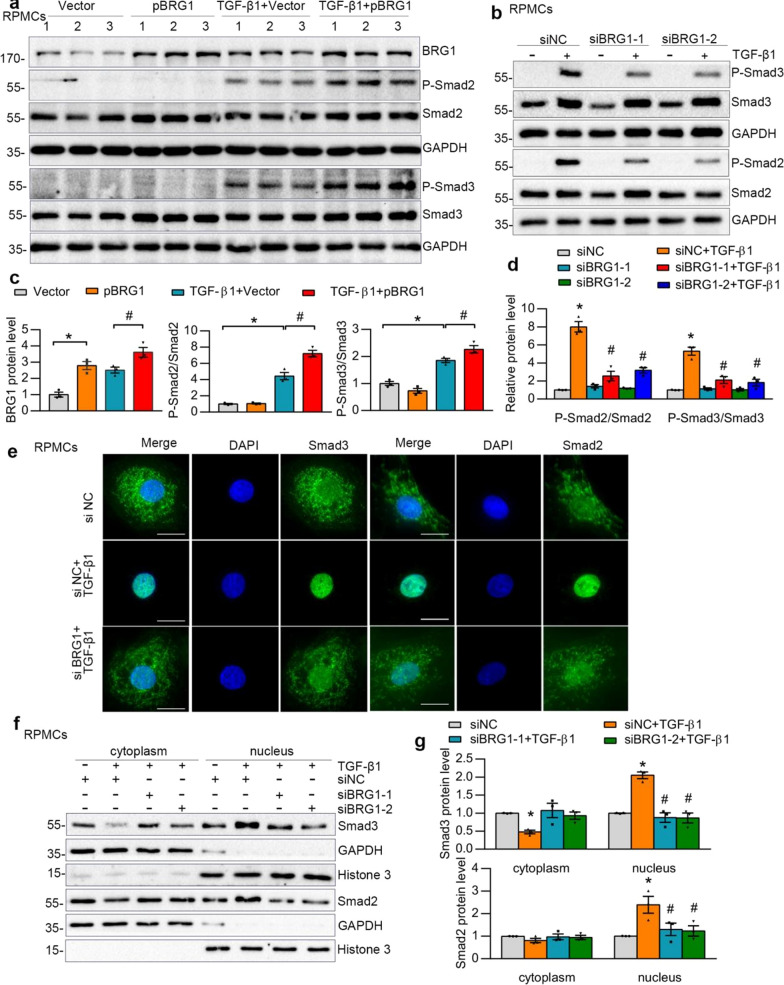
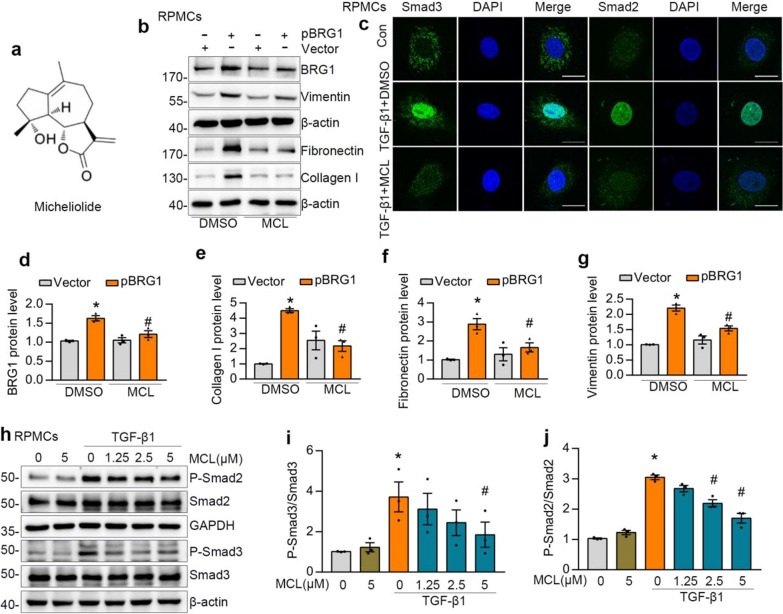
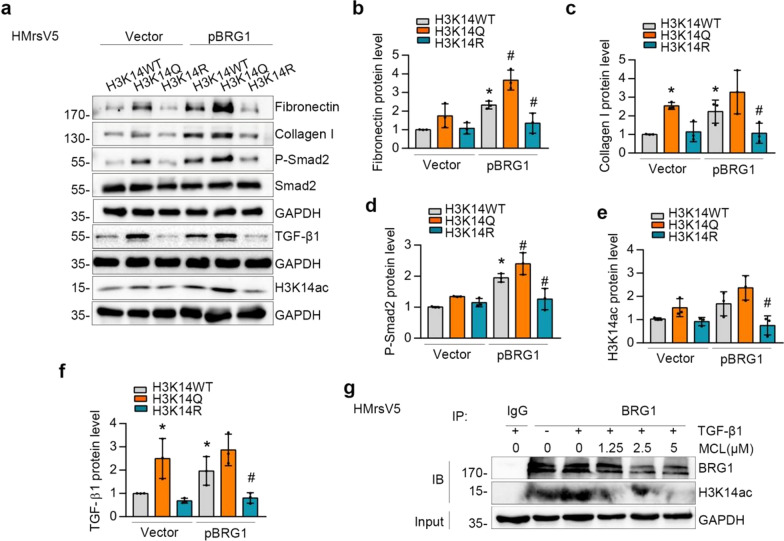
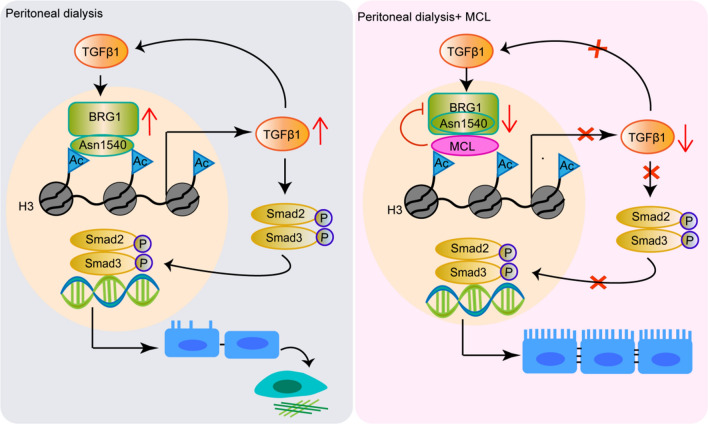
Results: BRG1 was markedly elevated in a mouse PD model and in peritoneal mesothelial cells cultured in TGF-β1 or PD fluid condition. BRG1 overexpression in vitro augmented fibrotic responses and promoted TGF-β1-increased-phosphorylation of Smad2 and Smad3. Meanwhile, knockdown of BRG1 diminished TGF-β1-induced fibrotic responses and blocked TGF-β1-Smad2/3 pathway. MCL ameliorated BRG1 overexpression-induced peritoneal fibrosis and impeded TGF-β1-Smad2/3 signaling pathway both in a mouse PD model and in vitro. Mechanically, MCL impeded BRG1 from recognizing and attaching to histone H3 lysine 14 acetylation by binding to the asparagine (N1540) of BRG1, in thus restraining fibrotic responses and TGF-β1-Smad2/3 signaling pathway. After the mutation of N1540 to alanine (N1540A), MCL was unable to bind to BRG1 and thus, unsuccessful in suppressing BRG1-induced fibrotic responses and TGF-β1-Smad2/3 signaling pathway.

Conclusion: Our research indicates that BRG1 may be a crucial mediator in peritoneal fibrosis and MCL targeting N1540 residue of BRG1 may be a novel therapeutic strategy to combat PD-related peritoneal fibrosis.

Keywords: BRG1; Micheliolide; Peritoneal dialysis; Peritoneal fibrosis; TGF-β1.


Conflict of interest statement

The authors declare no competing interests.

Figures

Fig. 1
Fig. 1
BRG1 is increased in PD mice and in TGF-β1-induced or PD fluid-treated peritoneal mesothelial cells. a BRG1 was detected by immunohistochemical staining. Representative micrographs show the expression and localization of BRG1 in parietal peritoneum from PD mice. Scale bar, 50 μm. Saline, saline-injected control group. PDF, PD fluid containing 4.25% glucose-injected group. b Western blot analyses of visceral peritoneum expression of BRG1, Fibronectin, a-SMA in different groups are presented. Numbers (1, 2 and 3) represent different samples in a given group. c HMrSV5 cells were treated with TGF-β1 (5 ng/ml) for the indicated time period. Western blot analyses of expression of BRG1, Fibronectin, a-SMA in different groups are presented. d HMrSV5 cells were exposed to the mixture of 4.25%PD fluid(PDF) and culture medium by 1:4,1:3 and 1:2,respectively. Cells incubated in medium diluted 1:2 with sterile saline served as a control. Western blot analyses of expression of BRG1, Collagen I, TGF-β1, E-cadherin in different groups are presented. Numbers (1, 2 and 3) represent different samples in a given group. e Primarily cultured rat peritoneal mesothelial cells(RPMCs) exhibited cobble-like appearance under light microscope. Scale bar, 100 μm. f Top: cellular immunofuorescence staining revealed that E-cadherin (red) was positive in primarily cultured RPMCs. Bottom: cellular immunofuorescence staining revealed that Vimentin(green) was positive but a-SMA (red) was nagetive in primarily cultured RPMCs.Scale bar, 50 μm. g RPMCs were treated without or with TGF-β1 (5 ng/ml) for 48 h. Western blot analyses of expression of BRG1, Collagen I, Fibronectin, E-cadherin, Vimentin in different groups are presented. Numbers (1, 2 and 3) represent different samples in a given group. h RPMCs were exposed to the mixture of 4.25%PDF and culture medium by 1:2. Cells incubated in medium diluted 1:2 with sterile saline served as a control. Western blot analyses of expression of BRG1, Collagen I, E-cadherin, TGF-β1, a-SMA in different groups are presented. Numbers (1, 2 and 3) represent different samples in a given group
Fig. 2
Fig. 2
BRG1 promotes fibrotic responses in vitro. ae HMrSV5 cells were transfected with control vector (Vector)or BRG1 expression plasmid (pBRG1) for 48 h. Western blot analyses show that overexpression of BRG1 induced the expression of Fibronectin,Collagen I and a-SMA expression. Representative Western blot (a) and quantitative data (be) in different groups are presented. Numbers (1, 2 and 3) represent different samples in a given group. *P < 0.05 versus Vector. f RPMCs were transfected with control vector (Vector) or BRG1 expression plasmid (pBRG1) for 48 h. Western blot analyses show that overexpression of BRG1 induced the expression of TGF-β1 but reduced the E-cadherin expression. Numbers (1, 2 and 3) represent different samples in a given group. Triangle represents incremental plasmid dosage (2 μg, 3 μg and 4 μg/plate). g Representative micrographs show that BRG1 overexpression promoted Fibronectin(top) and a-SMA(bottom) expression. Scale bar, 50 μm. h, i Western blot analyses show that BRG1 interference by siRNA strategy reduced TGF-β1-induced expression of Collagen I, Vimentin, Fibronectin and restored E-cadherin expression. Representative Western blot (h) and quantitative data (i) in different groups are presented. *P < 0.05 versus siNC, #P < 0.05 versus siNC in the presence of TGF-β1. j Representative micrographs show that knockdown of BRG1 repressed a-SMA (top) and Fibronectin(bottom) expression induced by TGF-β1. Scale bar, 50 μm. k Western blot analyses show the effect of BRG1 inhibitor PFI3 on TGF-β1-induced expression of Collagen I, a-SMA, Vimentin. Numbers (1, 2 and 3) represent different samples in a given group
Fig. 3
Fig. 3
BRG1 activates TGF-β1-Smad2/3 signaling pathway in vitro. a, c Western blot analyses show that BRG1 overexpression induced phosphorylation of Smad2 and Smad3.Western blot (a) and quantitative data (c) in different groups are presented. Numbers (1, 2 and 3) represent different samples in a given group. *P < 0.05 versus Vector, #P < 0.05 versus Vector in the presence of TGF-β1. (b, d) Western blot analyses show that knockdown of BRG1 by siRNA strategy reduced TGF-β1-induced phosphorylation of Smad2 and Smad3. Western blot (b) and quantitative data (d) in different groups are presented. *P < 0.05 versus siNC, #P < 0.05 versus siNC in the presence of TGF-β1. e Representative micrographs show that knockdown of BRG1 repressed Smad2 and Smad3 nuclear accumulation induced by TGF-β1. Scale bar, 10 μm. f, g Western blot shows the distribution of Smad2 and Smad3 in cytosolic and nuclear fractions of different groups as indicated. GAPDH and Histone H3 were used to normalize cytosolic and nuclear fractions, respectively. Western blot (f) and quantitative data (g) in different groups are presented. *P < 0.05 versus siNC, #P < 0.05 versus siNC in the presence of TGF-β1
Fig. 4
Fig. 4
MCL inhibits BRG1-induced fibrotic responses and TGF-β1-Smad2/3 pathway in vitro. a The structure of MCL. b, d, e, f, g Western blot analyses show that MCL reduced BRG1-induced expression of Vimentin, BRG1, Collagen I and Fibronectin in RPMCs. Representative Western blot (b) and quantitative data on the relative abundance of proteins (dg) in different groups are presented. *P < 0.05 versus Vector. #P < 0.05 versus pBRG1. c Representative micrographs show that MCL reduced Smad3 and Smad2 nuclear accumulation induced by TGF-β1. Scale bar, 10 μm. hj Western blot analyses show that MCL reduced TGF-β1-induced phosphorylation of Smad2 and Smad3. Representative Western blot (h) and quantitative data (i, j) in different groups are presented. *P < 0.05 versus conrol group, #P < 0.05 versus TGF-β1 group
Fig. 5
Fig. 5
Administration of DMAMCL ameliorates BRG1 overexpression-induced peritoneal fibrosis in a mouse model of PD. a Experimental design. Red arrows indicate the injection of control (Vector) or BRG1 overexpression plasmid (pBRG1). Orange line indicates the administration of DMAMCL or saline. b, c Representative micrographs show collagen deposition by Masson’s trichrome staining (b) and quantitative analysis (c) in the parietal peritoneum in different groups as indicated. Scale bar, 50 μm. *P < 0.05 versus group I (vector + saline), #P < 0.05 versus group II (vector + PDF + saline). &P < 0.05 versus group III (pBRG1 + PDF + saline). n = 5–6 per group. dh Western blot analysis showed visceral peritoneum expression of BRG1, Fibronectin, Collagen I, and a-SMA in different groups as indicated. Representative Western blot (d) and quantitative data on the relative abundance of BRG1 (e), a-SMA (f), Collagen I (g), and Fibronectin (h) proteins are presented. *P < 0.05 versus group I (vector + saline), #P < 0.05 versus group II (vector + PDF + saline). &P < 0.05 versus group III (pBRG1 + PDF + saline). n = 5–6 per group. i Representative micrographs show Fibronectin (top), and Collagen I (bottom) staining in different groups as indicated. Fibronectin and Collagen I were detected by immunohistochemical staining. Scale bar, 50 μm. jk Western blot analysis showed visceral peritoneum expression of TGF-β1,P-Smad2 and P-Smad3 in different groups as indicated. Representative Western blot (j) and quantitative data (k) on the relative abundance of TGF-β1, P-Smad2 and P-Smad3 are presented. *P < 0.05 versus group I(vector + saline), #P < 0.05 versus group II(vector + PDF + saline). &P < 0.05 versus group III (pBRG1 + PDF + saline). n = 4–6 per group
Fig. 6
Fig. 6
BRG1-H3K14ac complex plays a crucial role in fibrotic responses, and MCL disrupts this complex. af BRG1 expression vector and H3K14 different mutation vectors were co-transfected into HMrSV5 cells. Lysine 14 was mutated into glutamine to mimic acetylation and mutated into arginine to inhibit acetylation, named as H3K14Q or H3K14R, respectively. Western blot analyses (a) and quantitative data of Fibronectin (b), Collagen I (c), P-Smad2 (d), H3K14ac (e) and TGF-β1 (f) in different groups are presented. *P < 0.05 versus vector, #P < 0.05 versus pBRG1. g Co-immunoprecipitation demonstrated that BRG1 interacted with H3K14ac in HMrSV5 cells, which was blocked by MCL. Cells were incubated with TGF-β1 with or with DMSO or different concentration of MCL for 48 h. Cell lysates were IP with anti-BRG1, followed by IB with anti-BRG1 and anti-H3K14ac
Fig. 7
Fig. 7
MCL assuages BRG1-induced fibrotic responses by binding to the residue of asparagine 1540 of BRG1. a Pull-down experiment with a biotin-MCL indicated that MCL directly bound to BRG1 in RPMCs lysates. b Pull-down experiment with a biotin-MCL indicated that MCL directly bound to BRG1 in HMrSV5 cell lysatases. c Cellular thermal shift assay confirmed the binding of MCL to BRG1 in HMrSV5 cells. d Pull-down experiment with a biotin-MCL indicated that MCL directly bound to BRG1 C-terminal region. e Molecular docking of MCL with the protein BRG1. f Pull-down experiment with a biotin-MCL indicated that BRG1 N1540A mutant abrogated the interaction between MCL and BRG1. g Co-immunoprecipitation demonstrated that the interaction between BRG1 and H3K14ac was decreased after the mutation of BRG1 N1540. After transfection with BRG1 full length plasmid or N1540A mutant plasmid, cell lysates were IP with anti-BRG1, followed by IB with anti-BRG1 and anti-H3K14ac. h, i Cells were transfected with BRG1 full length plasmid, N1540A mutant plasmid or vector plasmid, and then were treated with DMSO or MCL. Western blot analyses of expression of a-SMA, Collagen I, Fibronectin, TGF-β1 and P-Smad3 in different groups are presented
Fig. 8
Fig. 8
Schematic diagram of MCL’s protection against PD-related peritoneal fibrosis. MCL binds to the conserved N1540 residue of BRG1 and disrupts interaction of BRG1-H3K14ac complex, thereby leading to inhibit TGF-β1-Smad2/3 signaling pathway and fibrotic responses in peritoneal mesothelial cells

Similar articles

Cited by

References

    1. Bello AK, Levin A, Lunney M, Osman MA, Ye F, Ashuntantang GE, et al. Status of care for end stage kidney disease in countries and regions worldwide: international cross sectional survey. BMJ. 2019;367:l5873. doi: 10.1136/bmj.l5873. - DOI - PubMed
    1. Bello AK, Okpechi IG, Osman MA, Cho Y, Cullis B, Htay H, et al. Epidemiology of peritoneal dialysis outcomes. Nat Rev Nephrol. 2022;18(12):779–793. doi: 10.1038/s41581-022-00623-7. - DOI - PMC - PubMed
    1. Cho Y, Bello AK, Levin A, Lunney M, Osman MA, Ye F, et al. Peritoneal dialysis use and practice patterns: an international survey study. Am J Kidney Dis. 2021;77(3):315–325. doi: 10.1053/j.ajkd.2020.05.032. - DOI - PubMed
    1. Javaid MM, Khan BA, Subramanian S. Peritoneal dialysis as initial dialysis modality: a viable option for late-presenting end-stage renal disease. J Nephrol. 2019;32(1):51–56. doi: 10.1007/s40620-018-0485-3. - DOI - PubMed
    1. Masola V, Bonomini M, Borrelli S, Di Liberato L, Vecchi L, Onisto M, et al. Fibrosis of peritoneal membrane as target of new therapies in peritoneal dialysis. Int J Mol Sci. 2022;23(9):4831. doi: 10.3390/ijms23094831. - DOI - PMC - PubMed

Publication types

LinkOut - more resources