Case Reports
. 2023 Aug 19;15(8):e43759.
doi: 10.7759/cureus.43759. eCollection 2023 Aug.

Twenty-Month Regression Following Concurrent Conventional Whole-Brain Irradiation and Chemoimmunotherapy for ≥3.8 cm Cerebellar Metastasis From Small Cell Lung Cancer

Affiliations
Case Reports

Twenty-Month Regression Following Concurrent Conventional Whole-Brain Irradiation and Chemoimmunotherapy for ≥3.8 cm Cerebellar Metastasis From Small Cell Lung Cancer

Kazuhiro Ohtakara et al. Cureus. .

Abstract

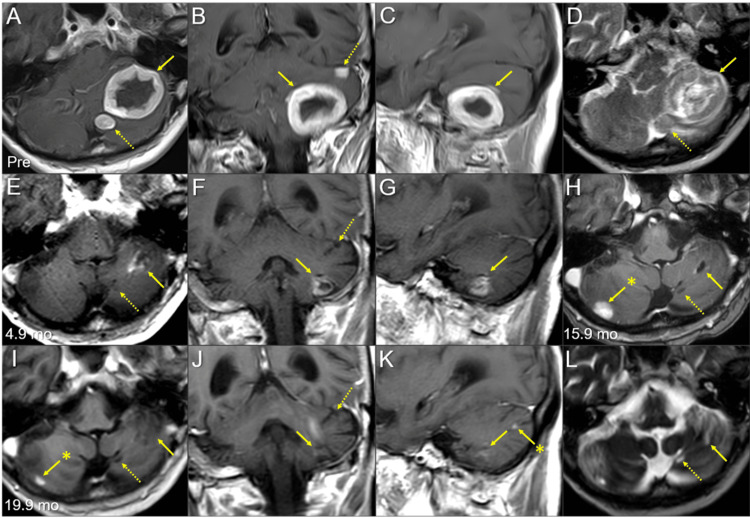
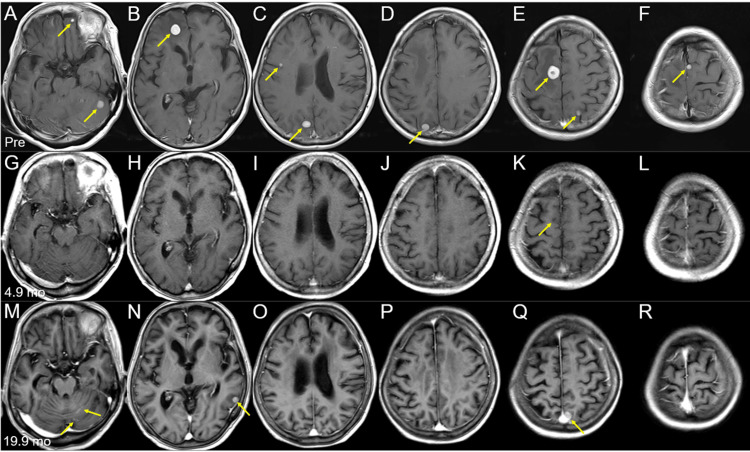
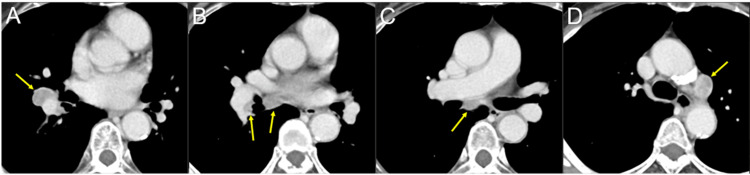
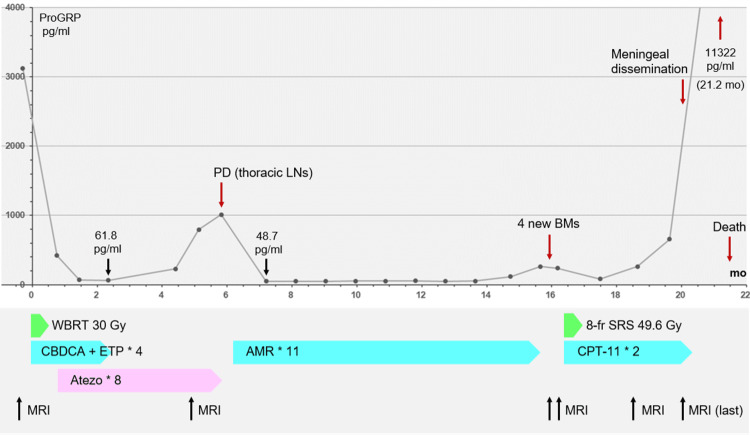
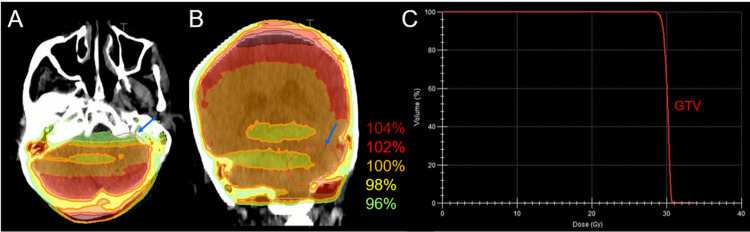
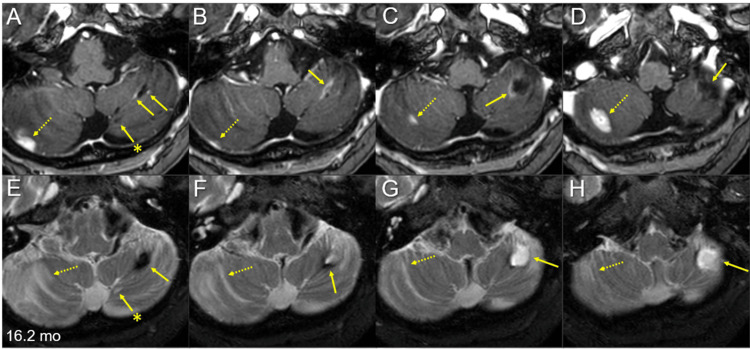
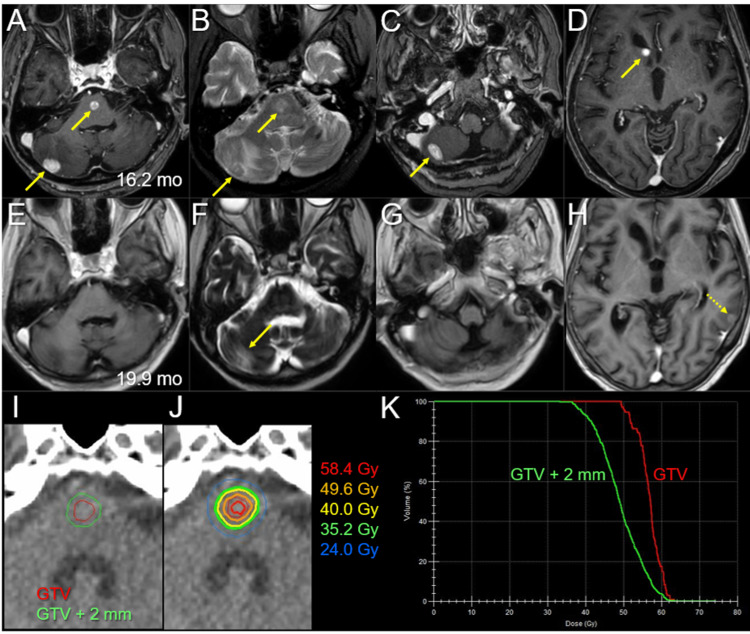
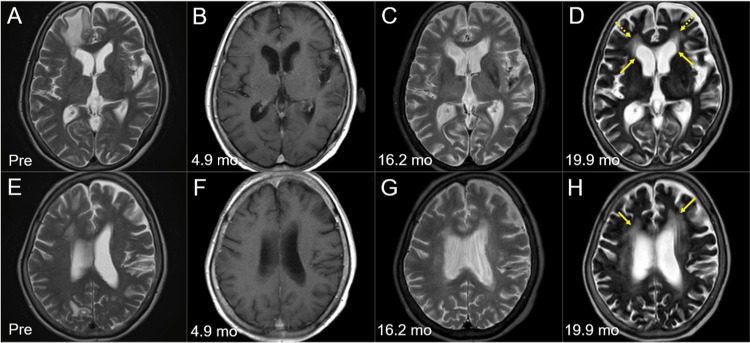
Standard whole-brain radiotherapy (WBRT) alone for large brain metastases (BMs) from small cell lung cancer (SCLC) has limited efficacy and durability, and stereotactic radiosurgery (SRS) alone for symptomatic posterior fossa BMs >3 cm with satellite lesions is challenging. Herein, we describe the case of a 73-year-old female presenting with treatment-naïve SCLC and 15 symptomatic multiple BMs, including a ≥3.8-cm cerebellar mass (≥17.7 cm3) and two adjacent lesions; otherwise, the SCLC was confined to the thorax. The patient was initially treated concurrently with conventional WBRT (30 Gy in 10 fractions) without boost and chemoimmunotherapy (CIT) consisting of carboplatin, etoposide, and atezolizumab. Atezolizumab was excluded during irradiation. Five months after WBRT, the large cerebellar lesion had remarkably regressed, and the smaller lesions (≤17 mm) showed complete responses (CRs) without local progression at 20 months. However, six and 16 months after WBRT, the thoracic lesions had progressed, and although amrubicin was administered, four new BMs, including pons involvement, had developed, respectively. Despite the CRs of the four BMs following SRS (49.6 Gy in eight fractions) and the sustained regression of the thoracic lesions, meningeal dissemination and multiple new BMs were evident 3.5 months post-SRS. The small remnant of the large BM and/or newly developed BMs abutting the cerebrospinal fluid (CSF) space could have led to CSF dissemination, the presumed cause of the patient's death. Taken together, concurrent chemo-WBRT and subsequent CIT can provide excellent and durable tumor responses for SCLC BMs, but may not be fully sufficient for BMs ≥3.8 cm. Therefore, in cases with large lesions, focal dose escalation of the large lesions, consolidative thoracic radiotherapy, and dose de-escalation in the macroscopically unaffected brain region may prevent or attenuate CSF dissemination, new BM development, and adverse effects and thus should be considered.

Keywords: brain metastases; chemoimmunotherapy; consolidative thoracic radiotherapy; extensive stage; large tumor; multi-fraction; pd-l1 inhibitor; small cell lung cancer; stereotactic radiosurgery; whole-brain radiotherapy.


Conflict of interest statement

The authors have declared that no competing interests exist.

Figures

Figure 1
Figure 1. Magnetic resonance images of the posterior fossa lesions at the initial diagnosis and after whole-brain radiotherapy
The images show contrast-enhanced (CE) T1-weighted images (WIs) (A-C, E-K); T2-WIs (D, L); axial images (A, D, E, H, I, L); coronal images (B, F, J); sagittal images (C, G, K); 13 days before (pre) the initiation of whole-brain radiotherapy (WBRT) (A-D); at 4.9 months (mo) after WBRT initiation (E-G); at 15.9 months (H); and at 19.9 months (I-L). (A-L) These images are shown at the same magnification and coordinates under co-registration and fusions. (A-D) A well-demarcated lesion with the dominance of the peripheral enhancement (3.8 cm in the maximum diameter, 17.7 cm3 in the volume) (arrows in A-C) on CE-T1-WIs is observed as the heterogeneous intensity mass (arrow in D) associated with mild perilesional edema on T2-WI. The lesion reaches the cerebellar surface at the ventrolateral and caudal sides and appears to extend beyond it in some areas. In the ipsilateral hemisphere, a 1.1 cm solid lesion (0.8 cm3) is located adjacent to the 3.8 cm lesion (dashed arrow in A, D), and a 0.9 cm lesion (0.3 cm3) is located less than 1 cm away from the 3.8 cm lesion (dashed arrow in B). (E-G) At 4.9 months, T2-WIs were unavailable. The large cerebellar lesion remarkably decreased in size, along with significant attenuation of the enhancing effect (arrows in E-G), and the two adjacent lesions (dashed arrows in E, F) regressed completely. (H) At 15.9 months, the large lesion was faintly enhanced at the periphery (arrow in H). The adjacent lesion is observed as the cavitary scar without enhancement (dashed arrow in H). A new enhancing lesion (arrow with an asterisk in H) appeared. (I-L) At 19.9 months, the enhancement of the large lesion was further attenuated (arrows in I-K), with the faint high-intensity scar (arrow in L) visible on T2-WI. None of the other two lesions showed local progression (dashed arrows in I, J, and L). The right cerebellar lesion regressed markedly (arrow with an asterisk in I). A new enhancing lesion (arrow with an asterisk in K) appeared.
Figure 2
Figure 2. Brain magnetic resonance images of the other representative lesions at the initial diagnosis and after whole-brain radiotherapy
The images show axial CE-T1-WIs (A-L); before (pre) the initiation of WBRT (A-F); at 4.9 months (mo) after WBRT initiation (G-L); and at 19.9 months (M-R). (A–R) These images are shown at the same magnification and coordinates under co-registration and fusions. (A-F) Nine out of the 15 lesions are visible as solid enhancing masses (arrows in A–F). (G-L) All nine lesions regressed completely, only leaving the cavitary scar in the right frontal lesion (arrow in K). (M-R) None of the nine lesions with complete responses showed local progression; however, multiple new lesions (arrows in N, Q) appeared, along with localized leptomeningeal dissemination (arrows in M). CE: contrast-enhanced; WIs: weighted images; WBRT: whole-brain radiotherapy
Figure 3
Figure 3. Chest computed tomography images at the initial diagnosis
The images show axial CE computed tomography (CT) images (A-D). (A-D) The 2-cm well-demarcated mass lesion in the right middle-inferior perihilar region (arrow in A) and multiple lymph node swelling in the ipsilateral hilar and peribronchial (arrows in B), subcarinal (arrow in C), and subaortic (arrow in D) regions. CE: contrast-enhanced
Figure 4
Figure 4. Summary of anti-cancer treatments after the initiation of whole-brain radiotherapy, along with the change in pro-gastrin-releasing peptide level and acquisition timing of brain magnetic resonance imaging
CBDCA + ETP + atezolizumab: CBDCA (AUC 4 on day 1), ETP (80 mg/m2 on days one to three), and atezo (1200 mg/body on day 1); AMR monotherapy: AMR (35 mg/m2 on days one to three); CPT-11 monotherapy: CPT-11 (80 mg/m2 on days one, eight, and 15); day eight of the second course was the last administration. ProGRP: pro-gastrin-releasing peptide; mo: months; PD: progressive disease; LNs: lymph nodes; BMs: brain metastases; WBRT: whole-brain radiotherapy; 8-fr: eight-fraction; SRS: stereotactic radiosurgery; CBDCA: carboplatin; ETP: etoposide; AUC: area under the curve; atezo: atezolizumab; AMR: amrubicin; CPT-11: irinotecan; MRI: magnetic resonance imaging
Figure 5
Figure 5. Dose distributions and dose-volume histogram of the large left cerebellar lesion in whole-brain radiotherapy
The images show dose distributions (A, B); an axial image (A); a coronal image (B); and the dose-volume histogram (DVH) (C). (A, B) The representative % isodoses, normalized to 100% (30 Gy in 10 fractions) at the isocenter, and the gross tumor volume (GTV) contour of the left 3.8 cm cerebellar lesion (arrows in A, B). (C) The D98%, D50%, and D2% of the GTV are 29.1 Gy (97.0%), 30.2 Gy (100.7%), and 30.7 Gy (102.3%), respectively, and 30 Gy encompasses 65% of the GTV. DX%: a minimum dose encompassing at least X% of the target volume (GTV).
Figure 6
Figure 6. Multiple magnetic resonance images of the posterior fossa for the target definition of salvage stereotactic radiosurgery 16.2 months after whole-brain radiotherapy
The images show axial CE-T1-WIs (A-D) and axial T2-WIs (E-H). (A-H) These images are shown at the same magnification and coordinates under co-registration and fusions. Alphabetically from cranial to caudal (A-D, E-H). The large left cerebellar lesion regressed remarkably, leaving the cavitary remnant (arrows in A-H), in which the periphery was partially enhanced (arrows in A-C) and partially hypointense on T2-WIs (arrows in E, F). The adjacent medial lesion regressed completely, only leaving the tiny cavitary scar (arrows with asterisks in A and E). Two discontinuous solid-enhancing lesions (dashed arrows in A-D) developed in the right cerebellar hemisphere, which is associated with perilesional edema (dashed arrows in E-H). mo: months; CE: contrast-enhanced; WIs: weighted images
Figure 7
Figure 7. Magnetic resonance images before and after salvage stereotactic radiosurgery
The images show axial CE-T1-WIs (A, C-E, G, H); axial T2-WIs (B, F); at 16.2 months (mo) after the initiation of WBRT (A-D); at 19.9 months (3.5 months after the initiation of SRS) (E-H); the target definition of the pons lesion (I); the dose distribution (J); the DVHs (K); and the pons lesion (I-K). (A–H) These images are shown at the same magnification and coordinates under co-registration and fusions. (A-D) Four solid-enhancing lesions (arrows in A, C, and D) are associated with perilesional edema (arrows in B). (E-H) The four lesions regressed completely, only leaving faint perilesional edema (arrow in F); however, a new lesion developed (dashed arrow in H). (J) Five representative isodose lines and the GTV contour are superimposed onto an axial CT image. CE: contrast-enhanced; WIs: weighted images; mo: months; WBRT: whole-brain radiotherapy; DVHs: dose-volume histograms; GTV: gross tumor volume; GTV + 2 mm: the reference volume generated by adding an isotropic 2-mm margin to a GTV
Figure 8
Figure 8. Morphological changes of the brain on magnetic resonance images before and after whole-brain radiotherapy
The images show axial T2-WIs (A, C-E, G, H); axial CE-T1-WIs (B, F); before WBRT (Pre) (A, E); at 4.9 months (mo) after the initiation of WBRT (B, F); at 16.2 months (C, G); and at 19.9 months (D, H). (A-H) These images are shown at the same magnification and coordinates under co-registration and fusions. (B, F) T2-WIs were unavailable at 4.9 months. (C, D, G, H) Dilatation of the lateral ventricles (arrows in D) with high-intensity change in the periventricular deep white matter (dashed arrows in D, arrows in H) and widening of the cortical sulci and the Sylvian fissures reflect the progression of brain atrophy and the degenerative changes of the parenchyma. WIs: weighted images; CE: contrast-enhanced; WBRT: whole-brain radiotherapy

References

    1. Radiation therapy for small cell lung cancer: an ASTRO clinical practice guideline. Simone CB 2nd, Bogart JA, Cabrera AR, et al. Pract Radiat Oncol. 2020;10:158–173. - PMC - PubMed
    1. Update 2021: management of small cell lung cancer. Tariq S, Kim SY, Monteiro de Oliveira Novaes J, Cheng H. Lung. 2021;199:579–587. - PubMed
    1. Outcome and prognostic factors in patients with brain metastases from small-cell lung cancer treated with whole brain radiotherapy. Bernhardt D, Adeberg S, Bozorgmehr F, et al. J Neurooncol. 2017;134:205–212. - PubMed
    1. Stereotactic radiosurgery for brain metastases from newly diagnosed small cell lung cancer: practice patterns and outcomes. Jiang W, Haque W, Verma V, Butler B, Teh BS. Acta Oncol. 2019;58:491–498. - PubMed
    1. Radiosurgery for small-cell lung cancer brain metastases: a review. Robin TP, Rusthoven CG. J Thorac Dis. 2020;12:6234–6239. - PMC - PubMed

Publication types

LinkOut - more resources