. 2023 Sep 11:5:100199.
doi: 10.1016/j.crmicr.2023.100199. eCollection 2023.

Host specific adaptations of Ligilactobacillus aviarius to poultry

Affiliations

Host specific adaptations of Ligilactobacillus aviarius to poultry

Bibiana Rios Galicia et al. Curr Res Microb Sci. .

Abstract

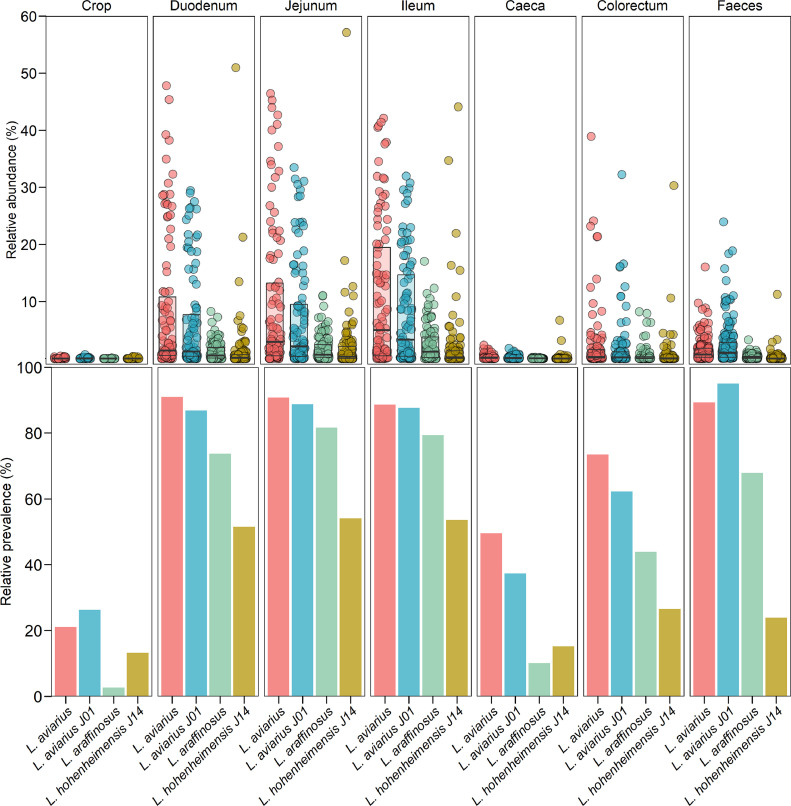
The genus Ligilactobacillus encompasses species adapted to vertebrate hosts and fermented food. Their genomes encode adaptations to the host lifestyle. Reports of gut microbiota from chicken and turkey gastrointestinal tract have shown a high persistence of Ligilactobacillus aviarius along the digestive system compared to other species found in the same host. However, its adaptations to poultry as a host has not yet been described. In this work, the pan-genome of Ligilactobacillus aviarius was explored to describe the functional adaptability to the gastrointestinal environment. The core genome is composed of 1179 gene clusters that are present at least in one copy that codifies to structural, ribosomal and biogenesis proteins. The rest of the identified regions were classified into three different functional clusters of orthologous groups (clusters) that codify carbohydrate metabolism, envelope biogenesis, viral defence mechanisms, and mobilome inclusions. The pan-genome of Ligilactobacillus aviarius is a closed pan-genome, frequently found in poultry and highly prevalent across chicken faecal samples. The genome of L. aviarius codifies different clusters of glycoside hydrolases and glycosyltransferases that mediate interactions with the host cells. Accessory features, such as antiviral mechanisms and prophage inclusions, variate amongst strains from different GIT sections. This information provides hints about the interaction of this species with viral particles and other bacterial species. This work highlights functional adaptability traits present in L. aviarius that make it a dominant key member of the poultry gut microbiota and enlightens the convergent ecological relation of this species to the poultry gut environment.

Keywords: Chicken; Ligilactobacillus aviarius; Pan-genome; Poultry.


Conflict of interest statement

The authors declare that they have no known competing financial interests or personal relationships that could have appeared to influence the work reported in this paper.

Figures

Image, graphical abstract
Graphical abstract
Fig 1
Fig. 1
Phylogeny based on universal marker genes of species belonging to the genus Ligilactobacillus (reference genomes). Reconstruction of a maximum-likelihood tree based on 497 single-copy core protein concatenated sequences. The tree is rooted in Liquorilactobacillus vini DSM 20,605. Bootstrap percentages (1000 replicates) are shown at the branch points. Bar depicts 0.1 substitutions per nucleotide position. Bar plots represent genome size and GC% content: The last column represents the source of isolation of each species described in more detail in table S1 and the asterisks marks a specie that has been reported in chicken.
Fig 2
Fig. 2
Relative abundance and prevalence of species of Ligilactobacillus related to poultry across chicken samples obtained from public databases. Dots represent the relative abundance of each sample (crop=38, duodenum=99, jejunum=98, ileum=97, caeca=99 colorectum=98, and faeces=159) obtained from the projects PRJEB60928, PRJNA417359 and PRJEB22062. Boxplots depict the mean relative abundance of each species across all samples. Barplots represent the relative prevalence of genomes abundant above 0.1%.
Fig 3
Fig. 3
Number of core genes and pan-genome of 26 genomes L. aviarius. (A) The number of genes of the pan-genome increases and flattens as a function of the number of genomes included in the analysis while (B) the core genome and (C) number of new genes decreases. Bars depict standard deviation.
Fig 4
Fig. 4
Pan-genome analysis of L. aviarius. Comparative genomic analysis of the 26 non-clonal strains of L. aviarius available in the databases. The inner layers represent individual genomes obtained from chicken (blue) or turkey (orange), arranged according to their phylogenetic relation. Genomes are depicted, organised by clusters of orthologous genes where each colour shadow indicates a cluster: Core genes in orange, Cluster 1 genes in green, Cluster 2 genes in blue, and Cluster 3 genes in yellow. An absence of colour depicts an absence of genes. The origin of each genome (either jejunum, ileum, caeca or faeces)is displayed next to the genome label. The barplots below represent the relative abundance of genes found on each cluster.
Fig 5
Fig. 5
Metabolic pathways detected along the chicken GIT and across the pan-genome input genomes of L.aviarius. The figure is separated in two parts to highlight pathway completion (superior heatmap) and genes presence/absence (inferior heatmap). Tiles are coloured by pathway coverage according to the scale in the superior right corner. Presence/absence in the second heatmap represent the presence of genes necessary to express a particular process. An absence of colour indicate absence genes.
Fig 6
Fig. 6
Distribution of carbohydrate metabolism and transport genes codified at the core cluster, cluster 1 or both across all input genomes of L. aviarius originating from four different origins along the chicken GIT.
Fig 7
Fig. 7
Distribution of peptidases with a potential to interact with the host structures and signalisation across all input genomes of L. aviarius originating from four different origins along the chicken GIT. The scale represents the number of gene-copies detected in each genome.
Fig 8
Fig. 8
Distribution of antiviral systems across all input genomes of L. aviarius originating from four different origins along the chicken GIT. Tiles are coloured to indicate the antiviral system to which the protein belongs.

References

    1. Al-Khalaifa H., Al-Nasser A., Al-Surayee T., Al-Kandari S., Al-Enzi N., Al-Sharrah T., Ragheb G., Al-Qalaf S., Mohammed A. Effect of dietary probiotics and prebiotics on the performance of broiler chickens. Poult. Sci. 2019;98(10):4465–4479. doi: 10.3382/ps/pez282. - DOI - PubMed
    1. Almpanis A., Swain M., Gatherer D., McEwan N. Correlation between bacterial G+C content, genome size and the G+C content of associated plasmids and bacteriophages. Microb Genom. 2018;4(4) doi: 10.1099/mgen.0.000168. - DOI - PMC - PubMed
    1. Amato K.R., J G.S., Song S.J., Nute M., Metcalf J.L., Thompson L.R., Morton J.T., Amir A., V J.M., Humphrey G., Gogul G., Gaffney J., A L.B., G A.O.B., F P.C., Di Fiore A., N J.D., T L.G., Gomez A., Kowalewski M.M., R J.L., Link A., M L.S., Tecot S., B A.W., K E.N., R M.S., Knight R., S R.L. Evolutionary trends in host physiology outweigh dietary niche in structuring primate gut microbiomes. ISME J. 2019;13(3):576–587. doi: 10.1038/s41396-018-0175-0. - DOI - PMC - PubMed
    1. Arndt D., Marcu A., Liang Y., Wishart D.S. PHAST, PHASTER and PHASTEST: tools for finding prophage in bacterial genomes. Brief Bioinform. 2019;20(4):1560–1567. doi: 10.1093/bib/bbx121. - DOI - PMC - PubMed
    1. Asnicar F., Thomas A.M., Beghini F., Mengoni C., Manara S., Manghi P., Zhu Q., Bolzan M., Cumbo F., May U., Sanders J.G., Zolfo M., Kopylova E., Pasolli E., Knight R., Mirarab S., Huttenhower C., Segata N. Precise phylogenetic analysis of microbial isolates and genomes from metagenomes using PhyloPhlAn 3.0. Nat. Commun. 2020;11(1):2500. doi: 10.1038/s41467-020-16366-7. - DOI - PMC - PubMed

LinkOut - more resources