

Analysis of Jersey versus Holstein breed profitability on north central US dairies
- PMID: 37727232
- PMCID: PMC10505770
- DOI: 10.3168/jdsc.2023-0371
Analysis of Jersey versus Holstein breed profitability on north central US dairies
Abstract
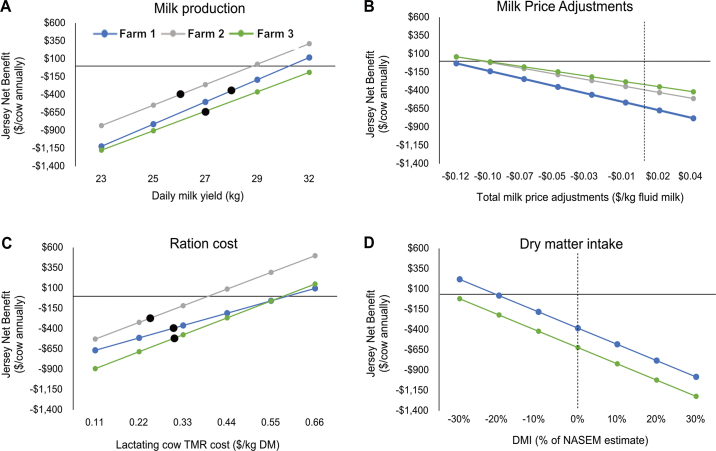
With over 9 million cows in the United States, Holstein is the dominant breed in the US dairy population; however, the US Jersey population is growing. The objective of this study was to determine the profitability of Holstein and Jersey cows managed similarly on the same farms. Holstein and Jersey economic performance was compared within 3 north central US dairies, each milking more than 500 cows. The herds' average distribution was 21% Jersey (27 ± 0.67 kg/d milk, 4.92% ± 0.24 fat, 3.72% ± 0.03 protein) and 79% Holstein (37 ± 1.98 kg/d milk, 3.85% ± 0.21 fat, 3.17% ± 0.17 protein). A comparative budget approach was used to assess economic factors that differed between the breeds on a per cow annual basis, based on the assumption that an existing farm would be constrained by stalls and parlor to an equal number of Jersey and Holstein cows. Data from 2020 were gathered from farm management software, on-farm evaluations, and producer interviews. Sensitivity analysis was performed to determine which conditions would lead to different conclusions. Factors considered in the analysis included milk and component production, milk bonuses, ration prices, and dry matter (DM) intake. In a 2021 price scenario, Holstein cows ranged from $345 to $601 more profitable than Jersey cows on a per cow annual basis. Although Jersey cows had an advantage in component concentration, Holstein cows produced 13 ± 4.7% more fat and 22 ± 6.6% more protein annually due to greater milk yield. This accounted for most of the profitability advantage for Holsteins; 78% of the revenue advantage for Holstein cows came from increased component production. Few health and reproductive differences were found. The sensitivity analysis revealed, if all other factors remained the same, Jersey profitability would equal that of Holstein if any of the following changes occurred (assuming no change in Holstein metrics): mean Jersey milk production increased to 31 kg/d; milk price adjustments decreased from -$0.008 to -$0.11 per kg fluid milk; lactating cow ration price increased from $0.27 per kg DM to $0.53 per kg DM; or Jersey DM intake decreased from 20 to 15 kg/d. The study did not consider crossbred profitability or new infrastructure investments. In conclusion, Holstein cows were more profitable than Jersey cows on these 3 north central US dairies.
© 2023.
Figures

References
-
- APHIS USDA Types and Costs of Respiratory Disease Treatments in U.S. Feedlots. 2013. http://www.aphis.usda.gov/nahms
-
- Beecher M., Buckley F., Waters S.M., Boland T.M., Enriquez-Hidalgo D., Deighton M.H., O'Donovan M., Lewis E. Gastrointestinal tract size, total-tract digestibility, and rumen microflora in different dairy cow genotypes. J. Dairy Sci. 2014;97:3906–3917. doi: 10.3168/jds.2013-7708. 24704226. - DOI - PubMed
-
- CDCB (Council on Dairy Cattle Breeding) Summary of 2020 DHI Herd Averages. 2020. https://queries.uscdcb.com/publish/dhi/dhi21/haall.html
-
- Endres M. Dairy and the Cost of Production in Tough Times | UMN Extension. 2018. https://extension.umn.edu/dairy-news/dairy-and-cost-production-tough-times
LinkOut - more resources
Full Text Sources
