. 2023 Sep 1:10:1156759.
doi: 10.3389/fcvm.2023.1156759. eCollection 2023.

Modelling the pathology and treatment of cardiac fibrosis in vascularised atrial and ventricular cardiac microtissues

Affiliations

Modelling the pathology and treatment of cardiac fibrosis in vascularised atrial and ventricular cardiac microtissues

Jasmeet S Reyat et al. Front Cardiovasc Med. .

Abstract

Introduction: Recent advances in human cardiac 3D approaches have yielded progressively more complex and physiologically relevant culture systems. However, their application in the study of complex pathological processes, such as inflammation and fibrosis, and their utility as models for drug development have been thus far limited.

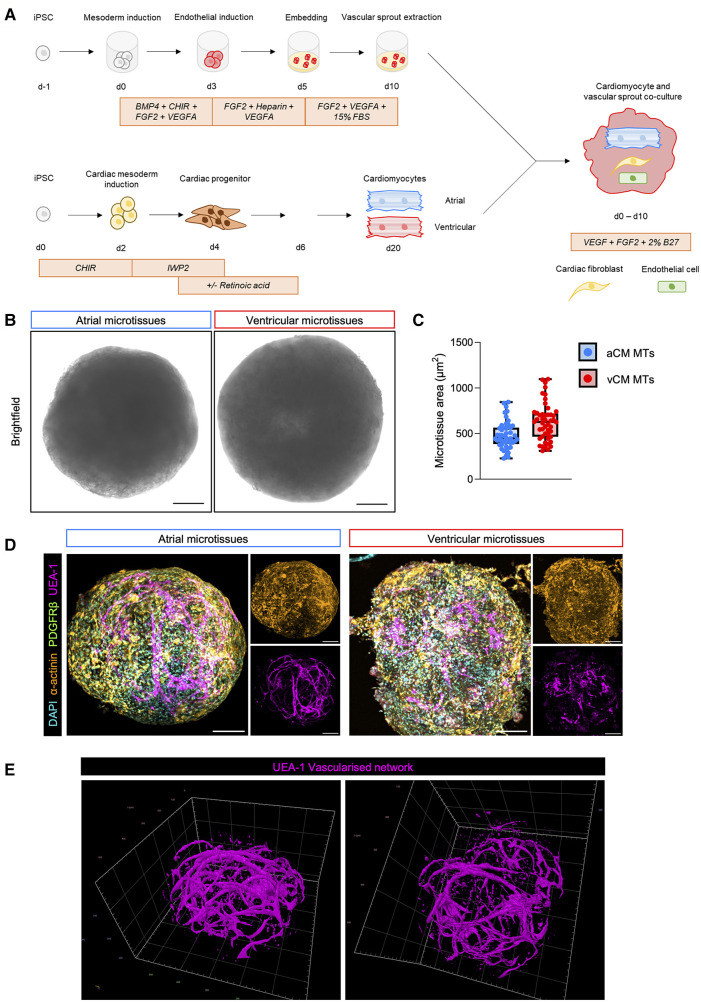
Methods: In this work, we report the development of chamber-specific, vascularised human induced pluripotent stem cell-derived cardiac microtissues, which allow for the multi-parametric assessment of cardiac fibrosis.

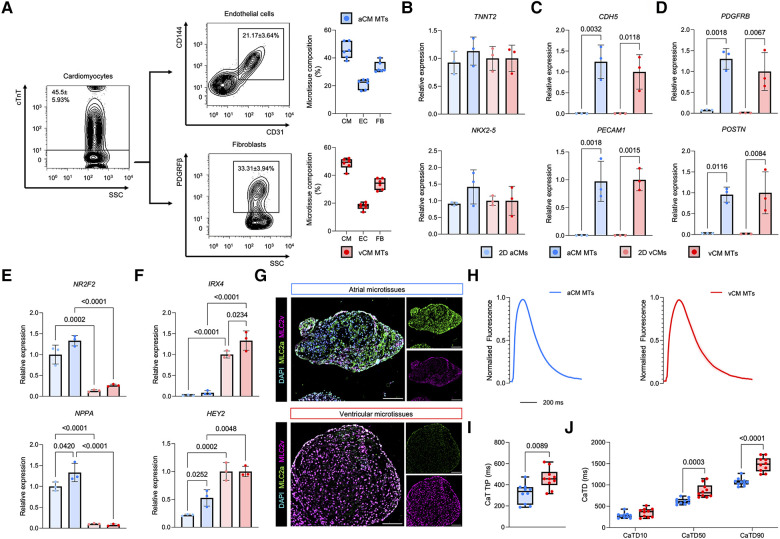
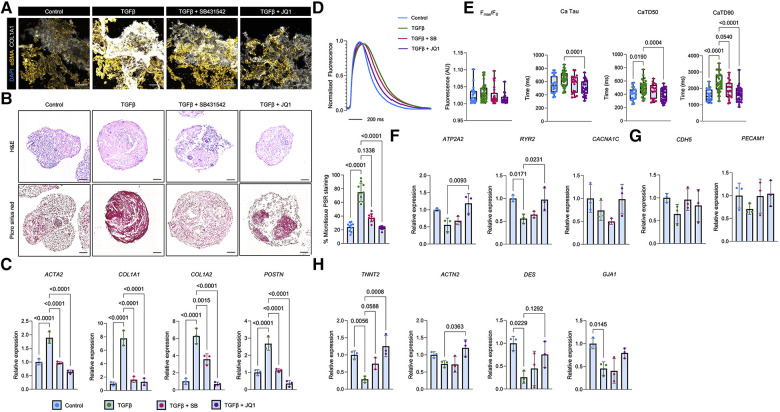
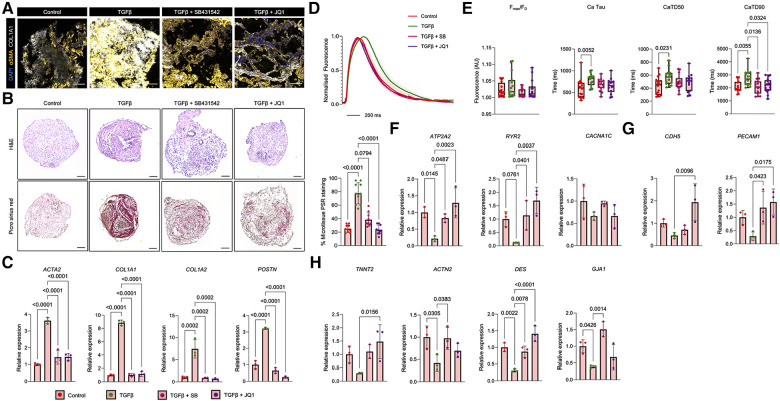
Results: We demonstrate the generation of a robust vascular system in the microtissues composed of endothelial cells, fibroblasts and atrial or ventricular cardiomyocytes that exhibit gene expression signatures, architectural, and electrophysiological resemblance to in vivo-derived anatomical cardiac tissues. Following pro-fibrotic stimulation using TGFβ, cardiac microtissues recapitulated hallmarks of cardiac fibrosis, including myofibroblast activation and collagen deposition. A study of Ca2+ dynamics in fibrotic microtissues using optical mapping revealed prolonged Ca2+ decay, reflecting cardiomyocyte dysfunction, which is linked to the severity of fibrosis. This phenotype could be reversed by TGFβ receptor inhibition or by using the BET bromodomain inhibitor, JQ1.

Discussion: In conclusion, we present a novel methodology for the generation of chamber-specific cardiac microtissues that is highly scalable and allows for the multi-parametric assessment of cardiac remodelling and pharmacological screening.

Keywords: 3D cardiac microtissues; cardiac fibrosis; cardiomyocytes; induced pluripotent stem cells; tissue engineering.


Conflict of interest statement

The authors declare that the research was conducted in the absence of any commercial or financial relationships that could be construed as a potential conflict of interest.

Figures

Figure 1
Figure 1
Generation of multicellular chamber-specific human iPSC-derived cardiac microtissues. (A) Schematic representation of atrial (aCM MT) and ventricular microtissue (vCM MT) generation methodology. (B) Representative bright-field images of 3D day 10 aCM MT and vCM MT. The scale bar represents 100 µm. (C) Quantification of aCM MTs and vCM MTs size. Data are presented as mean ± SD (n = 48 microtissues from 6 independent experiments). (D) Whole microtissue immunofluorescent staining of α-actinin (cardiomyocytes), PDGFRβ (fibroblasts), UEA-1 (endothelial cells) and DAPI (nuclei) in an aCM MT (left) and vCM- MT (right) at day 10. Smaller panels show single stained images of cardiomyocytes (α-actinin) and endothelial cells (UEA-1) showing cellular localisation within the cardiac microtissues. The scale bar represents 100 µm. (E) IMARIS rendered imaging of the endothelial vascularised network in the cardiac tissue.
Figure 2
Figure 2
Cellular phenotyping of human iPSC-derived aCM MTs and vCM MTs reveals chamber specific cellular expression profiles. (A) Quantification of cardiomyocyte, endothelial and fibroblast populations in aCM MTs and vCM MTs by flow cytometry. Representative FACS plots are shown with the percentage microtissue composition quantification on the right. Data are presented as mean ± SD (n = 6 independent experiments). (B–D) Gene expression of (B) cardiomyocyte (TNNT2 and NKX2-5), (C) endothelial (CDH5 and PECAM1) and (D) fibroblast (PDGFRβ and POSTN) markers in day 10 aCM MTs and vCM MTs compared to 2D cultured day 20 hiPSC-derived aCMs and vCMs. Data are presented as mean ± SD (n = 3 independent experiments) relative to the expression of 2D hiPSC-vCMs in the case of cardiomyocyte genes or relative to 3D vCM MTs in the case of endothelial and fibroblast genes. Statistical analysis was performed using a One-way ANOVA followed by a Kruskal Wallis post-hoc test. (E,F) Gene expression of (E) atrial (NR2F2 and NPPA) and (F) ventricular (IRX4 and HEY2) in day 10 aCM MTs and vCM MTs compared to 2D cultured day 20 iPSC-derived aCMs and vCMs. Data are presented as mean ± SD (n = 3 independent experiments) relative to 2D hiPSC-aCMs for atrial genes or 2D hiPSC-vCMs for ventricular genes. Statistical analysis was performed using a One-way ANOVA followed by a Kruskal Wallis post-hoc test. (G) Immunofluorescence analysis of cardiac chamber specific myosin light chain variants (MLC2a and MLC2v) in day 10 sectioned aCM MTs and vCM MTs. The scale bar represents 100 µm. (H–J) Ca2+ dynamics in aCM MTs and vCM MTs using optical mapping. (H) Averaged Ca2+ traces from aCM MTs and vCM MTs. Error bars represent SEM. (I) Quantification of Ca2+ transient time-to-peak (CaT TtP) and (J) Ca2+ transient duration (CaTD) in aCM MTs and vCM MTs. Data are presented as mean ± SD (n = 10 aCM MTs and n = 10 vCM MTs from 3 independent experiments). Statistical analysis was performed using a Mann-Whitney U-test or a Two-way ANOVA when comparing between multiple groups.
Figure 3
Figure 3
Modelling TGFβ-induced cardiac fibrosis in aCM MTs and its blockade using SB431542 and JQ1. (A) Immunofluorescent analysis of pro-fibrotic markers (αSMA and COL1A1) on sectioned aCM MTs following a 2 days treatment with TGFβ alone or in combination with a TGFβ-receptor I inhibitor (SB431542) or a BET bromodomain inhibitor (JQ1). The scale bar represents 100 µm. (B) Representative haematoxylin and eosin (H&E) and Picro Sirius Red stained images of aCM MTs treated with TGFβ alone or in combination with SB431542 or JQ1. Quantification of Picro Sirius Red is shown as a percentage of the total microtissue (right; n = 10 from 2 independent experiments). The scale bar represents 75 µm. (C) Gene expression analysis of pro-fibrotic genes (ACTA2, COL1A1, COL1A2 and POSTN) in aCM MTs treated with TGFβ alone or in combination with SB431542 (SB) or JQ1. Data are presented as mean ± SD (n = 3 independent experiments) relative to control treated aCM-MTs. Statistical analysis was performed using a Kruskal-Wallis test. (D,E) Ca2+ dynamics in aCM MTs treated with TGFβ alone or in combination with SB431542 (SB) or JQ1. (D) Averaged Ca2+ traces of treated aCM MTs. Error bars represent SEM. (E) Quantification of Ca2+ time to peak (Fmax/F0), Ca2+ tau, Ca2+ transient duration 50% (CaTD50) and Ca2+ transient duration (CaTD). Data are presented as mean ± SD (n = 20 Control, n = 33 TGFβ, n = 32 TGFβ + SB and n = 20 TGFβ + JQ1 treated aCM MTs from 4 independent experiments). Statistical analysis was performed using a Kruskal-Wallis test. (F) Gene expression analysis of calcium handling genes (ATP2A2, RYR2 and CACNA1C) in aCM MTs treated with TGFβ alone or in combination with SB or JQ1. Data are presented as mean ± SD (n = 3 independent experiments) relative to control treated aCM-MTs. Statistical analysis was performed using a Kruskal-Wallis test. (G) Gene expression analysis of endothelial (CDH5 and PECAM1) and (H) Cardiac (TNNT2, ACTN2, DES and GJA1) and in aCM MTs treated with TGFβ alone or in combination with SB or JQ1. Data are presented as mean ± SD (n = 3 independent experiments) relative to control aCM-MTs. Statistical analysis was performed using a Kruskal-Wallis test.
Figure 4
Figure 4
Fibrotic phenotyping of vCM MTs treated with TGFβ. (A) Immunofluorescent analysis of pro-fibrotic markers (αSMA and COL1A1) on sectioned vCM-MTs following a 2 days treatment with TGFβ alone or in combination with a TGFβ-receptor I inhibitor (SB431542) or a BET bromodomain inhibitor (JQ1). The scale bar represents 100 µm. (B) Representative haematoxylin and eosin (H&E) and Picro Sirius Red stained images of vCM MTs treated with TGFβ alone or in combination with SB431542 or JQ1. Quantification of Picro Sirius Red is shown as a percentage of the total microtissue (right; n = 10 from 2 independent experiments). The scale bar represents 75 µm. (C) Gene expression analysis of pro-fibrotic genes (ACTA2, COL1A1, COL1A2 and POSTN) in vCM MTs treated with TGFβ alone or in combination with SB431542 (SB) or JQ1. Data are presented as mean ± SD (n = 3 independent experiments) relative to control vCM-MTs. Statistical analysis was performed using a Kruskal-Wallis test. (D,E) Ca2+ dynamics in vCM MTs treated with TGFβ alone or in combination with SB431542 (SB) or JQ1. (D) Averaged Ca2+ traces of treated vCM MTs. Error bars represent SEM. (E) Quantification of Ca2+ time to peak (Fmax/F0), Ca2+ tau, Ca2+ transient duration 50% (CaTD50) and Ca2+ transient duration (CaTD). Data are presented as mean ± SD (n = 16 control, n = 15 TGFβ, n = 15 TGFβ + SB, n = 17 TGFβ + JQ1 treated vCM MTs from 4 independent experiments). Statistical analysis was performed using a Kruskal-Wallis test. (F) Gene expression analysis of calcium handling genes (ATP2A2, RYR2 and CACNA1C) in vCM MTs treated with TGFβ alone or in combination with SB or JQ1. Data are presented as mean ± SD (n = 3 independent experiments) relative to control vCM-MTs. Statistical analysis was performed using a Kruskal-Wallis test. (G) Gene expression analysis of endothelial (CDH5 and PECAM1) and cardiac (TNNT2, ACTN2, DES and GJA1) and (H) In vCM MTs treated with TGFβ alone or in combination with SB or JQ1. Data are presented as mean ± SD (n = 3 independent experiments) relative to control vCM-MTs. Statistical analysis was performed using a Kruskal-Wallis test.

References

    1. Diseases GBD, Injuries C. Global burden of 369 diseases and injuries in 204 countries and territories, 1990–2019: a systematic analysis for the global burden of disease study 2019. Lancet. (2020) 396(10258):1204–22. 10.1016/S0140-6736(20)30925-9 - DOI - PMC - PubMed
    1. Mc Namara K, Alzubaidi H, Jackson JK. Cardiovascular disease as a leading cause of death: how are pharmacists getting involved? Integr Pharm Res Pract. (2019) 8:1–11. 10.2147/IPRP.S133088 - DOI - PMC - PubMed
    1. Roth GA, Mensah GA, Johnson CO, Addolorato G, Ammirati E, Baddour LM, et al. Global burden of cardiovascular diseases and risk factors, 1990–2019: update from the GBD 2019 study. J Am Coll Cardiol. (2020) 76(25):2982–3021. 10.1016/j.jacc.2020.11.010 - DOI - PMC - PubMed
    1. Khakoo AY, Yurgin NR, Eisenberg PR, Fonarow GC. Overcoming barriers to development of novel therapies for cardiovascular disease: insights from the oncology drug development experience. JACC Basic Transl Sci. (2019) 4(2):269–74. 10.1016/j.jacbts.2019.01.011 - DOI - PMC - PubMed
    1. Cho S, Lee C, Skylar-Scott MA, Heilshorn SC, Wu JC. Reconstructing the heart using iPSCs: engineering strategies and applications. J Mol Cell Cardiol. (2021) 157:56–65. 10.1016/j.yjmcc.2021.04.006 - DOI - PMC - PubMed