. 2023 Sep 4:11:1233317.
doi: 10.3389/fcell.2023.1233317. eCollection 2023.

Smarca4 deficiency induces Pttg1 oncogene upregulation and hyperproliferation of tubular and interstitial cells during kidney development

Affiliations

Smarca4 deficiency induces Pttg1 oncogene upregulation and hyperproliferation of tubular and interstitial cells during kidney development

Jinshu Xu et al. Front Cell Dev Biol. .

Abstract

Kidney formation and nephrogenesis are controlled by precise spatiotemporal gene expression programs, which are coordinately regulated by cell-cycle, cell type-specific transcription factors and epigenetic/chromatin regulators. However, the roles of epigenetic/chromatin regulators in kidney development and disease remain poorly understood. In this study, we investigated the impact of deleting the chromatin remodeling factor Smarca4 (Brg1), a human Wilms tumor-associated gene, in Wnt4-expressing cells. Smarca4 deficiency led to severe tubular defects and a shortened medulla. Through unbiased single-cell RNA sequencing analyses, we identified multiple types of Wnt4 Cre-labeled interstitial cells, along with nephron-related cells. Smarca4 deficiency increased interstitial cells but markedly reduced tubular cells, resulting in cells with mixed identity and elevated expression of cell-cycle regulators and genes associated with extracellular matrix and epithelial-to-mesenchymal transition/fibrosis. We found that Smarca4 loss induced a significant upregulation of the oncogene Pttg1 and hyperproliferation of Wnt4 Cre-labeled cells. These changes in the cellular state could hinder the cellular transition into characteristic tubular structures, eventually leading to fibrosis. In conclusion, our findings shed light on novel cell types and genes associated with Wnt4 Cre-labeled cells and highlight the critical role of Smarca4 in regulating tubular cell differentiation and the expression of the cancer-causing gene Pttg1 in the kidney. These findings may provide valuable insights into potential therapeutic strategies for renal cell carcinoma resulting from SMARCA4 deficiency.

Keywords: Pttg1; SWI/SNF chromatin remodeling complex; Smarca4/Brg1; Wnt4; fibrosis; nephron tubulogenesis; renal interstitium.


Conflict of interest statement

The authors declare that the research was conducted in the absence of any commercial or financial relationships that could be construed as a potential conflict of interest.

Figures

FIGURE 1
FIGURE 1
Conditional deletion of Smarca4 in Wnt4-expressing cells leads to abnormal nephron tubule formation. (A) H&E-stained mouse kidneys at E18.5 in Wnt4 Cre/+ and Smarca4 cKO/cKO littermates. The lower panels are a higher magnification of the upper panels. Green arrows indicate Henle’s loop, and blue arrows indicate nephron tubules. The black arrow indicates interstitial mesenchyme in the mutant. Most glomeruli (G) appear normal, but some are cystic. (B) Immunostaining for Wt1 (nephron progenitor, PTA/RV and podocyte). (C,D) Lectin staining with PHA-L (proximal tubule and podocyte) and LTL (proximal renal tubule). (E,F) Immunostaining for NCC (distal renal tubule) and THP (Henle’s loop) in control and mutant kidneys at E18.0. Arrow pints to the reduction of THP+ structures in the medullary region of the mutant kidney. abb.: CD, collecting duct; G, glomerulus; M, medullary region. Scale bars: 100 μm.
FIGURE 2
FIGURE 2
scRNA-seq delineates distinct types of cells derived from Wnt4-expressing cells and the effects of Smarca4 deficiency in these cells. (A) Unsupervised clustering demonstrates 24 distinct cell types shown in a tSNE plot of Wnt4 Cre -labled cells of control and Smarca4 cKO/cKO . (B) Percentages of assigned cell types are summarized in the right panel. NP, nephron progenitor; SSB, S-shaped body; NPC, nephron progenitor cell; PT, proximal tubule; EPT, early PT, SMCs, smooth muscle cells; CD-associated stroma, collecting duct-associated stroma; (C) tSNE plots showing restricted Wnt4 expression. (D) Violin plot showing the expression levels of representative marker genes across the 24 main clusters. The y-axis shows the long-scale normalized read count. (E) tSNE plots showing Pdgfrα in stroma cells, Pecam1 expression in endothelial cells and Foxd1 expression in stroma of nephrogenic, cortical and podocytes. (F) Immunostaining for Foxd1, Pecam1, Tyrobp, Tnnt2 and SMA showing colocalization with tdTomato+ cells in Wnt4 Cre/+ ;R26-tdTomato kidneys (arrows). Scale bar: 60 μm.
FIGURE 3
FIGURE 3
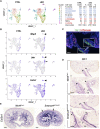
scRNA-seq analysis reveals distinct types of stromal cells derived from Wnt4-expressing cells and upregulation of Dlk1 and Col3a1 in Smarca4 cKO/cKO . (A) The UMAP plot of Wnt4 Cre -labeled stromal populations and SMCs of control and Smarca4 cKO/cKO . Percentages of assigned cell types are summarized in the right panel. Colored fonts indicate representative clusters of increased (red) or decreased (blue) cell numbers in the mutant. (B) The UMAP showing Mfap5, Dlk1 and Col3a1 expression. Arrowheads point to a ureteric stoma population (Mfap5 -) that emerged only in the mutant. Arrow indicates the upregulation of Dlk1 in the mutant. (C) Immunostaining for Dlk1 (green) on kidney section of Wnt4 Cre/+ ;tdTomato. Boxed area is also shown in higher magnification (arrow). (D) ISH on kidney sections showing Dlk1 expression in ureteral stroma in the outer layer (arrows) and some in the inner layer (open arrowheads) adjacent to the ureteric epithelium (UE) in the ureteropelvic kidney region and upregulation in the outer mesenchymal layer. (E) ISH on kidney sections at E17.5 showing upregulation of Col3a1 in Smarca4cKO. Arrows indicate the extension of Col3a1 expression to the cortical nephron primordium areas. Scale bars: 100 μm in (C,D) and 200 μm in (E).
FIGURE 4
FIGURE 4
Smarca4 KO leads to alterations in the developmental trajectories of stromal cells and increased Pttg1 expression. (A) UMAP showing strong Wnt4 expression in CD-associated stroma (arrows) and in some nephric and ureteric stromal cells and stromal cell differentiation trajectory from Wnt4-expressing CD-associated stromal progenitors towards cortical and ureteric stroma (middle panels) or from nephrogenic stromal progenitors towards other stroma cells (right panels). Cells are colored by pseudotime. The circles with numbers denote special points within the graph. Each leaf, denoted by light gray circles, corresponds to a different outcome (i.e., cell fate) of the trajectory. Black circles indicate branch nodes where cells can travel to one of several outcomes. The numbers within the circles are provided for reference purposes only. Note the lack of black circles in the control using nephrogenic stroma as the root. (B) UMAP representation of increased Pttg1 and Top2a transcription in stromal cells in Smarca4 cKO/cKO (arrows). (C) Immunofluorescence staining for Pttg1 showing increased levels of Pttg1 in Smarca4 cKO/cKO kidneys at E16.5. Arrows point to a tubular structure in the mutant. Branching ureteric buds are outlined by dashed lines. Abb.: SBB, S-shaped body. Scale bar: 50 μm. (D) Quantitative RT-PCR of FACS-purified tdTomato+ cells from control and Smarca4cKO kidneys. qPCR was performed in triplicate and repeated three times.
FIGURE 5
FIGURE 5
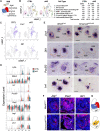
Early patterning of SSB was disrupted in Smarca4-deficient kidneys. (A) Schematic drawing of distinct nephron territories in SSB. CNT, connecting tubule segment. (B) UMAP plots showing 7 clusters of nephron precursors derived from Wnt4 Cre -labeled cells in control and Smarca4 cKO/cKO . Percentages of assigned cell types are summarized in the right panel. (C) UMAP plots showing Lhx1 and Dll1 expression in the SSB clusters. (D) Violin plots showing the levels of Lhx1, Jag1, Pax2, Pou3f3, Irx1, Wfdc2 and Ly6a expression in each cluster. Boxed SSB-PT cluster 4 showing increased Pax2, Wfdc2 and Ly6a in the mutant but no significant changes in the expression levels of Lhx1 and Jag1, while Pou3f3 and Irx1 expression levels were reduced in the mutant. (E) In situ hybridization for Lhx1, Dll1, Pou3f3, and Irx1 on kidney sections of E15.0 embryos (harvested around 5 p.m.). Note reduced Pou3f3 expression in some SSB in the mutant (arrow), and Irx1-negative proximal tubule primordium in control (arrows) and the absence of this region in the mutant (arrow). (F) Immunostaining for Jag1, Pax2, and Wt1 (podocyte) at E15.5. Arrows point to the PT territory and open arrows point to the podocyte regions. (G) Schematic summary of SSB Jag1+ domain in control and mutant. Abb.: CSB and SSB, comma- and S-shaped body; RV, renal vesicle. Scale bars: 30 μm.
FIGURE 6
FIGURE 6
Smarca4 loss induces upregulation of Pttg1 and mesenchymal ECM genes in nephron precursor cells as well as increased proliferation. (A) Violin plots showing the levels of Pttg1, Col3a1, Clo1a1 and Fn1 expression in each cluster. Boxed areas indicate increased Pttg1 expression in the committing NP and SSB clusters and increased expression of Col3a1, Col1a1 and Fn1 in the SSB clusters. (B) Anti-PH3 immunostaining showing increased PH3+ cells in Smarca4 cKO/cKO kidney. Arrow points to increased PH3+ cells in committing NP-PTA area. Quantification (see Methods) revealed that PH3+ cells in Smarca4cKO were 4.42 ± 0.23- or 7.5 ± 0.35-fold higher in cortex or medulla than controls. Abb.: CSB, comma-shaped body; UB, ureteric bud. Scale bar: 100 μm.
FIGURE 7
FIGURE 7
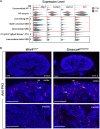
The expression of ECM and EMT markers are upregulated in nephron tubule cells in Smarca4cKO. (A) UMAP plot showing 9 major types of nephron tubule cells derived from Wnt4 Cre -labeled cells. Percentages of assigned cell types are summarized in the right panel. Colored fonts indicate representative clusters of decreased (blue) or increased (red) cell numbers in the mutant. (B) UMAP plot showing the upregulation of Ass1 expression in the EPT cells (arrows) in Smarca4cKO. (C) Violin plots showing the expression of Slc34a1, Wfdc2, Mki67, Cdk1, Col3a1, Col1a1, Fn1, Vimentin and Hif1a in control and Smarca4cKO cell clusters. Boxes outlined in the dashed redline indicate increased expression of Slc34a1 and Wfdc2 in the mutant EPT and other genes in the mutant EPT, PCT, PST, and CNT. (D) In situ hybridization on kidney sections at E17.5 showing upregulation and extension of Fn1 into the cortical region of the mutant kidneys. Arrows indicate Fn1-expressing cells in nephron tubular structures. (E) Immunostaining for Vimentin (red) and Ncam (green) showing increased Vimentin+ cells and the absence of Ncam+ epithelial tubules (arrows) in the mutant kidney. Abb.: G, glomerulus; NT, nephron tubule. Scale bar: 300 μm [top panels in (D)] and 100 μm [bottom panels in (D) and panels in (E)].

Similar articles

Cited by

References

    1. Adam M., Potter A. S., Potter S. S. (2017). Psychrophilic proteases dramatically reduce single-cell RNA-seq artifacts: A molecular atlas of kidney development. Development 144 (19), 3625–3632. 10.1242/dev.151142 - DOI - PMC - PubMed
    1. Al-Awqati Q., Oliver J. A. (2002). Stem cells in the kidney. Kidney Int. 61 (2), 387–395. 10.1046/j.1523-1755.2002.00164.x - DOI - PubMed
    1. Basta J. M., Singh A. P., Robbins L., Stout L., Pherson M., Rauchman M. (2020). The core SWI/SNF catalytic subunit Brg1 regulates nephron progenitor cell proliferation and differentiation. Dev. Biol. 464 (2), 176–187. 10.1016/j.ydbio.2020.05.008 - DOI - PMC - PubMed
    1. Benjamini Y., Hochberg Y. (1995). Controlling the false discovery rate - a practical and powerful approach to multiple testing. J. R. Stat. Soc. Ser. B-Methodological 57 (1), 289–300. 10.1111/j.2517-6161.1995.tb02031.x - DOI
    1. Bohnenpoll T., Feraric S., Nattkemper M., Weiss A. C., Rudat C., Meuser M., et al. (2017). Diversification of cell lineages in ureter development. J. Am. Soc. Nephrol. 28 (6), 1792–1801. 10.1681/ASN.2016080849 - DOI - PMC - PubMed