. 2023 Sep 15:11:e15937.
doi: 10.7717/peerj.15937. eCollection 2023.

AP003352.1/miR-141-3p axis enhances the proliferation of osteosarcoma by LPAR3

Affiliations

AP003352.1/miR-141-3p axis enhances the proliferation of osteosarcoma by LPAR3

Hongde Yu et al. PeerJ. .

Abstract

Osteosarcoma (OS) is a highly malignant tumor with a poor prognosis and a growing incidence. LncRNAs and microRNAs control the occurrence and development process of osteosarcoma through ceRNA patterns. The LPAR3 gene is important in cancer cell proliferation, apoptosis and disease development. However, the regulatory mechanism of the ceRNA network through which LPAR3 participates in osteosarcoma has not been clarified. Herein, our study demonstrated that the AP003352.1/miR-141-3p axis drives LPAR3 expression to induce the malignant progression of osteosarcoma. First, the expression of LPAR3 is regulated by the changes in AP003352.1 and miR-141-3p. Similar to the ceRNA of miR-141-3p, AP003352.1 regulates the expression of LPAR3 through this mechanism. In addition, the regulation of AP003352.1 in malignant osteosarcoma progression depends to a certain degree on miR-141-3p. Importantly, the AP003352.1/miR-141-3p/LPAR3 axis can better serve as a multi-gene diagnostic marker for osteosarcoma. In conclusion, our research reveals a new ceRNA regulatory network, which provides a novel potential target for the diagnosis and treatment of osteosarcoma.

Keywords: CeRNA; Cell proliferation; LPAR3; Osteosarcoma.


Conflict of interest statement

The authors declare that they have no competing interests.

Figures

Figure 1
Figure 1. Screening of lncRNAs, microRNAs, and mRNAs related to osteosarcoma progression.
The results of univariate cox and differential expression analysis of mRNAs, lncRNAs and miRNAs from the TCGA database (Target_OS) and GSE39040 database. Volcano plots of differential expression analysis of mRNAs, lncRNAs and miRNAs (A). The top ten results of univariate cox in mRNAs, lncRNAs and miRNAs (B). Heatmaps of overlapped results between univariate cox and differential expression analysis in mRNAs, lncRNAs and miRNAs (C).
Figure 2
Figure 2. Enrichment of tumor progression related genes in osteosarcoma.
C5 GO fuctional enrichment analysis of the diferentally exressed mRNAs. Bubble diagram of C5 GO analysis of mRNAs (A). C5 GO enrichment analysis of regulated mRNAs (B).
Figure 3
Figure 3. The construction of ceRNA network in osteosarcoma.
Construction of osteosarcoma related ceRNA network by integrated analysis. LncRNA-miRNA-mRNA regulatory axes extracted from this ceRNA network (A). The LncRNA-miRNA-mRNA pattern diagram (B).
Figure 4
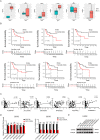
Figure 4. AP003352.1 may regulate LPAR3 at the mRNA and protein levels.
The expression of potential lncRNAs between tumor and normal tissues in osteosarcoma patients. The red box indicates the tumor tissue and the green box indicates the normal tissue. The statistical method is T-test (A). The survival curves of potential lncRNAs in osteosarcoma patients. Black lines indicate low expression of lncRNA and red lines indicate high expression of lncRNA (B). Pearson correlation coefficient analysis between AP003352.1 and LPAR3 (C). The mRNA level of LPAR3 in U2OS cells with six potential lncRNAs knockdown by ASO. The statistical method is T-test (D). The protein level of LPAR3 in U2OS cells with six potential lncRNAs knockdown by ASO (E). Values were expressed as the means ± SD from three experiments, and the asterisk indicates the statistical significance compared to the controls (***p < 0.001, ****p < 0.0001).
Figure 5
Figure 5. AP003352.1, miR-141-3p, and LPAR3 regulate the malignant progression of osteosarcoma.
The volcano plots of the DEGs in low expression group and high expression group among AP003352.1 and LPAR3 (A). The CCK8 assays of U2OS cells and MG63 cells were performed when AP003352.1, miR-141-3p and LPAR3 knockdown or inhibited for 48 h (B). The cloneformationassays of U2OS cells and MG63 cells were performed when AP003352.1, miR-141-3p and LPAR3 knockdown or inhibited for 48 h (C). The mRNA levels of AP003352.1, miR-141-3p and LPAR3 knockdown or inhibited after 10 days of clone formation (D). Values were expressed as the means ± SD from three experiments, and the asterisk indicates the statistical significance compared to the controls (**p < 0.01, ***p < 0.001, ****p < 0.0001).
Figure 6
Figure 6. AP003352.1 and miR-141-3p can regulate LPAR3 in osteosarcoma.
RT-qPCR assays and western blot were used to detect the expression of AP003352.1, miR-141-3p and LPAR3 in U2OS cells treated with AP003352.1 ASO for 48 h (A). RT-qPCR assays and western blot were used to detect the expression of AP003352.1, miR-141-3p and LPAR3 in U2OS cells treated with miR-141-3p inhibitor for 48 h (B). RT-qPCR assays and western blot were used to detect the expression of AP003352.1, miR-141-3p and LPAR3 in U2OS cells treated with miR-141-3p mimic for 48 h (C). Values were expressed as the means ± SD from three experiments, and the asterisk indicates the statistical significance compared to the controls (****p < 0.0001).
Figure 7
Figure 7. As the ceRNA of miR-141-3p, AP003352.1 regulates LPAR3 to affect the malignant progression of osteosarcoma.
Predicted binding site between miR-141-3p and AP003352.1 (A). Luciferase assays were performed to test the effect of miR-141-3p on wild-type or mutant AP003352.1 after treating with miR-141-3p mimic for 48 h (B). The CCK8 results of knockdown AP003352.1 in U2OS cells treated with NC mimic or miR-141-3p mimic for 48 h (C). The cloneformation results of knockdown AP003352.1 in U2OS cells treated with NC mimic or miR-141-3p mimic for 48 h (D). The CCK8 results of knockdown AP003352.1 in shNC or shLPAR3 U2OS cells (E). The cloneformation assay of knockdown AP003352.1 for 48 h in shNC or shLPAR3 U2OS cells (F). Values were expressed as the means ± SD from three experiments, and the asterisk indicates the statistical significance compared to the controls (***p < 0.001, ****p < 0.0001).
Figure 8
Figure 8. The AP003352.1/miR-141-3p/LPAR3 axis can be a better biomarker for predicting osteosarcoma prognosis.
LASSO regression coefficient profile of the intersection genes (A). LASSO deviance profile of the intersection genes (B). Distribution of risk score between low and high-risk groups in the training cohort (C). The heatmap based on the risk score in the training cohort (D). Survival status plot of the training cohort (E). Survival curves for the two groups in the training cohort (F). ROC curves based on the risk score in the training cohort (G).

Similar articles

Cited by

References

    1. Ali SA, Peffers MJ, Ormseth MJ, Jurisica I, Kapoor M. The non-coding RNA interactome in joint health and disease. Nature Reviews Rheumatology. 2021;17(11):692–705. doi: 10.1038/s41584-021-00687-y. - DOI - PubMed
    1. Aure MR, Fleischer T, Bjorklund S, Ankill J, Castro-Mondragon JA, Osbreac Borresen-Dale AL, Tost J, Sahlberg KK, Mathelier A, Tekpli X, Kristensen VN. Crosstalk between microRNA expression and DNA methylation drives the hormone-dependent phenotype of breast cancer. Genome Medicine. 2021;13(1):72. doi: 10.1186/s13073-021-00880-4. - DOI - PMC - PubMed
    1. Bartel DP. MicroRNAs: target recognition and regulatory functions. Cell. 2009;136(2):215–233. doi: 10.1016/j.cell.2009.01.002. - DOI - PMC - PubMed
    1. Califf RM. Biomarker definitions and their applications. Experimental Biology and Medicine. 2018;243(3):213–221. doi: 10.1177/1535370217750088. - DOI - PMC - PubMed
    1. Cazalla D, Steitz JA. Down-regulation of a host microRNA by a viral noncoding RNA. Cold Spring Harbor Symposia on Quantitative Biology. 2010;75:321–324. doi: 10.1101/sqb.2010.75.009. - DOI - PMC - PubMed

Publication types