

Fitness effects of mutations to SARS-CoV-2 proteins
- PMID: 37727875
- PMCID: PMC10506532
- DOI: 10.1093/ve/vead055
Fitness effects of mutations to SARS-CoV-2 proteins
Erratum in
-
Correction to: Fitness effects of mutations to SARS-CoV-2 proteins.Virus Evol. 2024 Mar 26;10(1):veae026. doi: 10.1093/ve/veae026. eCollection 2024. Virus Evol. 2024. PMID: 38577658 Free PMC article.
Abstract
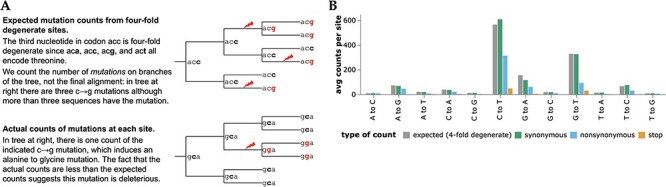
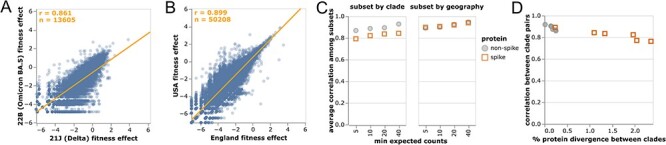
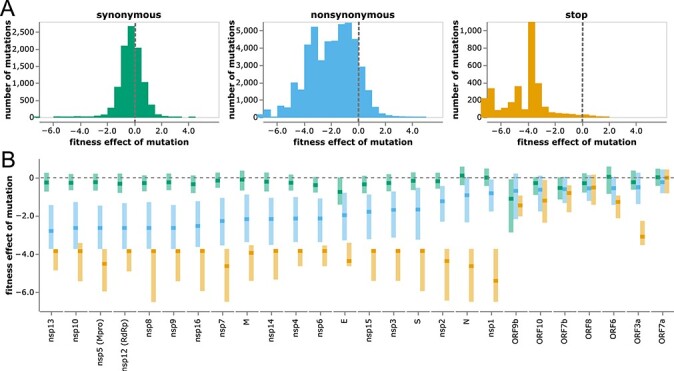
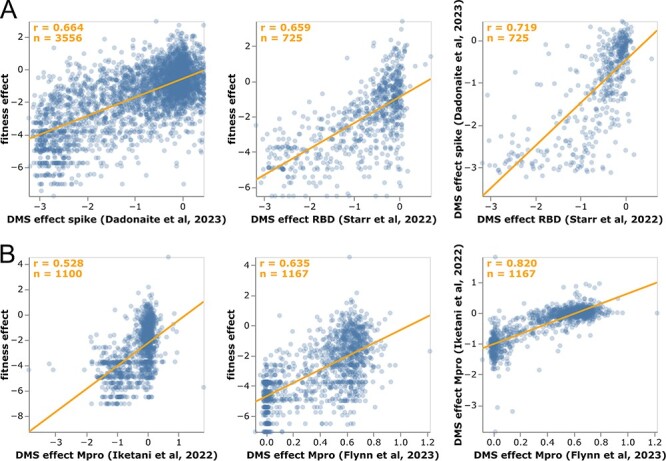
Knowledge of the fitness effects of mutations to SARS-CoV-2 can inform assessment of new variants, design of therapeutics resistant to escape, and understanding of the functions of viral proteins. However, experimentally measuring effects of mutations is challenging: we lack tractable lab assays for many SARS-CoV-2 proteins, and comprehensive deep mutational scanning has been applied to only two SARS-CoV-2 proteins. Here, we develop an approach that leverages millions of publicly available SARS-CoV-2 sequences to estimate effects of mutations. We first calculate how many independent occurrences of each mutation are expected to be observed along the SARS-CoV-2 phylogeny in the absence of selection. We then compare these expected observations to the actual observations to estimate the effect of each mutation. These estimates correlate well with deep mutational scanning measurements. For most genes, synonymous mutations are nearly neutral, stop-codon mutations are deleterious, and amino acid mutations have a range of effects. However, some viral accessory proteins are under little to no selection. We provide interactive visualizations of effects of mutations to all SARS-CoV-2 proteins (https://jbloomlab.github.io/SARS2-mut-fitness/). The framework we describe is applicable to any virus for which the number of available sequences is sufficiently large that many independent occurrences of each neutral mutation are observed.
Keywords: COVID-19; UShER; dN/dS; deep mutational scanning; fitness; mutation rate.
© The Author(s) 2023. Published by Oxford University Press.
Conflict of interest statement
J.D.B. consults Apriori Bio, Aerium Therapeutics, Invivyd, the Vaccine Company, GSK, and Pfizer on topics related to viral evolution. J.D.B. receives royalty payments as an inventor on Fred Hutch licensed patents related to deep mutational scanning of viral proteins.
Figures
Update of
-
Fitness effects of mutations to SARS-CoV-2 proteins.bioRxiv [Preprint]. 2023 Jun 6:2023.01.30.526314. doi: 10.1101/2023.01.30.526314. bioRxiv. 2023. Update in: Virus Evol. 2023 Sep 18;9(2):vead055. doi: 10.1093/ve/vead055. PMID: 36778462 Free PMC article. Updated. Preprint.
Similar articles
-
Fitness effects of mutations to SARS-CoV-2 proteins.bioRxiv [Preprint]. 2023 Jun 6:2023.01.30.526314. doi: 10.1101/2023.01.30.526314. bioRxiv. 2023. Update in: Virus Evol. 2023 Sep 18;9(2):vead055. doi: 10.1093/ve/vead055. PMID: 36778462 Free PMC article. Updated. Preprint.
-
An antibody-escape estimator for mutations to the SARS-CoV-2 receptor-binding domain.Virus Evol. 2022 May 11;8(1):veac021. doi: 10.1093/ve/veac021. eCollection 2022. Virus Evol. 2022. PMID: 35573973 Free PMC article.
-
An antibody-escape calculator for mutations to the SARS-CoV-2 receptor-binding domain.bioRxiv [Preprint]. 2021 Dec 7:2021.12.04.471236. doi: 10.1101/2021.12.04.471236. bioRxiv. 2021. Update in: Virus Evol. 2022 May 11;8(1):veac021. doi: 10.1093/ve/veac021. PMID: 34909770 Free PMC article. Updated. Preprint.
-
Mutations and Evolution of the SARS-CoV-2 Spike Protein.Viruses. 2022 Mar 19;14(3):640. doi: 10.3390/v14030640. Viruses. 2022. PMID: 35337047 Free PMC article. Review.
-
The Development of SARS-CoV-2 Variants: The Gene Makes the Disease.J Dev Biol. 2021 Dec 15;9(4):58. doi: 10.3390/jdb9040058. J Dev Biol. 2021. PMID: 34940505 Free PMC article. Review.
Cited by
-
Full-spike deep mutational scanning helps predict the evolutionary success of SARS-CoV-2 clades.bioRxiv [Preprint]. 2023 Nov 14:2023.11.13.566961. doi: 10.1101/2023.11.13.566961. bioRxiv. 2023. Update in: Nature. 2024 Jul;631(8021):617-626. doi: 10.1038/s41586-024-07636-1. PMID: 38014024 Free PMC article. Updated. Preprint.
-
Spike deep mutational scanning helps predict success of SARS-CoV-2 clades.Nature. 2024 Jul;631(8021):617-626. doi: 10.1038/s41586-024-07636-1. Epub 2024 Jul 3. Nature. 2024. PMID: 38961298 Free PMC article.
-
Adsorption-Driven Deformation and Footprints of the RBD Proteins in SARS-CoV-2 Variants on Biological and Inanimate Surfaces.J Chem Inf Model. 2024 Aug 12;64(15):5977-5990. doi: 10.1021/acs.jcim.4c00460. Epub 2024 Jul 31. J Chem Inf Model. 2024. PMID: 39083670 Free PMC article.
-
Balancing stability and function: impact of the surface charge of SARS-CoV-2 Omicron spike protein.Npj Viruses. 2025 Apr 1;3(1):23. doi: 10.1038/s44298-025-00104-1. Npj Viruses. 2025. PMID: 40295844 Free PMC article. Review.
-
Phylogenetic signatures reveal multilevel selection and fitness costs in SARS-CoV-2.Wellcome Open Res. 2024 Jul 24;9:85. doi: 10.12688/wellcomeopenres.20704.2. eCollection 2024. Wellcome Open Res. 2024. PMID: 39132669 Free PMC article.
References
-
- Aksamentov I. et al. (2021) ‘Nextclade: clade assignment, mutation calling and quality control for viral genomes’, Journal of Open Source Software, 6: 3773.
-
- Beale R. C. et al. (2004) ‘Comparison of the differential context-dependence of DNA deamination by APOBEC enzymes: correlation with mutation spectra in vivo’, Journal of Molecular Biology, 337: 585–596. - PubMed
Grants and funding
LinkOut - more resources
Full Text Sources
Miscellaneous
