. 2023 Nov 1;130(5):1067-1080.
doi: 10.1152/jn.00108.2023. Epub 2023 Sep 20.

A personalized cortical atlas for functional regions of interest

Affiliations

A personalized cortical atlas for functional regions of interest

M Fiona Molloy et al. J Neurophysiol. .

Abstract

Advances in functional MRI (fMRI) allow mapping an individual's brain function in vivo. Task fMRI can localize domain-specific regions of cognitive processing or functional regions of interest (fROIs) within an individual. Moreover, data from resting state (no task) fMRI can be used to define an individual's connectome, which can characterize that individual's functional organization via connectivity-based parcellations. However, can connectivity-based parcellations alone predict an individual's fROIs? Here, we describe an approach to compute individualized rs-fROIs (i.e., regions that correspond to given fROI constructed using only resting state data) for motor control, working memory, high-level vision, and language comprehension. The rs-fROIs were computed and validated using a large sample of young adults (n = 1,018) with resting state and task fMRI from the Human Connectome Project. First, resting state parcellations were defined across a sequence of resolutions from broadscale to fine-grained networks in a training group of 500 individuals. Second, 21 rs-fROIs were defined from the training group by identifying the rs network that most closely matched task-defined fROIs across all individuals. Third, the selectivity of rs-fROIs was investigated in a training set of the remaining 518 individuals. All computed rs-fROIs were indeed selective for their preferred category. Critically, the rs-fROIs had higher selectivity than probabilistic atlas parcels for nearly all fROIs. In conclusion, we present a potential approach to define selective fROIs on an individual-level circumventing the need for multiple task-based localizers.NEW & NOTEWORTHY We compute individualized resting state parcels that identify an individual's own functional regions of interest (fROIs) for high-level vision, language comprehension, motor control, and working memory, using only their functional connectome. This approach demonstrates a rapid and powerful alternative for finding a large set of fROIs in an individual, using only their unique connectivity pattern, which does not require the costly acquisition of multiple fMRI localizer tasks.

Keywords: fMRI; functional connectivity; functional regions of interest; individual differences; parcellation.


Conflict of interest statement

No conflicts of interest, financial or otherwise, are declared by the authors.

Figures

None
Graphical abstract
Figure 1.
Figure 1.
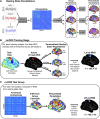
Schematic. A: first, the high-resolution connectome is computed from the pairwise correlations of the BOLD time course of each vertex. The pictured timeseries are randomly generated. Connectomes are calculated on an individual level. The group-average connectome of 500 random subjects is pictured. Second, from this group-level connectome, k-means is run from k = 2 to 200 clusters to define group-level parcellations. Third, individual-level parcellations are calculated for the remaining 518 subjects using k-nearest neighbor’s classification (k-NN). Three subject’s parcellations are shown for the k = 7 parcellation. B: in the training stage, an individual’s actual fROI (task-fROI) is matched to all resting state parcellations (from k = 2 to k = 200 networks). For each subject in the n = 500 training set, a task-fROI is defined from the task data using the group-constrained search space method (26). Then, the dice overlap is computed between that individual’s task-fROI and all networks (e.g., network 1 to k in each k-parcellation) within each k-resting state parcellation. The final rs-fROI that will be applied to the test set is selected by finding the network with the highest dice across all subjects and parcellations. For example, the identified rs-fROI for the Left Hand (LH) fROI is network #53 from the k = 198 network resting state parcellation. C: then, for each subject in the testing group (n = 518), the rs-fROI is computed using only the resting state data. From an individual’s resting state connectome, each vertex is assigned to a given network using k-nearest neighbor classification based on similarity of its functional connectivity to the centroids of the k-parcellation identified in the training stage (e.g., k = 198 for LH). Then, the rs-fROI for that individual is computed by selecting the top network identified in the training stage (e.g., network #53 from k = 198). Note that the rs-fROIs identified in the testing group are computed using only that individual’s resting state functional connectivity. fROI, functional region of interest; rs, resting state.
Figure 2.
Figure 2.
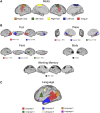
Search spaces for functional regions of interest (fROIs). A: the motor search spaces are identified for each body part (e.g., right hand – the average of all others is identified in red). B: for the working memory task, five contrasts were used to localize activity related to tools, places, faces, bodies, and working memory. Three contrasts included multiple search spaces and those different components are separated by color: tool includes lateral occipital (tool 1: LO) and posterior fusiform sulcus (tool 2: PFS); place includes parahippocampal place area (place 1: PPA), retrosplenial cortex (place 2: RSC), and transverse occipital sulcus (place 3: TOS); and face includes fusiform face area (face 1: FFA), occipital face area (face 2: OFA), and superior temporal sulcus (face 3: STS). C: in the language comprehension task, the six different search spaces were obtained from Fedorenko et al. (26).
Figure 3.
Figure 3.
Resting state (rs)-fROIs. The identified functional regions of interest constructed from resting state functional connectivity (i.e., rs-fROIs) with the highest overlap with a given contrast/search space in the motor task, working memory task, and language task are plotted on the surface for each putative fROI. The motor rs-fROIs are identified for each body part (e.g., right hand – the average of all others is identified in red). For the working memory task, five contrasts were used to localize activity related to tools, places, faces, bodies, and working memory. Three contrasts included multiple search spaces and those different components are separated by color: tool includes lateral occipital (tool 1: LO) and posterior fusiform sulcus (tool 2: PFS); place includes parahippocampal place area (place 1: PPA), retrosplenial cortex (place 2: RSC), and transverse occipital sulcus (place 3: TOS); and face includes fusiform face area (face 1: FFA), occipital face area (face 2: OFA), and superior temporal sulcus (face 3: STS). In the language comprehension task, only one contrast was used (Story – Math), but six different components were localized using search spaces from Fedorenko et al. (26). fROI, functional region of interest.
Figure 4.
Figure 4.
Selectivity of rs-fROIs. Each panel shows the percent signal change for all conditions of interest within a putative functional region of interest. The height of the bar shows the mean percent signal change, and the error bars show the standard error of the mean. FFA, fusiform face area; fROI, functional region of interest; LO, lateral occipital; OFA, occipital face area; PFS, posterior fusiform sulcus; PPA, parahippocampal place area; rs, resting state; RSC, retrosplenial cortex; TOS, transverse occipital sulcus.
Figure 5.
Figure 5.
Number of times vertices are boundaries. A: yellow colors indicate if a vertex is a boundary between networks for all the k network parcellations from k = 2 to 200 (maximum of 199 parcellations). Blue colors indicate areas where vertices are never separated into different networks. B: the mean number of parcellations where vertices are boundaries was computed within each rs-fROI. The bar plot shows the average across rs-fROIs for each domain, with the error bars indicating the standard error of the mean. fROI, functional region of interest; rs, resting state.

Similar articles

Cited by

References

    1. Brodmann K. Vergleichende Lokalisationslehre der Grosshirnrinde in ihren Prinzipien dargestellt auf Grund des Zellenbaues. Leipzig, Germany: Barth, 1909.
    1. Makris N, Goldstein JM, Kennedy D, Hodge SM, Caviness VS, Faraone SV, Tsuang MT, Seidman LJ. Decreased volume of left and total anterior insular lobule in schizophrenia. Schizophr Res 83: 155–171, 2006. doi:10.1016/j.schres.2005.11.020. - DOI - PubMed
    1. Dickie DA, Shenkin SD, Anblagan D, Lee J, Blesa Cabez M, Rodriguez D, Boardman JP, Waldman A, Job DE, Wardlaw JM. Whole brain magnetic resonance image atlases: a systematic review of existing atlases and caveats for use in population imaging. Front Neuroinform 11: 1, 2017. doi:10.3389/fninf.2017.00001. - DOI - PMC - PubMed
    1. Eickhoff SB, Yeo BTT, Genon S. Imaging-based parcellations of the human brain. Nat Rev Neurosci 19: 672–686, 2018. doi:10.1038/s41583-018-0071-7. - DOI - PubMed
    1. Betzel RF, Byrge L, He Y, Goñi J, Zuo XN, Sporns O. Changes in structural and functional connectivity among resting state networks across the human lifespan. NeuroImage 102: 345–357, 2014. doi:10.1016/j.neuroimage.2014.07.067. - DOI - PubMed

Publication types

LinkOut - more resources