

Alpha and theta band activity share information relevant to proactive and reactive control during conflict-modulated response inhibition
- PMID: 37728249
- PMCID: PMC10619371
- DOI: 10.1002/hbm.26486
Alpha and theta band activity share information relevant to proactive and reactive control during conflict-modulated response inhibition
Abstract
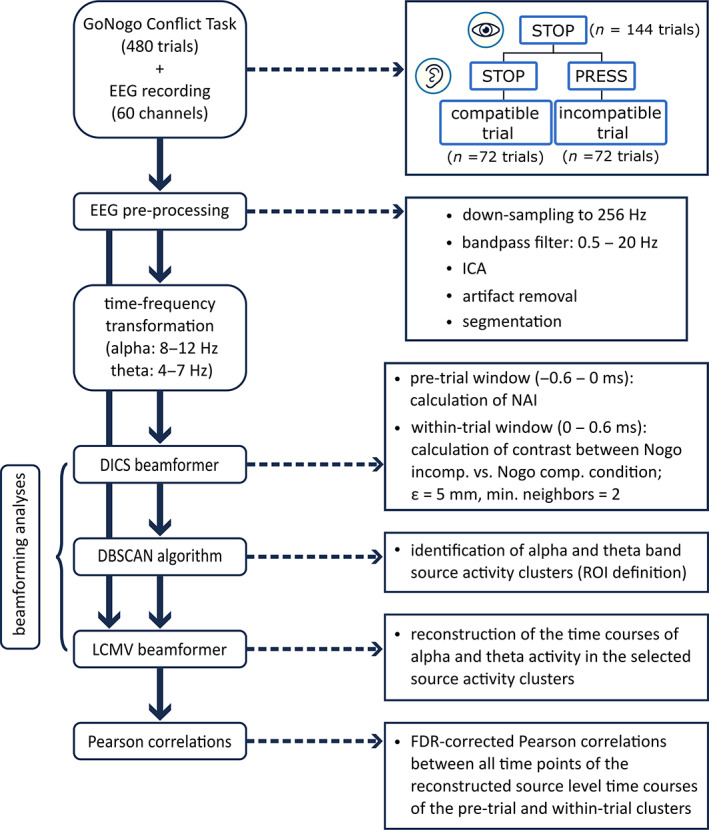
Response inhibition is an important instance of cognitive control and can be complicated by perceptual conflict. The neurophysiological mechanisms underlying these processes are still not understood. Especially the relationship between neural processes directly preceding cognitive control (proactive control) and processes underlying cognitive control (reactive control) has not been examined although there should be close links. In the current study, we investigate these aspects in a sample of N = 50 healthy adults. Time-frequency and beamforming approaches were applied to analyze the interrelation of brain states before (pre-trial) and during (within-trial) cognitive control. The behavioral data replicate a perceptual conflict-dependent modulation of response inhibition. During the pre-trial period, insular, inferior frontal, superior temporal, and precentral alpha activity was positively correlated with theta activity in the same regions and the superior frontal gyrus. Additionally, participants with a stronger pre-trial alpha activity in the primary motor cortex showed a stronger (within-trial) conflict effect in the theta band in the primary motor cortex. This theta conflict effect was further related to a stronger theta conflict effect in the midcingulate cortex until the end of the trial. The temporal cascade of these processes suggests that successful proactive preparation (anticipatory information gating) entails a stronger reactive processing of the conflicting stimulus information likely resulting in a realization of the need to adapt the current action plan. The results indicate that theta and alpha band activity share and transfer aspects of information when it comes to the interrelationship between proactive and reactive control during conflict-modulated motor inhibition.
Keywords: EEG; LCMV beamforming; alpha power; proactive control; response inhibition; theta power; time-frequency analysis.
© 2023 The Authors. Human Brain Mapping published by Wiley Periodicals LLC.
Conflict of interest statement
The authors declare no conflicts of interest.
Figures


Similar articles
-
Pre-trial theta band activity in the ventromedial prefrontal cortex correlates with inhibition-related theta band activity in the right inferior frontal cortex.Neuroimage. 2020 Oct 1;219:117052. doi: 10.1016/j.neuroimage.2020.117052. Epub 2020 Jun 12. Neuroimage. 2020. PMID: 32540357
-
Frontal midline theta differentiates separate cognitive control strategies while still generalizing the need for cognitive control.Sci Rep. 2021 Jul 19;11(1):14641. doi: 10.1038/s41598-021-94162-z. Sci Rep. 2021. PMID: 34282209 Free PMC article.
-
Frontal-midline theta reflects different mechanisms associated with proactive and reactive control of inhibition.Neuroimage. 2021 Nov 1;241:118400. doi: 10.1016/j.neuroimage.2021.118400. Epub 2021 Jul 23. Neuroimage. 2021. PMID: 34311382 Clinical Trial.
-
Frontal theta as a mechanism for cognitive control.Trends Cogn Sci. 2014 Aug;18(8):414-21. doi: 10.1016/j.tics.2014.04.012. Epub 2014 May 15. Trends Cogn Sci. 2014. PMID: 24835663 Free PMC article. Review.
-
Midfrontal Theta Activity in Psychiatric Illness: An Index of Cognitive Vulnerabilities Across Disorders.Biol Psychiatry. 2022 Jan 15;91(2):173-182. doi: 10.1016/j.biopsych.2021.08.020. Epub 2021 Sep 3. Biol Psychiatry. 2022. PMID: 34756560 Review.
Cited by
-
Low-Frequency Oscillations in Mid-rostral Dorsolateral Prefrontal Cortex Support Response Inhibition.J Neurosci. 2024 Oct 2;44(40):e0122242024. doi: 10.1523/JNEUROSCI.0122-24.2024. J Neurosci. 2024. PMID: 39197939 Free PMC article.
-
The Effect of Rhythmic Audio-Visual Stimulation on Inhibitory Control: An ERP Study.Brain Sci. 2024 May 17;14(5):506. doi: 10.3390/brainsci14050506. Brain Sci. 2024. PMID: 38790484 Free PMC article.
-
Alpha and theta oscillations on a visual strategic processing task in age-related hearing loss.Front Neurosci. 2024 Jul 16;18:1382613. doi: 10.3389/fnins.2024.1382613. eCollection 2024. Front Neurosci. 2024. PMID: 39086839 Free PMC article.
-
The correlation between muscle strength, inhibitory function, and cognitive function in older adults with cognitive impairment: evidence from resting-state electroencephalography.Front Aging Neurosci. 2025 Jun 20;17:1574275. doi: 10.3389/fnagi.2025.1574275. eCollection 2025. Front Aging Neurosci. 2025. PMID: 40620288 Free PMC article.
References
-
- Achenbach, T. M. , & Rescorla, L. (2003). Manual for the ASEBA adult forms & profiles. University of Vermont Research Center for Children, Youth, & Families.
Publication types
MeSH terms
LinkOut - more resources
Full Text Sources
