

A novel in vitro system of supported planar endosomal membranes (SPEMs) reveals an enhancing role for cathepsin B in the final stage of Ebola virus fusion and entry
- PMID: 37728342
- PMCID: PMC10581071
- DOI: 10.1128/spectrum.01908-23
A novel in vitro system of supported planar endosomal membranes (SPEMs) reveals an enhancing role for cathepsin B in the final stage of Ebola virus fusion and entry
Abstract
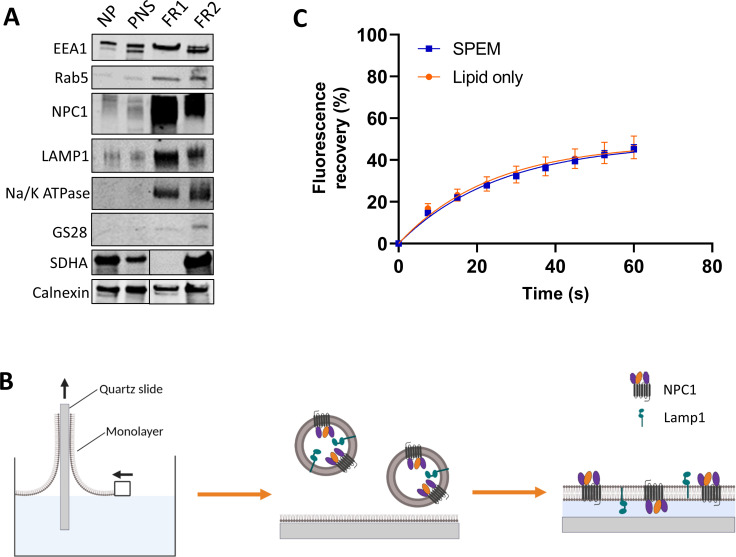
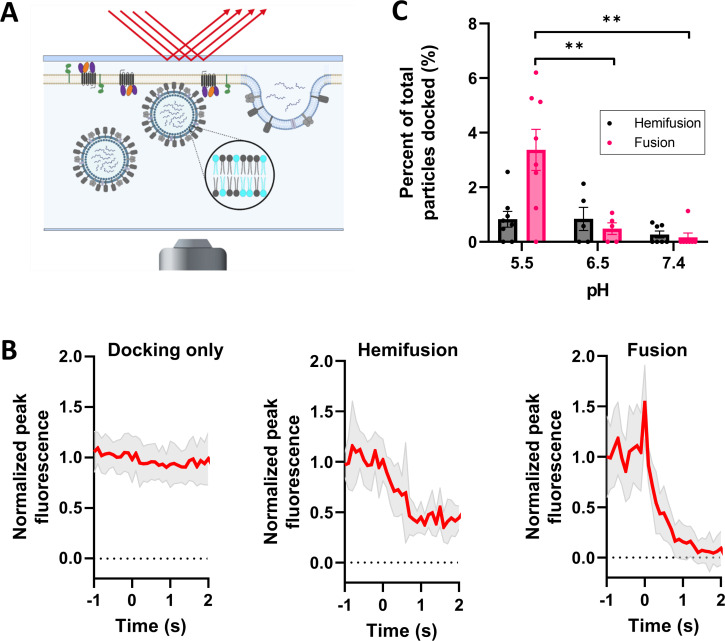
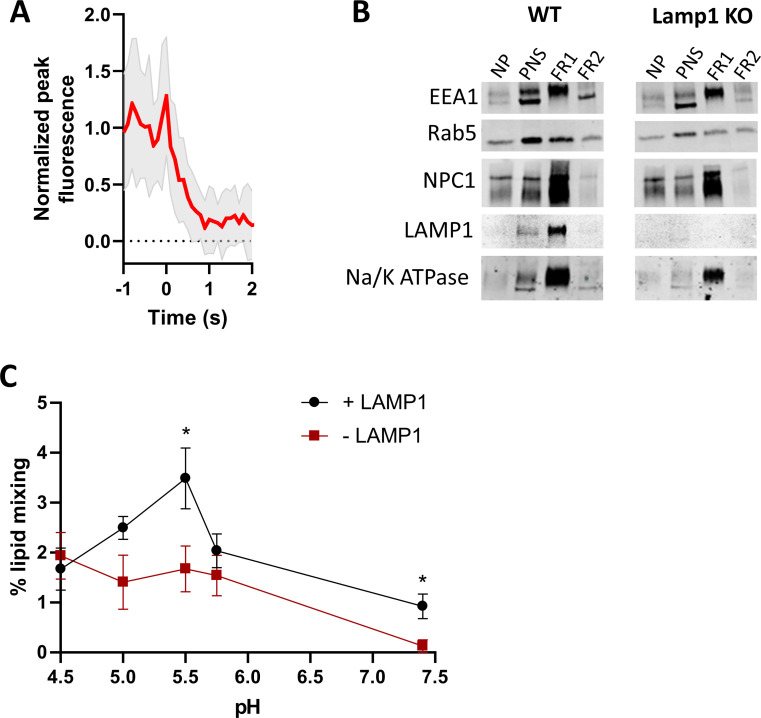
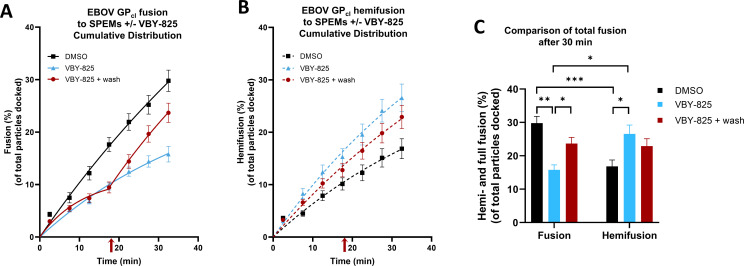
Ebola virus (EBOV) causes a hemorrhagic fever with fatality rates up to 90%. The EBOV entry process is complex and incompletely understood. Following attachment to host cells, EBOV is trafficked to late endosomes/lysosomes where its glycoprotein (GP) is processed to a 19-kDa form, which binds to the EBOV intracellular receptor Niemann-Pick type C1. We previously showed that the cathepsin protease inhibitor, E-64d, blocks infection by pseudovirus particles bearing 19-kDa GP, suggesting that further cathepsin action is needed to trigger fusion. This, however, has not been demonstrated directly. Since 19-kDa Ebola GP fusion occurs in late endosomes, we devised a system in which enriched late endosomes are used to prepare supported planar endosomal membranes (SPEMs), and fusion of fluorescent (pseudo)virus particles is monitored by total internal reflection fluorescence microscopy. We validated the system by demonstrating the pH dependencies of influenza virus hemagglutinin (HA)-mediated and Lassa virus (LASV) GP-mediated fusion. Using SPEMs, we showed that fusion mediated by 19-kDa Ebola GP is dependent on low pH, enhanced by Ca2+, and augmented by the addition of cathepsins. Subsequently, we found that E-64d inhibits full fusion, but not lipid mixing, mediated by 19-kDa GP, which we corroborated with the reversible cathepsin inhibitor VBY-825. Hence, we provide both gain- and loss-of-function evidence that further cathepsin action enhances the fusion activity of 19-kDa Ebola GP. In addition to providing new insights into how Ebola GP mediates fusion, the approach we developed employing SPEMs can now be broadly used for studies of virus and toxin entry through endosomes. IMPORTANCE Ebola virus is the causative agent of Ebola virus disease, which is severe and frequently lethal. EBOV gains entry into cells via late endosomes/lysosomes. The events immediately preceding fusion of the viral and endosomal membranes are incompletely understood. In this study, we report a novel in vitro system for studying virus fusion with endosomal membranes. We validated the system by demonstrating the low pH dependencies of influenza and Lassa virus fusion. Moreover, we show that further cathepsin B action enhances the fusion activity of the primed Ebola virus glycoprotein. Finally, this model endosomal membrane system should be useful in studying the mechanisms of bilayer breaching by other enveloped viruses, by non-enveloped viruses, and by acid-activated bacterial toxins.
Keywords: Ebola virus; Lassa; acid activated toxins; endosomal receptors; endosomes; enveloped virus; filovirus; genome entry; hemorrhagic fever viruses; influenza; non-enveloped virus; viral membrane fusion.
Conflict of interest statement
The authors declare no conflict of interest.
Figures
Similar articles
-
Ebola virus and severe acute respiratory syndrome coronavirus display late cell entry kinetics: evidence that transport to NPC1+ endolysosomes is a rate-defining step.J Virol. 2015 Mar;89(5):2931-43. doi: 10.1128/JVI.03398-14. Epub 2014 Dec 31. J Virol. 2015. PMID: 25552710 Free PMC article.
-
Arbidol and Other Low-Molecular-Weight Drugs That Inhibit Lassa and Ebola Viruses.J Virol. 2019 Apr 3;93(8):e02185-18. doi: 10.1128/JVI.02185-18. Print 2019 Apr 15. J Virol. 2019. PMID: 30700611 Free PMC article.
-
Direct Visualization of Ebola Virus Fusion Triggering in the Endocytic Pathway.mBio. 2016 Feb 9;7(1):e01857-15. doi: 10.1128/mBio.01857-15. mBio. 2016. PMID: 26861015 Free PMC article.
-
Filovirus entry: a novelty in the viral fusion world.Viruses. 2012 Feb;4(2):258-75. doi: 10.3390/v4020258. Epub 2012 Feb 7. Viruses. 2012. PMID: 22470835 Free PMC article. Review.
-
Potential pharmacological strategies targeting the Niemann-Pick C1 receptor and Ebola virus glycoprotein interaction.Eur J Med Chem. 2021 Nov 5;223:113654. doi: 10.1016/j.ejmech.2021.113654. Epub 2021 Jun 19. Eur J Med Chem. 2021. PMID: 34175537 Review.
Cited by
-
An overview of the role of Niemann-pick C1 (NPC1) in viral infections and inhibition of viral infections through NPC1 inhibitor.Cell Commun Signal. 2023 Dec 14;21(1):352. doi: 10.1186/s12964-023-01376-x. Cell Commun Signal. 2023. PMID: 38098077 Free PMC article. Review.
-
Regulation of Ebola GP conformation and membrane binding by the chemical environment of the late endosome.PLoS Pathog. 2023 Dec 6;19(12):e1011848. doi: 10.1371/journal.ppat.1011848. eCollection 2023 Dec. PLoS Pathog. 2023. PMID: 38055723 Free PMC article.
-
Novel proteolytic activation of Ebolavirus glycoprotein GP by TMPRSS2 and cathepsin L at an uncharted position can compensate for furin cleavage.Virus Res. 2024 Sep;347:199430. doi: 10.1016/j.virusres.2024.199430. Epub 2024 Jul 8. Virus Res. 2024. PMID: 38964470 Free PMC article.
-
Label-Free Detection of Virus-Membrane Interactions Using Surface-Enhanced Infrared Absorption (SEIRA) Spectroscopy.Angew Chem Int Ed Engl. 2025 Jul 28;64(31):e202502998. doi: 10.1002/anie.202502998. Epub 2025 Jun 9. Angew Chem Int Ed Engl. 2025. PMID: 40489072 Free PMC article.
-
Molecular basis for the increased fusion activity of the Ebola virus glycoprotein epidemic variant A82V: Insights from simulations and experiments.Cell Rep. 2025 Apr 22;44(4):115521. doi: 10.1016/j.celrep.2025.115521. Epub 2025 Apr 4. Cell Rep. 2025. PMID: 40186866 Free PMC article.
References
-
- FDA. 2019. Ervebo. Available from: https://www.fda.gov/vaccines-blood-biologics/ervebo. 9 Jun 2022.
-
- EMA. 2020. Zabdeno. Available from: https://www.ema.europa.eu/en/medicines/human/EPAR/zabdeno. 9 Jun 2022.
-
- EMA. 2020. Mvabea. Available from: https://www.ema.europa.eu/en/medicines/human/EPAR/mvabea. 9 Jun 2022.
Grants and funding
LinkOut - more resources
Full Text Sources
Miscellaneous
