. 2023 Oct 31;14(5):e0141123.
doi: 10.1128/mbio.01411-23. Epub 2023 Sep 20.

The morphogenic protein CopD controls the spatio-temporal dynamics of PBP1a and PBP2b in Streptococcus pneumoniae

Affiliations

The morphogenic protein CopD controls the spatio-temporal dynamics of PBP1a and PBP2b in Streptococcus pneumoniae

Cassandra Lenoir et al. mBio. .

Abstract

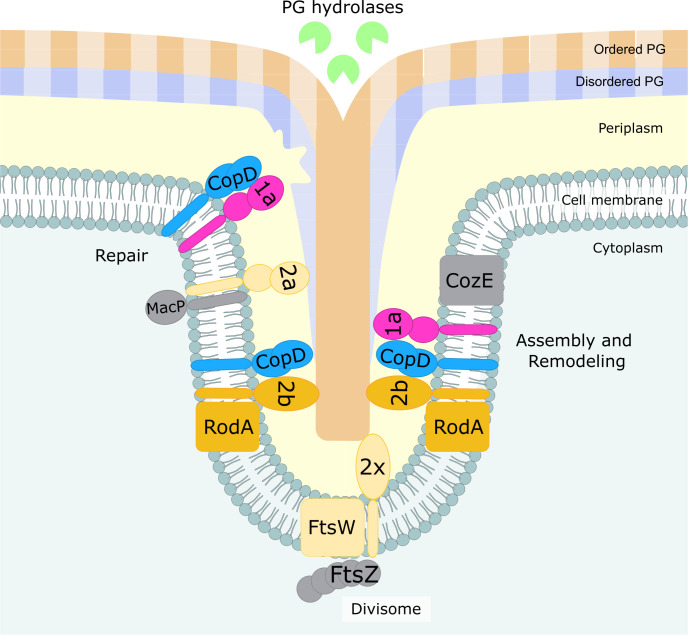
Penicillin-binding proteins (PBPs) are essential for proper bacterial cell division and morphogenesis. The genome of Streptococcus pneumoniae encodes for two class B PBPs (PBP2x and 2b), which are required for the assembly of the peptidoglycan framework and three class A PBPs (PBP1a, 1b and 2a), which remodel the peptidoglycan mesh during cell division. Therefore, their activities should be finely regulated in space and time to generate the pneumococcal ovoid cell shape. To date, two proteins, CozE and MacP, are known to regulate the function of PBP1a and PBP2a, respectively. In this study, we describe a novel regulator (CopD) that acts on both PBP1a and PBP2b. These findings provide valuable information for understanding bacterial cell division. Furthermore, knowing that ß-lactam antibiotic resistance often arises from PBP mutations, the characterization of such a regulator represents a promising opportunity to develop new strategies to resensitize resistant strains.

Keywords: Streptococcus pneumoniae; cell division; cell morphogenesis; penicillin-binding proteins; peptidoglycan.


Conflict of interest statement

The authors declare no conflict of interest.

Figures

Fig 1
Fig 1
CopD and cell morphology and growth. (A) Schematic model for CopD. The two PEPSY domains were modeled using Alphafold (https://alphafold.com/entry/Q8DP25) and are adapted from published structural information of PEPSY-domains (PDB ID 5BOI). The predicted transmembrane domain and the short cytoplasmic domain (16 amino acids) are shown as red and orange α-helices, respectively. The two PEPSY domains are shown in dark and light blue. (B) Growth of WT and ∆copD strains. Strains were grown in C + Y medium at 37°C in a spectrophotometer. The OD550 was read automatically every 10 minutes. (C) Representative phase contrast microscopy images of WT and ∆copD cells. Scale bar, 2 µm. (D) Violin plot showing the distribution of the cell length (left panel) and cell width (right panel) for WT and ∆copD strains as determined using MicrobeJ (31). The distribution of the cell length and width are shown in red for the WT strain and in blue for the ∆copD strain. Statistical comparison was done using t-test. *P < 0.05. n = 3 indicates the number of independent experiments with a total of 5,000 cells analyzed. (E) Western immunoblot of whole-cell lysates from WT and ∆copD-PcomX-copD cells, grown to exponential phase in the presence (0.2 µM) or absence of the ComS inducer, were probed with anti-CopD antibody. To estimate the relative quantity of proteins in crude extract and to compare the different lanes, we used the enolase (Spr1036) as an internal standard. The enolase was detected using specific antibodies (α Enolase) and is presented in the lower part of the Figure. (F) Violin plot showing the distribution of the cell width for WT and ∆copD-PcomX-copD strains as determined using MicrobeJ (31). The distribution of the cell length (left panel) and cell width (right panel) is shown in red for the WT strain and in blue for the ∆copD-PcomX-copD strain. Statistical comparison was done using t-test. n = 5 indicates the number of independent experiments with a total of 10,000 cells analyzed. For panels D and F, the box indicates the 25th to the 75th percentile, and the whiskers indicate the minimum and the maximum values. The mean and the median are indicated with a dot and a line in the box, respectively.
Fig 2
Fig 2
Localization of CopD-sfGFP, mKate2-PBP1a, and mkate2-PBP2b. (A) Overlays (left panel) between phase-contrast and GFP images of CopD-sfGFP cells. Scale bar, 2 µm. The heatmap (right panel) represents the localization patterns of CopD-sfGFP during the cell cycle. (B) and (C) co-localization of CopD-sfGFP and either mkate2-PBP1a (B) or mkate2-PBP2b (C) in WT cells. Overlays between phase contrast and GFP and mKate2 images are shown on the left while corresponding heatmaps representing the two-dimensional localization patterns during the cell cycle are shown on the right. Scale bar, 2 µm. The n values represent the number of cells analyzed in a single representative experiment. Experiments were performed in triplicate.
Fig 3
Fig 3
Analysis of the interaction between CopD, PBP1a and PBP2b. (A) Bacterial two-hybrid analyses. Plasmids, expressing the T25 fragment of the adenylate cyclase protein fused to the N-terminus of CopD or the T18 fragment fused to the N-terminus of PBP1a, PBP2b, and derivatives, were constructed and the interactions between CopD and either PBP1a or PBP2b or derivatives were assessed after co-transformation of T18- and T25-constructs in E. coli BTH101. The blue coloration indicates positive interactions. (B) Immunoprecipitation of PBP1a and PBP2b with CopD-sfGFP in copD-sfGfp and PcomX-sfGfp strains using anti-GFP antibodies. Samples were analyzed by immunoblotting using either anti-GFP (left panel) to check that the specificity of the anti-GFP immunoprecipitation, or anti-PBP1a antibodies (middle panel) or anti-PBP2b antibodies (right panel) to determine the presence of co-immunoprecipitated mkate2-PBP1a or mkate2-PBP2b, respectively. The data shown are representatives of experiments made independently in triplicate. (C) Affinity measurements by Microscale Thermophoresis of labeled CopD-6His binding to increasing concentrations of either PBP1aTP-6his (left panel) or PBP2bTP-6His (right panel). The fraction bound FNorm (normalized fluorescence = fluorescence after thermophoresis/initial fluorescence) is plotted as a function of ligand concentration. Measures are represented by green dots and the fitted curve by green lines. The KD is not measurable and >10−5 M. Experiments were made independently in triplicate.
Fig 4
Fig 4
Localization of GFP-PBP1a, GFP-PBP2b, and GFP-FtsA in WT and ∆copD cells. (A) GFP-PBP1a, (B) GFP-PBP2b, and (C) GFP-FtsA. Overlays between phase-contrast and GFP images in WT and ∆copD cells are shown. Scale bar, 2 µm. Corresponding heatmaps representing the two-dimensional localization patterns during the cell cycle are shown on the right of overlays. The n values represent the number of cells analyzed in a single representative experiment. Experiments were performed in triplicate.
Fig 5
Fig 5
Model for CopD role in S. pneumoniae cell morphogenesis. CopD (light blue) modulates the dynamics of the class A PBP1a (pink) and the class B PBP2b (orange), which are both required for peripheral PG synthesis (faded salmon and blue strips). CopD could thus allow to coordinate the assembly of the primary peripheral PG with its remodeling by the RodA/PBP2b system (orange and blue) and PBP1a (pink) and hydrolases (green), respectively. This coordination is critical in controlling cell width (47). CopD could also contribute to organize the two layers PG architecture made of randomly oriented strands (blue and faded blue) facing the cytoplasm and ordered concentric rings strands (salmon and faded salmon) (49). According to the recent model of PG assembly and remodeling (21), CopD could also influence the balance of the insertion of peripheral (faded salmon and blue strips) into septal (salmon and blue strips) PG to generate a native peripheral PG mesh. Because aPBPs can function as autonomous entities, CopD could be important for PG repair and maintenance (22). Lastly, it remains to be determined if CopD cross-talks with other regulators of aPBPs like CozE and MacP (gray). The visual of this drawing was inspired by reference .

References

    1. Silhavy TJ, Kahne D, Walker S. 2010. The bacterial cell envelope. Cold Spring Harb Perspect Biol 2:a000414. doi:10.1101/cshperspect.a000414 - DOI - PMC - PubMed
    1. Egan AJF, Errington J, Vollmer W. 2020. Regulation of peptidoglycan synthesis and remodelling. Nat Rev Microbiol 18:446–460. doi:10.1038/s41579-020-0366-3 - DOI - PubMed
    1. Rohs PDA, Bernhardt TG. 2021. Growth and division of the peptidoglycan matrix. Annu Rev Microbiol 75:315–336. doi:10.1146/annurev-micro-020518-120056 - DOI - PubMed
    1. Kumar S, Mollo A, Kahne D, Ruiz N. 2022. The bacterial cell wall: from lipid II flipping to polymerization. Chem Rev 122:8884–8910. doi:10.1021/acs.chemrev.1c00773 - DOI - PMC - PubMed
    1. Sham L-T, Butler EK, Lebar MD, Kahne D, Bernhardt TG, Ruiz N. 2014. Bacterial cell wall. MurJ is the flippase of lipid-linked precursors for peptidoglycan biogenesis. Science 345:220–222. doi:10.1126/science.1254522 - DOI - PMC - PubMed

MeSH terms