

Computed tomography measured epicardial adipose tissue and psoas muscle attenuation: new biomarkers to predict major adverse cardiac events (MACE) and mortality in patients with heart disease and critically ill patients. Part I: Epicardial adipose tissue
- PMID: 37728441
- PMCID: PMC10496106
- DOI: 10.5114/ait.2023.130922
Computed tomography measured epicardial adipose tissue and psoas muscle attenuation: new biomarkers to predict major adverse cardiac events (MACE) and mortality in patients with heart disease and critically ill patients. Part I: Epicardial adipose tissue
Abstract
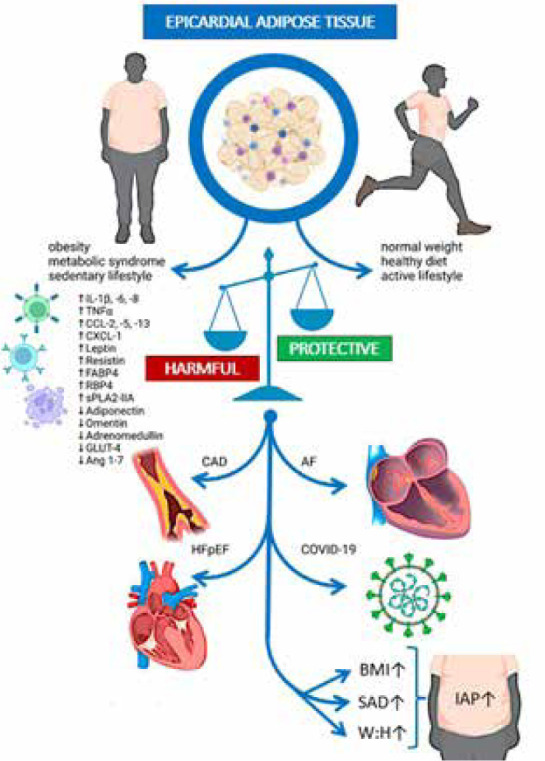
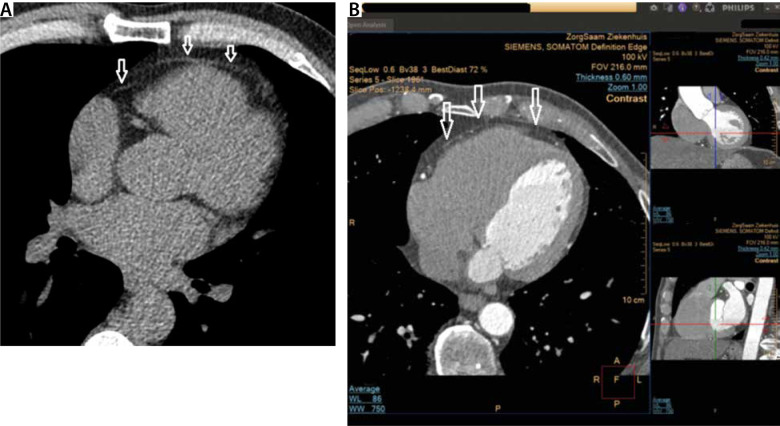
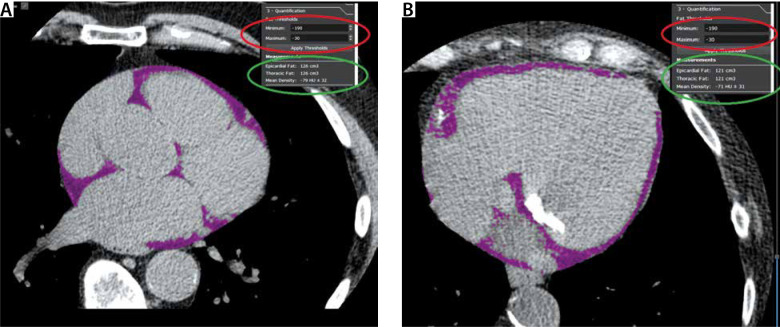
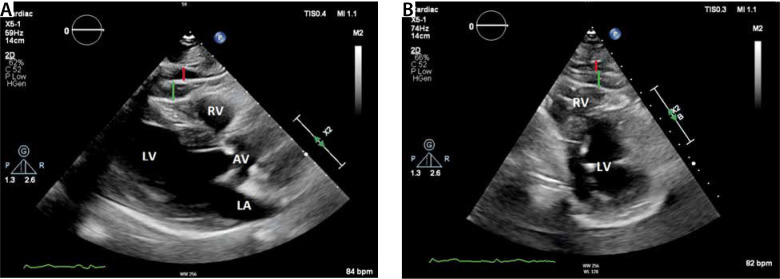
Over the last two decades, the potential role of epicardial adipocyte tissue (EAT) as a marker for major adverse cardiovascular events has been extensively studied. Unlike other visceral adipocyte tissues (VAT), EAT is not separated from the adjacent myocardium by a fascial layer and shares the same microcirculation with the myocardium. Adipocytokines, secreted by EAT, interact directly with the myocardium through paracrine and vasocrine pathways. The role of the Randle cycle, linking VAT accumulation to insulin resistance, and the relevance of blood flow and mitochondrial function of VAT, are briefly discussed. The three available imaging modalities for the assessment of EAT are discussed. The advantages of echocardiography, cardiac CT, and cardiac magnetic resonance (CMR) are compared. The last section summarises the current stage of knowledge on EAT as a clinical marker for major adverse cardiovascular events (MACE). The association between EAT volume and coronary artery disease (CAD) has robustly been validated. There is growing evidence that EAT volume is associated with computed tomography coronary angiography (CTCA) assessed high-risk plaque features. The EAT CT attenuation coefficient predicts coronary events. Many studies have established EAT volume as a predictor of atrial fibrillation after cardiac surgery. Moreover, EAT thickness has been independently associated with severe aortic stenosis and mitral annular calcification. Studies have demonstrated that EAT volume is associated with heart failure. Finally, we discuss the potential role of EAT in critically ill patients admitted to the intensive care unit. In conclusion, EAT seems to be a promising new biomarker to predict MACE.
Keywords: biomarker; clinical outcomes; computed tomography; coronary artery disease; critically ill patients; epicardial adipose tissue; heart failure; major adverse cardiovascular events; atrial fibrillation.
Figures
Similar articles
-
Quality of epicardial adipose tissue predicts major adverse cerebral and cardiovascular events following transcatheter aortic valve implantation.Heart Vessels. 2024 Jul;39(7):646-653. doi: 10.1007/s00380-024-02374-w. Epub 2024 Mar 19. Heart Vessels. 2024. PMID: 38502318
-
Deep Learning-Based Quantification of Epicardial Adipose Tissue Volume and Attenuation Predicts Major Adverse Cardiovascular Events in Asymptomatic Subjects.Circ Cardiovasc Imaging. 2020 Feb;13(2):e009829. doi: 10.1161/CIRCIMAGING.119.009829. Epub 2020 Feb 17. Circ Cardiovasc Imaging. 2020. PMID: 32063057 Free PMC article. Clinical Trial.
-
Computed tomography measured epicardial adipose tissue and psoas muscle attenuation: new biomarkers to predict major adverse cardiac events and mortality in patients with heart disease and critically ill patients. Part II: Psoas muscle area and density.Anaesthesiol Intensive Ther. 2023;55(4):243-261. doi: 10.5114/ait.2023.132460. Anaesthesiol Intensive Ther. 2023. PMID: 38084569 Free PMC article. Review.
-
Metabolic syndrome, fatty liver, and artificial intelligence-based epicardial adipose tissue measures predict long-term risk of cardiac events: a prospective study.Cardiovasc Diabetol. 2021 Jan 29;20(1):27. doi: 10.1186/s12933-021-01220-x. Cardiovasc Diabetol. 2021. PMID: 33514365 Free PMC article.
-
Epicardial adipose tissue volume assessed by computed tomography and coronary artery disease: a systematic review and meta-analysis.Eur Heart J Cardiovasc Imaging. 2018 May 1;19(5):490-497. doi: 10.1093/ehjci/jex314. Eur Heart J Cardiovasc Imaging. 2018. PMID: 29236951
Cited by
-
Influence of Cardiovascular Risk Factors and Metabolic Syndrome on Epicardial Adipose Tissue Thickness in Rural Spanish Children and Adolescents.Nutrients. 2024 Sep 30;16(19):3321. doi: 10.3390/nu16193321. Nutrients. 2024. PMID: 39408289 Free PMC article.
-
Quality of epicardial adipose tissue predicts major adverse cerebral and cardiovascular events following transcatheter aortic valve implantation.Heart Vessels. 2024 Jul;39(7):646-653. doi: 10.1007/s00380-024-02374-w. Epub 2024 Mar 19. Heart Vessels. 2024. PMID: 38502318
-
Computed Tomography Angiography Identified High-Risk Coronary Plaques: From Diagnosis to Prognosis and Future Management.Diagnostics (Basel). 2024 Aug 1;14(15):1671. doi: 10.3390/diagnostics14151671. Diagnostics (Basel). 2024. PMID: 39125547 Free PMC article. Review.
References
MeSH terms
LinkOut - more resources
Full Text Sources
Medical
Miscellaneous