. 2023 Oct 31;43(10):BSR20230128.
doi: 10.1042/BSR20230128.

Melatonin targets ferroptosis through bimodal alteration of redox environment and cellular pathways in NAFLD model

Affiliations

Melatonin targets ferroptosis through bimodal alteration of redox environment and cellular pathways in NAFLD model

Moumita Saha et al. Biosci Rep. .

Abstract

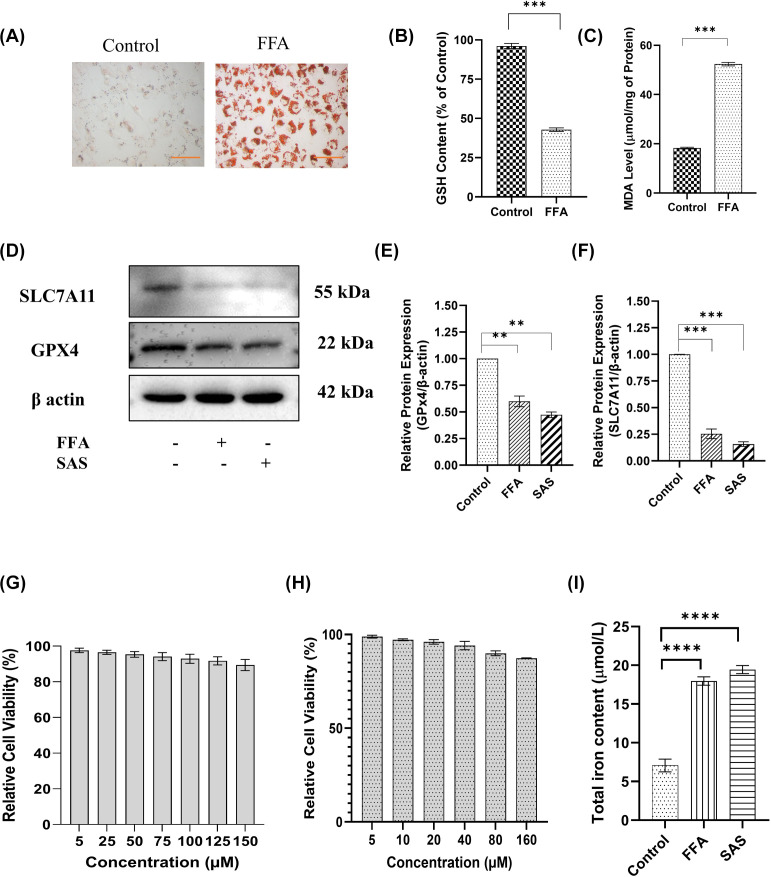
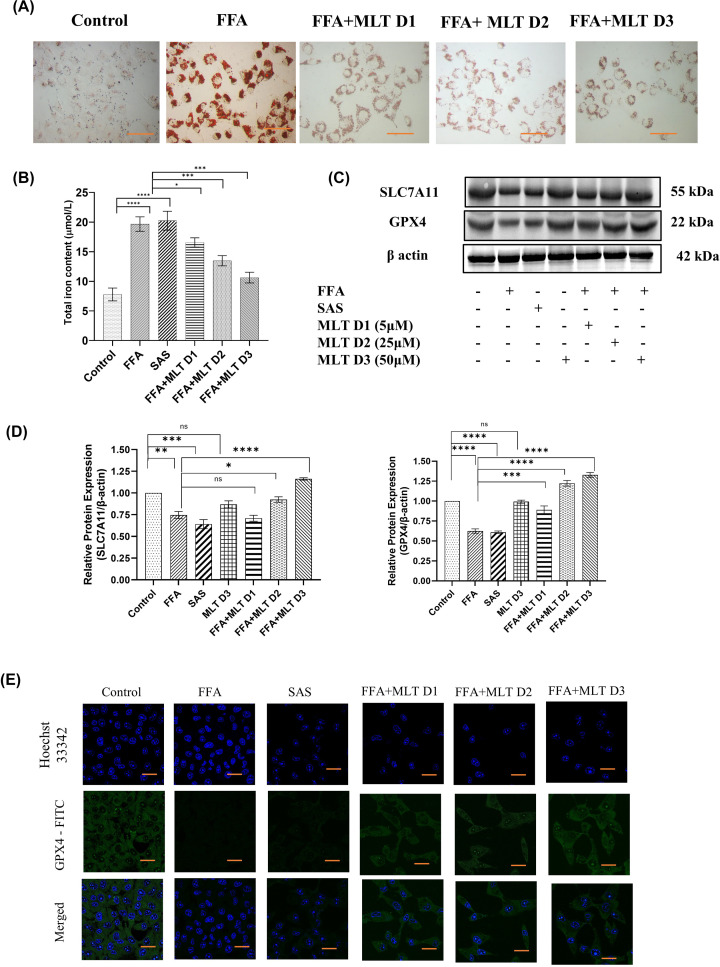
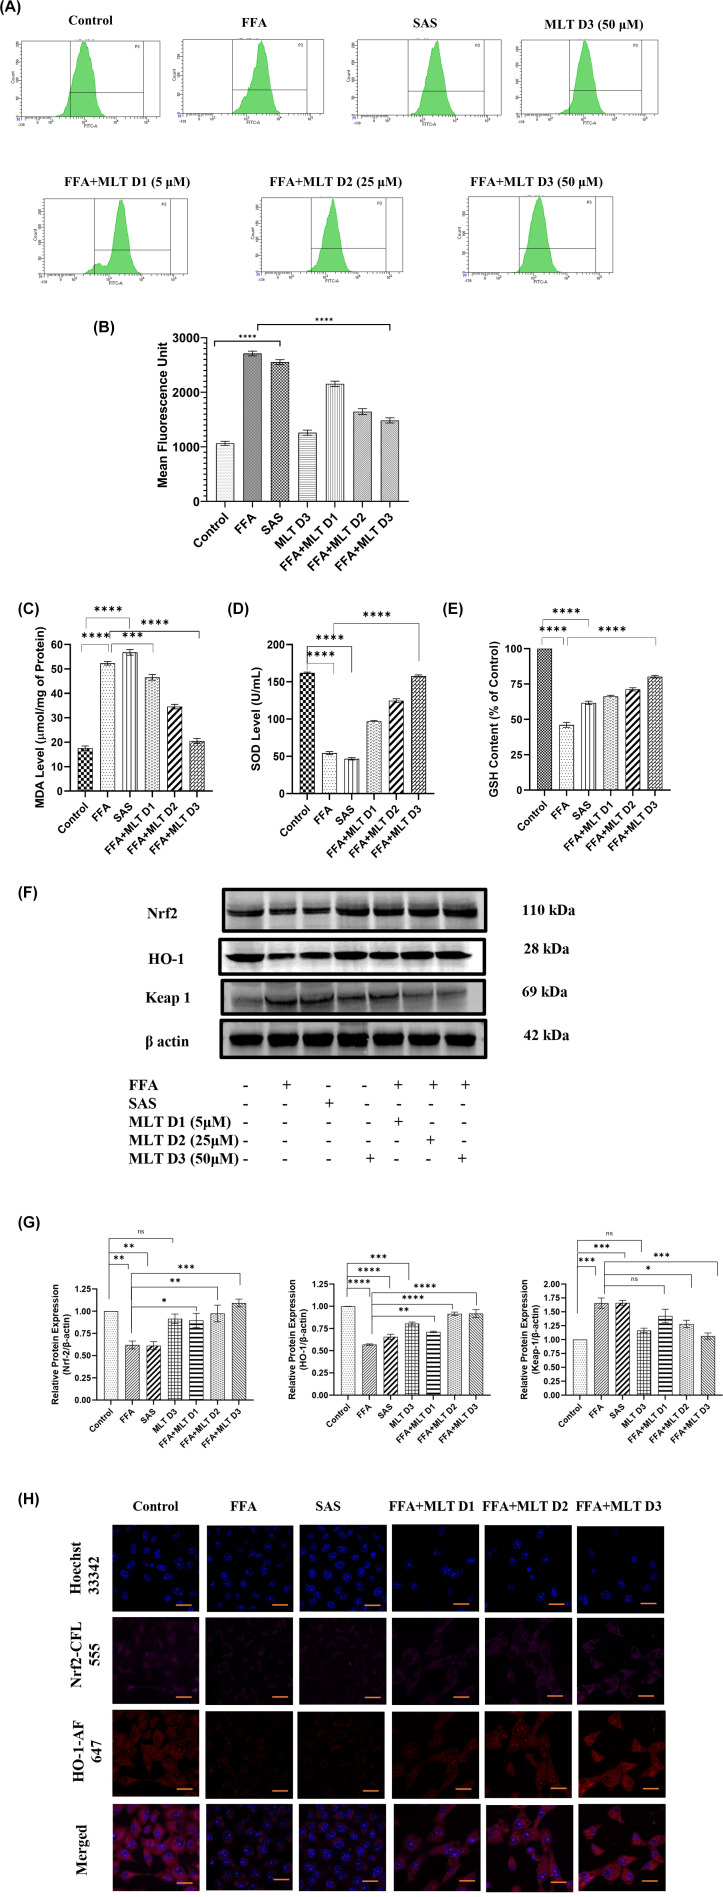
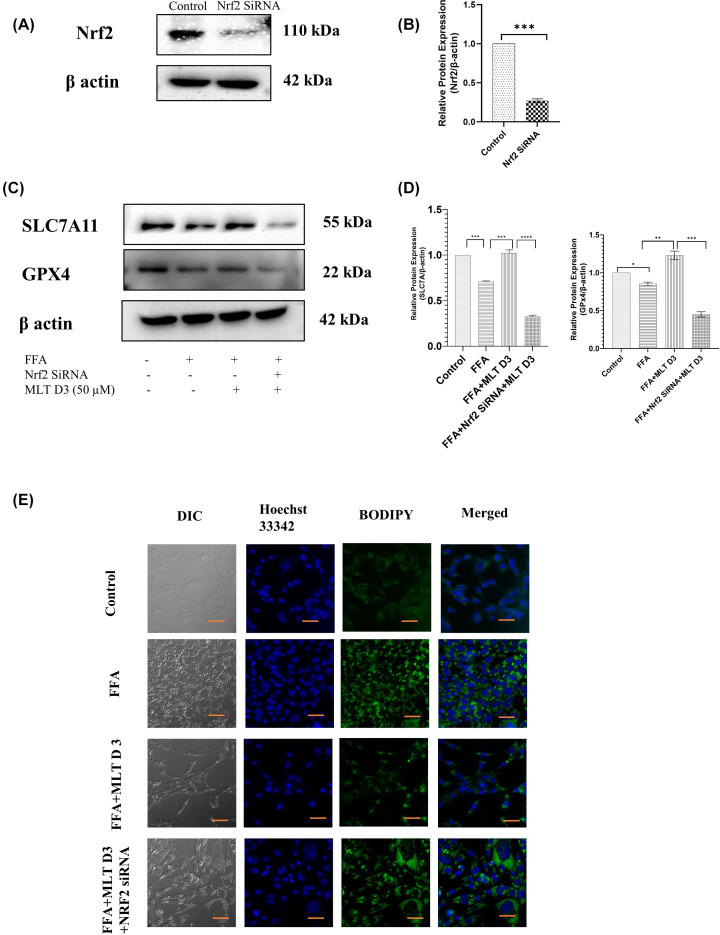
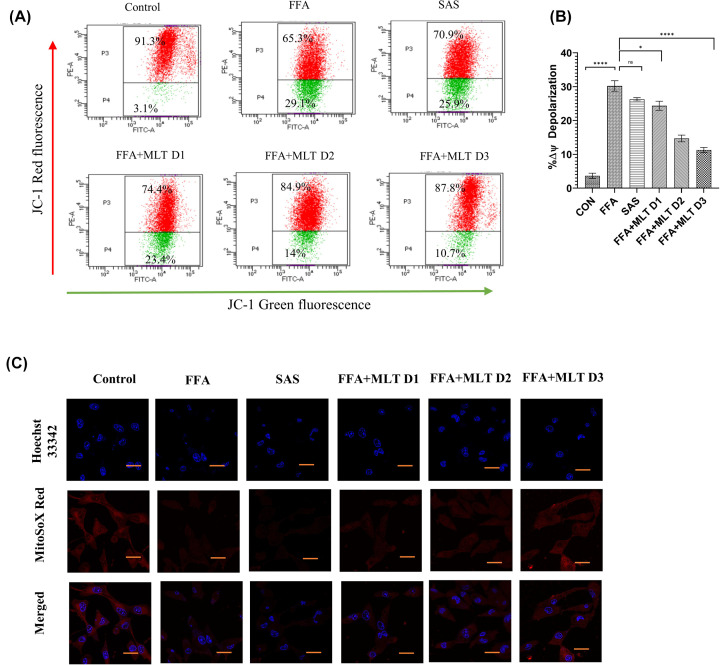
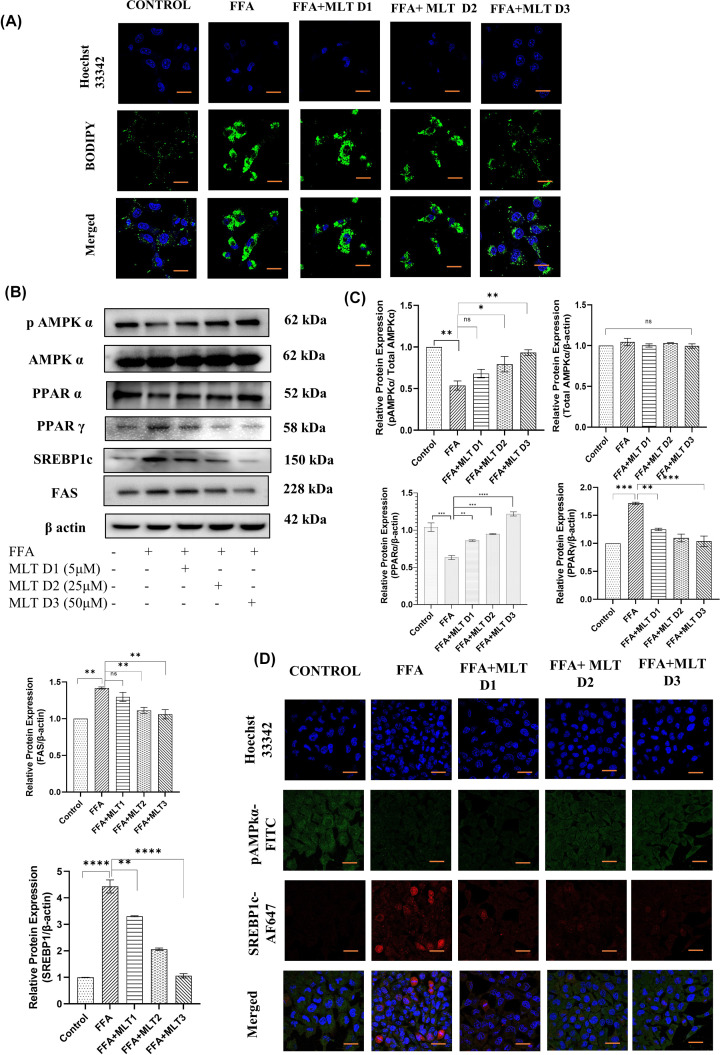
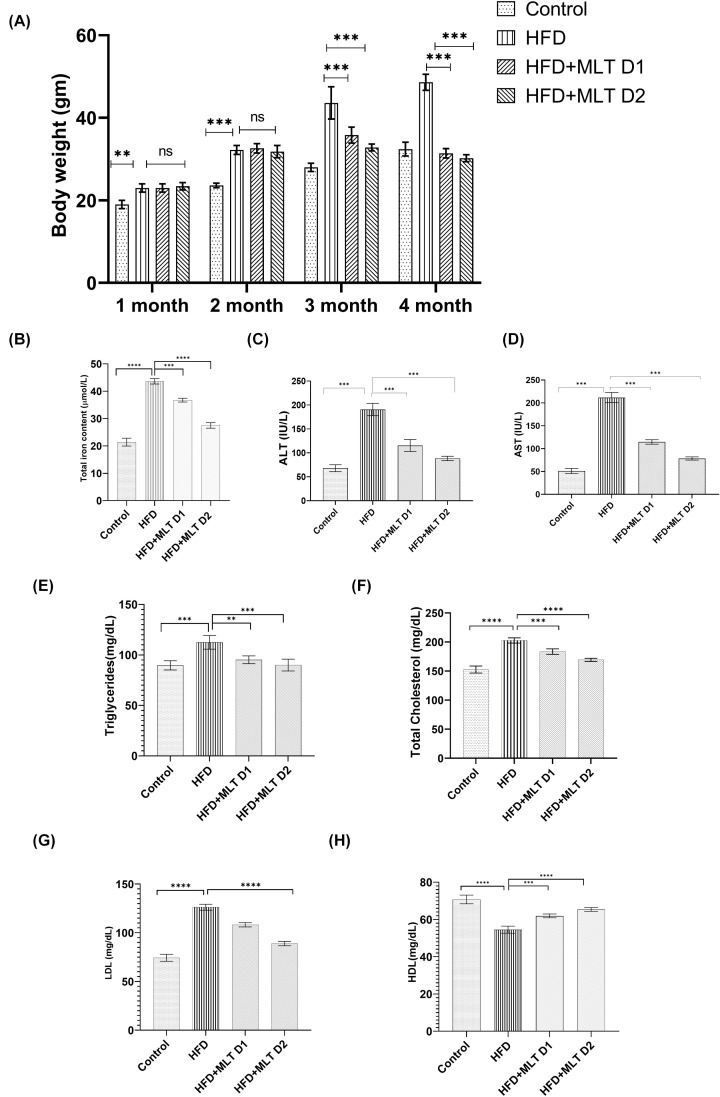
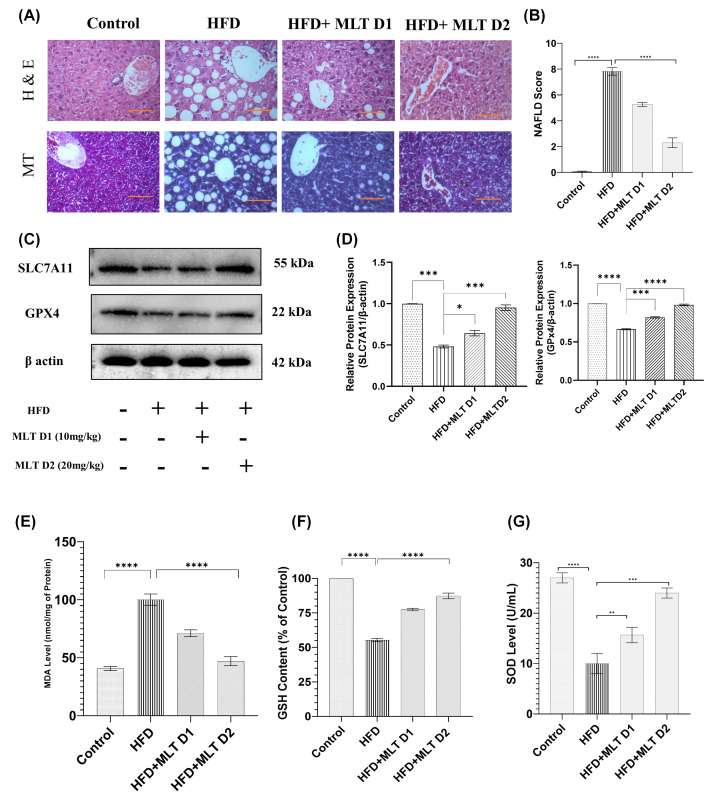
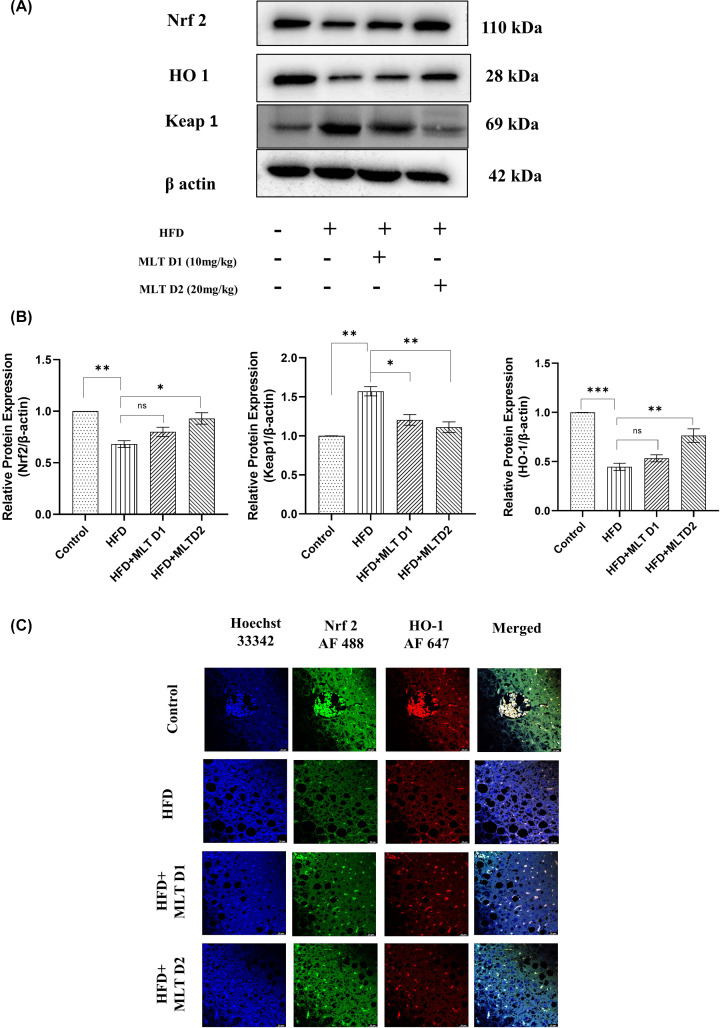
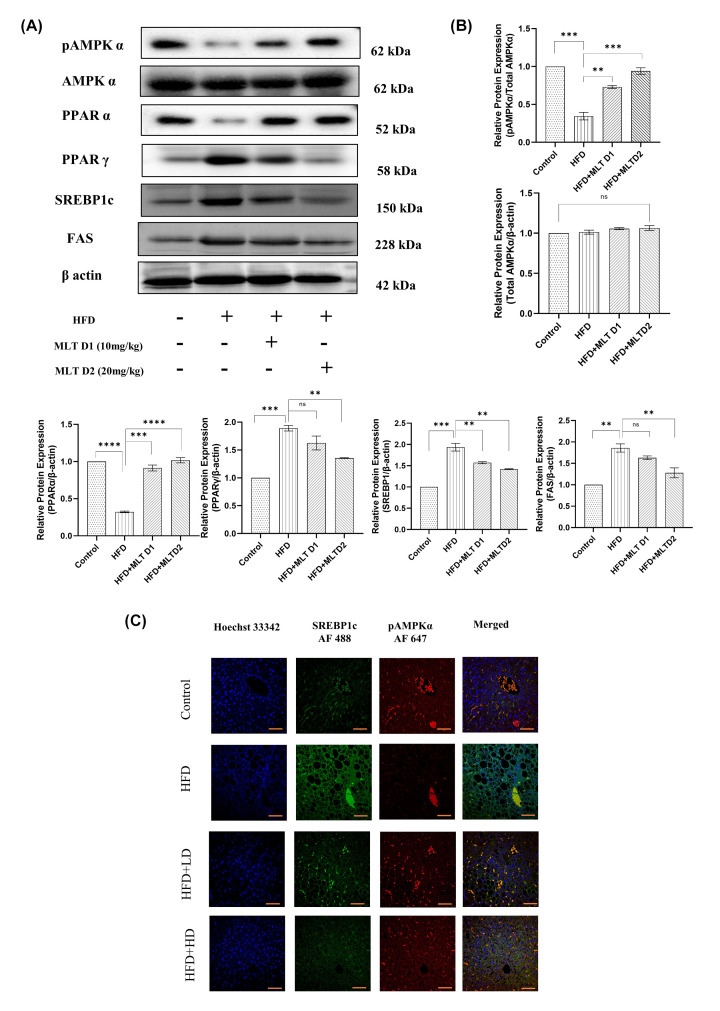
Ferroptosis is a non-conventional cellular death caused by lipid peroxide induced iron deposition. Intracellular lipid accumulation followed by generation of lipid peroxides is an hallmark of non-alcoholic fatty liver disease (NAFLD). Melatonin (MLT) is an important pineal hormone with tremendous antioxidant and anti-inflammatory properties. Various studies targeted ferroptosis in different diseases using melatonin. However, none of them focused the intrinsic mechanism of MLT's action to counteract ferroptosis in NAFLD. Hence, the present study investigated the role of MLT in improvement of NAFLD-induced ferroptosis. HepG2 cells were treated with free fatty acids (FFAs) to induce in vitro NAFLD state and C57BL/6 mice were fed with high-fat diet (HFD) followed by MLT administration. The results indicated that MLT administration caused the recovery from both FFA- and HFD-induced ferroptotic state via increasing GSH and SOD level, decreasing lipid reactive oxygen species (ROS) and malondialdehyde (MDA) level, increasing Nrf2 and HO-1 level to defend cells against an oxidative environment. MLT also altered the expression of two key proteins GPX4 and SLC7A11 back to their normal levels, which would otherwise cause ferroptosis. MLT also protected against histopathological damage of both liver tissue and HepG2 cells as depicted by Oil Red O, HE staining and immunofluorescence microscopy. MLT also had control over pAMPKα as well as PPARγ and PPARα responsible for lipid homeostasis and lipogenesis. In brief, MLT exerted its multifaceted effect in FFA- and HFD-induced NAFLD by retrieving cellular oxidative environment, reducing lipogenesis and lipid peroxidation and modulating Nrf2/HO-1 and GPX4/SLC7A11 axis to combat ferroptosis.

Keywords: Ferroptosis; Lipid peroxidation; Melatonin; NAFLD.


Conflict of interest statement

The authors declare that there are no competing interests associated with the manuscript.

Figures

Figure 1
Figure 1. NAFLD-linked ferroptosis was induced by FFA in HepG2 cells
(A) Oil Red O staining of lipid droplets in both control and FFA-treated cells. (B) Bar graph of GSH and (C) MDA content signifying changes in oxidative environment of cells. (D) Representative Western blot, and (E,F) bar graphs show the quantification of SLC7A11/β-Actin and GPX4/β-Actin, respectively. Panels (G,H) represent viability of HepG2 cells at different concentrations of MLT and SAS. Panel (I) represents total iron content in FFA/MLT-treated HepG2 cells. Data are represented as the mean percentage ± SEM (n=3); ****P<0.0001, ***P<0.001, **P<0.01, *P<0.05; ns, non-significant.
Figure 2
Figure 2. Melatonin improves overall effect of NAFLD-mediated ferroptosis
Basic parameters indicating the effect of melatonin on NAFLD. (A) Oil Red O staning of lipid droplets in FAA- and MLT-treated groups. (B) Bar graph shows quantification of intracellular iron content. SAS used here as positive control. (C) Western blot of SLC7A11 and GPX4 in different groups of treated cells. (D) Bar graph shows the quantification of SLC7A11/β-Actin and GPX4/β-Actin. (E) The analysis of Expression of GPX4 using confocal microscopy. Data are represented as the mean percentage ± SEM (n=3); ****P<0.0001, ***P<0.001, **P<0.01, *P<0.05; ns, non-significant.
Figure 3
Figure 3. Melatonin recovers HepG2 cells from FFA-induced ferroptosis via modifying Nrf2/HO-1 mediated signaling
Qualitative and quantitative analysis of intracellular oxidative status and involvement of Nrf2/HO-1 pathway in NAFLD-related ferroptosis. (A) Flow cytometric analysis of ROS generation in different treatment groups using DCFDA, and (B) bar graph represents mean fluorescence unit of ROS levels in different groups. Panels (C–E) represent MDA, SOD and GSH content in different treated groups. (F) Western blot analysis of Nrf2, HO-1 and Keap-1. (G) Bar graphs show the quantification of Nrf2/β-Actin, HO-1/β-Actin and Keap-1/β-Actin, respectively. (H) Representative immunofluorescence images shown Nrf2 and HO-1 expression in HepG2 cells depending on different treatments; scale bar: 50 µm. Data are represented as the mean percentage ± SEM (n=3); ****P<0.0001, ***P<0.001, **P<0.01, *P<0.05; ns, non-significant.
Figure 4
Figure 4. Melatonin recovers HepG2 cells from FFA-induced ferroptosis via modifying Nrf2/HO-1-mediated signaling
SLC7A11 and GPX4 expression was verified using Nrf2 Si-RNA transfection. (A) Western blot analysis of Nrf2 in control and SiRNA-treated groups. (B) Bar graphs show the quantification of Nrf2/β-Actin. (C) Western blot analysis of SLC7A11 and GPX4. (D) Bar graphs show the quantification of SLC7A11/β-Actin and GPX4/β-Actin, respectively. (E) Immunofluorescence images of HepG2 cells of different treated groups using BODIPY; scale bar: 50 µm. Data are represented as the mean percentage ± SEM (n=3); ****P<0.0001, ***P<0.001, **P<0.01, *P<0.05; ns, non-significant.
Figure 5
Figure 5. Melatonin controlled mitochondrial environmental changes during ferroptosis: changes in mitochondrial membrane potential and mitoROS
(A) Flow cytometric analysis of mitochondrial membrane potential using JC1 in different treatment groups. (B) Bar graph represents percentage changes of depolarization of mitochondrial membrane potential. (C) Immunofluorescence images of mitochondrial superoxide content using MitoSoX. Data are represented as the mean percentage ± SEM (n=3); ****P<0.0001, ***P<0.001, **P<0.01, *P<0.05; ns, non-significant.
Figure 6
Figure 6. Melatonin inhibited metabolic markers associated with lipogenesis in vitro
Analysis of lipid ROS and potential lipogenic markers. (A) BODIPY staining of HepG2 cells treated with FFA and different doses of MLT. (B) Western blot analyses of pAMPKα, total AMPKα, PPARα, PPARγ, SREBP1c and FAS are shown. (C) Bar graphs show the quantification of total AMPKα/β-Actin, pAMPKα/Total AMPKα, PPARα/β-Actin, PPARγ/β-Actin, FAS/β-Actin and SREBP1c/β-Actin, respectively. (D) Immunofluorescence images of expression of pAMPKα and SREBP1c; scale bar: 50 µm. Data are represented as the mean percentage ± SEM (n=3); ****P<0.0001, ***P<0.001, **P<0.01, *P<0.05; ns, non-significant.
Figure 7
Figure 7. Melatonin improved physiological parameters in C57BL/6 mice
Changes in physiological parameters in HFD-fed C57BL/6 mice with/without MLT treatment. (A) Body weight changes of mice in different time intervals. (B) Intracellular iron content of Liver tissue lysates. (C,D) ALT and AST level. (E–H) Serum level of triglycerides, total cholesterol, LDL and HDL. Data are represented as the mean percentage ± SEM (n=3); ****P<0.0001, ***P<0.001, **P<0.01, *P<0.05; ns, non-significant.
Figure 8
Figure 8. Melatonin augmented recovery from NAFLD in C57BL/6 mice
Modulation of NAFLD-mediated histopathological and biochemical changes. (A) H&E and MT staining of HFD and MLT treated mice groups; scale bar = 40 µm. (B) Bar graph shows the NAFLD score. (C) Western blot analysis of SLC7A11 and GPX4. (D) Bar graphs show the quantification of SLC7A11/β-Actin and GPX4/β-Actin respectively. (E–G) Bar graph represents MDA level, GSH content and SOD level analyzed using Tissue lysates. Data are represented as the mean percentage ± SEM (n=3); ****P<0.0001, ***P<0.001, **P<0.01, *P<0.05; ns, non-significant.
Figure 9
Figure 9. Melatonin augmented recovery from NAFLD in C57BL/6 mice
Alteration of key protein markers of antioxidant gene expression. (A) Western blot analysis of Nrf2, HO-1 and Keap-1 in HFD- and MLT-treated mice groups. (B) Bar graphs show the quantification of Nrf2/β-Actin, HO-1/β-Actin and Keap-1/β-Actin, respectively. (C) Immunofluorescence images of expression of Nrf2 and HO-1; scale bar = 20 µm. Data are represented as the mean percentage ± SEM (n=3); ****P<0.0001, ***P<0.001, **P<0.01, *P<0.05; ns, non-significant.
Figure 10
Figure 10. In vivo lipogenic markers altered following melatonin administration
Melatonin re-established lipogenic protein levels. (A) Western blot analysis of pAMPKα, Total AMPKα, PPARα, PPARγ, SREBP1c and FAS. (B) Bar graphs show the quantification of total AMPKα /β-Actin, pAMPKα/total AMPKα, PPARα/β-Actin, PPARγ/β-Actin, FAS/β-Actin, and SREBP1c/β-Actin, respectively. (C) Immunofluorescence images of expression of pAMPKα and SREBP1c; scale bar: 40 µm. Data are represented as the mean percentage ± SEM (n=3); ****P<0.0001, ***P<0.001, **P<0.01, *P<0.05; ns, non-significant.

Similar articles

Cited by

References

    1. Gómez-Lechón M.J., Donato M.T., Martínez-Romero A., Jiménez N., Castell J.V. and O'Connor J.E. (2007) A human hepatocellular in vitro model to investigate steatosis. Chem. Biol. Interact. 165, 106–116 10.1016/j.cbi.2006.11.004 - DOI - PubMed
    1. Paschos P.P.K. (2009) Non alcoholic fatty liver disease and metabolic syndrome. Hippokratia 13, 9–19 - PMC - PubMed
    1. Benedict M. and Zhang X. (2017) Non-alcoholic fatty liver disease: an expanded review. World J. Hepatol. 9, 715–732 10.4254/wjh.v9.i16.715 - DOI - PMC - PubMed
    1. Pydyn N., Miękus K., Jura J. and Kotlinowski J. (2020) New therapeutic strategies in nonalcoholic fatty liver disease: a focus on promising drugs for nonalcoholic steatohepatitis. Pharmacologic. Rep. 72, 1–12 10.1007/s43440-019-00020-1 - DOI - PubMed
    1. Matteoni C., Younossi Z., Gramlich T., Boparai N., Liu Y. and Mccullough A. (1999) Nonalcoholic fatty liver disease: a spectrum of clinical and pathological severity☆, ☆☆. Gastroenterology 116, 1413–1419 10.1016/S0016-5085(99)70506-8 - DOI - PubMed

Publication types