. 2023 Sep 20:12:e86709.
doi: 10.7554/eLife.86709.

Single molecule analysis of CENP-A chromatin by high-speed atomic force microscopy

Affiliations

Single molecule analysis of CENP-A chromatin by high-speed atomic force microscopy

Daniël P Melters et al. Elife. .

Abstract

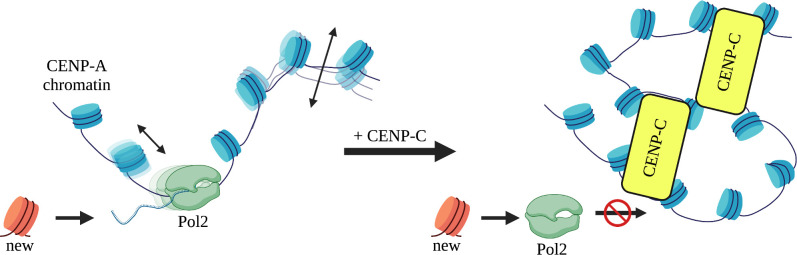
Chromatin accessibility is modulated in a variety of ways to create open and closed chromatin states, both of which are critical for eukaryotic gene regulation. At the single molecule level, how accessibility is regulated of the chromatin fiber composed of canonical or variant nucleosomes is a fundamental question in the field. Here, we developed a single-molecule tracking method where we could analyze thousands of canonical H3 and centromeric variant nucleosomes imaged by high-speed atomic force microscopy. This approach allowed us to investigate how changes in nucleosome dynamics in vitro inform us about transcriptional potential in vivo. By high-speed atomic force microscopy, we tracked chromatin dynamics in real time and determined the mean square displacement and diffusion constant for the variant centromeric CENP-A nucleosome. Furthermore, we found that an essential kinetochore protein CENP-C reduces the diffusion constant and mobility of centromeric nucleosomes along the chromatin fiber. We subsequently interrogated how CENP-C modulates CENP-A chromatin dynamics in vivo. Overexpressing CENP-C resulted in reduced centromeric transcription and impaired loading of new CENP-A molecules. From these data, we speculate that factors altering nucleosome mobility in vitro, also correspondingly alter transcription in vivo. Subsequently, we propose a model in which variant nucleosomes encode their own diffusion kinetics and mobility, and where binding partners can suppress or enhance nucleosome mobility.

Keywords: chromatin; chromosomes; epigenetics; gene expression; high-speed AFM; human; none; nucleosomes; single-molecule.


Conflict of interest statement

DM, KN, RB, TR No competing interests declared, YD Reviewing editor, eLife

Figures

Figure 1.
Figure 1.. Schematic of experimental configurations for HS-AFM nucleosome measurements and analysis of extracted single particle trajectories Sample preparation: CENP-A nucleosomes were in vitro reconstituted and imaged by HS-AFM in fluid.
By HS-AFM, we can track nucleosome motion, corresponding to both nucleosomes sliding along the DNA and chromatin fiber moving. Data acquisition: HS-AFM videos were obtained at a framerate of 0.5 Hz (2 s per frame) for a minimum of 20 s and up to 120 s. Using MATLAB, we extracted nucleosome trajectories, which were subsequently corrected for drift. Analysis: trajectories were analyzed to extract several mobility and diffusion-related parameters to determine both potential tip-scanning artifacts and to characterize nucleosome dynamics.
Figure 1—figure supplement 1.
Figure 1—figure supplement 1.. Confirmation of in vitro reconstitution of CENP-A chromatin.
(A) Purified histone protein was quantified from SDS-PAGE blots for calculating the correct in vitro reconstitution ratios. (B) Representative in air AFM image of in vitro reconstituted CENP-A chromatin. (C) Agarose gel of MNase digested in vitro reconstituted CENP-A chromatin showing mono-, di-, and trinucleosome arrays confirming chromatin formation. (D) Quantification of AFM measurements of in vitro reconstituted CENP-A nucleosomes.
Figure 1—figure supplement 2.
Figure 1—figure supplement 2.. Drift correction of HS-AFM videos.
(A) First, raw trajectories were visualized. Some particles that do not appear to move were used to determine drift correction. The direction of these immobile particles must be identical. Next, the drift for the x and y steps were calculated and the raw trajectories were drift corrected. Finally, following drift correction, the trajectories were again visualized to confirm that drift correction removed the observed drift. (B) Four examples of HS-AFM videos with observed drift before and after drift correction.
Figure 2.
Figure 2.. No AFM tip-motion effect was observed.
If the AFM tip were to displace the sample during scanning, it should result in a motion bias in the direction of scanning that can be detected. (A) Schematic representation of how angle between successive steps within a trajectory is determined and representative angle distribution graphs for no bias or bias. (B) All angles for successive steps of all trajectories of five control conditions (low salt, high salt, no APS, 2 x APS, and Tween-20) show no sign of bias (Figure 2—figure supplement 1A). (C) Every step has an x and y coordinate. By obtaining the diffusion constant for each axis separately, motion bias between the x and y axis can be discerned, which is an indication of bias introduced by the AFM tip. (D) The diffusion constants for the x and y axis for CENP-A nucleosomes in low or high salt conditions show differences between imaging conditions, but not within each condition (Figure 2—figure supplement 1B). The error bars represent the standard error.
Figure 2—figure supplement 1.
Figure 2—figure supplement 1.. No AFM tip-motion effect observed across control conditions.
(A) The distribution of angles between successive nucleosome positions for each control condition. (B) Diffusion constants estimated from the x- and y-axis displacement distributions for each individual control condition. The data is obtained from two independent technical replicates per condition. The error bars represent standard error of the mean. The data represent at least two independent technical replicates.
Figure 2—figure supplement 2.
Figure 2—figure supplement 2.. The scatter plot of average step size over each frame of the videos shows no bias by the AFM tip, as the R2 linear regression is 0.15.
The data is obtained from at least two independent technical replicates per condition.
Figure 3.
Figure 3.. Salt and APS concentration predictably impacts CENP-A nucleosome mobility in vitro.
(A) The average mean square displacement is shown with standard error as a function of the time interval for CENP-A nucleosome arrays in the following buffers: low salt (green; 5 mM NaCl), high salt (blue, 150 mM NaCl), no APS (yellow), twofold APS (red), 0.01% Tween-20 (pink), and PCAT2 DNA (brown). (B) The diffusion constants obtained from the MSD curves. The error bars represent the standard error. (C) Schematic representation of mobile or immobile (or paused) single particle trajectories. (D) The single step x-axis displacement of CENP-A nucleosomes in low salt conditions. The blue line represents a single Gaussian fit whereas the red line represents a double Gaussian fit. The latter provided a better fit to all the data for both the x- and y-step distributions for all conditions (see Figure 3—figure supplement 5). (E) The fraction of single steps corresponding to D1 (narrower) Gaussian distribution or D2 (wider) Gaussian distributions from the double Gaussian fitting. The D1 Gaussian distribution corresponds to a smaller diffusion constant and may represent immobile or paused nucleosomes, whereas D2 corresponds to a larger diffusion constant representing mobile nucleosomes. The data were obtained from two independent technical replicates per condition.
Figure 3—figure supplement 1.
Figure 3—figure supplement 1.. Impact of salt and APS concentration on step size statistics.
(A) The average mean square displacement (MSD) is shown with standard error as a function of the time interval for all control conditions (low salt = green; high salt = blue; no APS = yellow; 2 x APS = red; 0.01% Tween = pink). (B) The diffusion constants obtained from the MSD curves, with an individual data point for each trajectory. (C) The average single frame step-size for each individual tracked nucleosome (grey points). (D) The maximum R-step for each individually tracked nucleosome per control condition. (E) The R-step range for each individually tracked nucleosome per control condition. Red dots represent the overall mean. The line and bar graphs represent two independent technical replicates per condition. The error bars represent standard error of the mean.
Figure 3—figure supplement 2.
Figure 3—figure supplement 2.. Single (blue line) and double (red line) (sum of two) Gaussian fitting of the x and y step displacement distributions for each of the control conditions.
The double Gaussian distribution best fitted the x and y step displacement for all samples. The diffusion constants derived from the D0, D1, and D2 Gaussian fit are shown, The D2 (larger standard deviation, higher diffusion constant) Gaussian is more prevalent for all conditions except 2 x APS. The data was obtained from two independent technical replicates per condition.
Figure 3—figure supplement 3.
Figure 3—figure supplement 3.. The relative fraction of the D1 and D2 Gaussian fit are shown, where the D2 (larger standard deviation, higher diffusion constant) Gaussian is most prevalent for all conditions except 2 x APS, Tween-20, and high salt.
The data represent at least two independent technical replicates.
Figure 3—figure supplement 4.
Figure 3—figure supplement 4.. Individual tracts show switching between D1 and D2 diffusion states.
(A) A collage of individual tracts that display transitions from D1 to D2 diffusion states and vica versa. (B) Individual R-steps for each individual tract are displayed, showing how common for individual tracts to have both large R-step sizes (D2) and short R-step sizes (D1). The data represent at least two independent technical replicates.
Figure 3—figure supplement 5.
Figure 3—figure supplement 5.. Lower D1 diffusion state and rejected “stuck” particles have different diffusion constants.
(A) The relative diffusion constants for the x- and y-axis of “stuck” particles are compared to that of the D1 diffusion constants for 9 of the 13 tested conditions. (B) To assess whether they significantly differed or not, we performed the F-test and found that only the 2 x APS and Low Salt conditions did not significantly differ. For all other conditions, we found significant differences (dashed red line marks p=0.05), lending no support for the hypothesis that the lower D1 diffusion constant represents ‘stuck’ nucleosomes. The data represent at least two independent technical replicates.
Figure 3—figure supplement 6.
Figure 3—figure supplement 6.. Diffusion constant of H3 mononucleosomes higher than H3 nucleosomes within an array.
(A) The average (MSD) is shown with standard error as a function of the time interval for H3 chromatin (grey) alone or with linker histone H1.5 (black) (videos from Melters and Dalal, 2021 JMB) and H3 mononucleosomes (orange). (B) Diffusion constants obtained from the MSD curves, with individual data points for each trajectory. The error bars represent standard error of the mean. (C) The average single frame R-step size for each individual tracked nucleosome. The maximum R-step for each individually tracked nucleosome. The R-step range for each individually tracked nucleosome. Red dots represent the overall mean. The line and bar graphs represent at least two independent technical replicates.
Figure 3—figure supplement 7.
Figure 3—figure supplement 7.. Single step distribution fit by single Gaussian for H3 mononucleosomes.
(A) The distribution of the angle between successive steps for H3 chromatin. (B) The single (blue line) and double (red line) Gaussian fitting of the x and y step displacements for H3 chromatin are shown. The double Gaussian distribution provided the best fit to the x step displacement but not the y step displacement distributions. The sharp peak represents stuck or immobile particles. (C) The distribution of the angle between successive steps for H3 chromatin. (D) The single and double Gaussian fitting of the x and y step displacement for H3 chromatin with H1.5 (added at 0.2 ratio H1 to H3 nucleosome) are shown. The double Gaussian distribution best fitted the x and y step displacement distributions. (E) The distribution of the angle between successive steps for H3 chromatin. (F) The single and double Gaussian fitting of the x and y step displacement for H3 mononucleosomes are shown. The single Gaussian outperformed the double Gaussian fitting. The sharp peak off center is indicative of an artifact. (G) Fraction of D1 and D2 Gaussian fitting for all three samples. The left graph shows the fractions for the x step displacement analysis and the right graph for the y step displacement analysis. The data represent at least two independent technical replicates.
Figure 3—figure supplement 8.
Figure 3—figure supplement 8.. Schematic summary of the controls for HS-AFM quantitative single particle analysis.
Videos were corrected for drift. No tip-induced artifacts were observed. Low salt and 2 x APS resulted in less mobile chromatin, whereas high salt, no APS, and Tween-20 conditions resulted in more mobile chromatin. H3 mononucleosomes were mobile without the constraints of being part of a polymer, where the single step displacement distribution fits well with a single Gaussian fitting. This implies that mononucleosomes move as particles independent of 1-D nucleosome sliding.
Figure 4.
Figure 4.. CENP-CCD restrict CENP-A nucleosome mobility in vitro (A) Schematic representation of human CENP-C (943 amino acids: CENP-C, NCBI Gene ID: 1060).
The central domain of CENP-C (CENP-CCD), which directly binds to CENP-A nucleosomes, was added at a ratio of 1, 2, or 4 fragments per CENP-A nucleosome (1 x, 2 x, or 4 x CENP-CCD, respectively). (B) CENP-A nucleosome arrays were tracked in fluid for up to 120 s by HS-AFM at 1 frame every 2 s. A representative still frame is shown as well as the trajectories over time. (C) CENP-A nucleosome arrays were tracked in the presence of 1 x, 2 x, or 4 x CENP-CCD. A representative still frame is shown as well as the trajectories over time. (D) The average mean square displacement is shown with standard error as a function of the time interval. CENP-A nucleosomes alone are in red. CENP-A nucleosomes with 1 x CENP-CCD is in yellow, 2 x CENP-CCD is in blue, and 4 x CENP-CCD is in black. (E) The diffusion constants obtained from the MSD curves. The line and bar graphs represent three independent technical replicates. The error bars represent the standard error.
Figure 4—figure supplement 1.
Figure 4—figure supplement 1.. The distribution of the angle between successive nucleosome positions for CENP-A chromatin alone or in the presence of 1 x, 2 x, or 4 x CENP-CCD.
Only for the 1 x CENP-CCD condition, we observed minor bias in angles. For all other tested conditions, we found random angle distributions. The data represent at least three independent technical replicates for each condition.
Figure 4—figure supplement 2.
Figure 4—figure supplement 2.. CENP-CCD restricts step size of CENP-A nucleosomes.
(A) The average mean square displacement (MSD) is shown with standard error as a function of the time interval for all CENP-A chromatin (red) and CENP-A chromatin with CENP-CCD (blue, 2.2 molar excess to CENP-A nucleosomes). (B) The diffusion constants obtained from the MSD curves, with individual data points for each trajectory shown as grey points. Error bars represent standard error of the mean. (C) The average single frame R-step-size for each individual tracked nucleosome (grey points). (D) The maximum R-step for each individually tracked nucleosome. (E) The R-step range for each individually tracked nucleosome. Red dots represent the overall mean. The line and bar graphs represent at least three independent technical replicates.
Figure 4—figure supplement 3.
Figure 4—figure supplement 3.. CENP-CCD does not impact double Gaussian of single step distribution of CENP-A nucleosomes.
(A) The single (blue line) and double (red line) Gaussian fitting of the x step displacements for CENP-A chromatin +/-CENP CCD. (B) The single (blue line) and double (red line) Gaussian fitting of the y step displacements for CENP-A chromatin +/-CENP CCD. (C) The double Gaussian distribution best fit the x step displacement for both samples. The fraction of D1 and D2 Gaussians are shown, where the D2 Gaussian is most prevalent in most conditions except 1 x and 2 x CENP-CCD. (D) The double Gaussian distribution best fit the y step displacement for both samples. The fraction of D1 and D2 Gaussians are shown, where the D2 Gaussian is most prevalent in most conditions except 2 x APS. The data represent at least three independent technical replicates.
Figure 5.
Figure 5.. CENP-C overexpression suppressed α-satellite expression and centromeric RNAP2 occupancy.
(A) Quantification of RNAP2 levels pulled down with either CENP-C or sequential ACA nChIP. (B) Quantification of CENP-A levels that pulled down with either CENP-C or sequential ACA nChIP. (C) Quantification of consensus α-satellite transcription in mock-transfected (WT) and CENP-C overexpression (CENP-COE) (two-sided t-test; significance was determined at p<0.05). The bar graphs represent three independent technical replicates, and the error bars represent standard deviations.
Figure 5—figure supplement 1.
Figure 5—figure supplement 1.. Representative western blot quantifying RNAP2 and CENP-A levels.
HeLa cells were transfected with an empty vector (WT) or overexpressing CENP-C (CENP-COE) and synchronized to early G1, when centromeric transcription is at its highest, similar to what we reported earlier (Melters et al., 2019 PNAS). We probed for RNAP2, CENP-C, and CENP-A. The western blot is a representative blot of three independent technical replicates with representative original blots shown below.
Figure 6.
Figure 6.. New CENP-A loading impaired upon CENP-C overexpression.
(A) Schematic of experimental design. (B) Colocalized immunofluorescent signals for CENP-A and TMR-Star are collected and the intensity of both foci is measured as well as the background neighboring the foci to determine the ratio of the TMR-star signal over total CENP-A signal. (C) De novo CENP-A incorporation was assessed by quench pulse-chase immunofluorescence. After old CENP-A was quenched with TMR-block, newly loaded CENP-A was stained with TMR-Star and foci intensity was measured over total CENP-A foci intensity. Inset is a ×2 magnification of the dotted box in each respective image. (D) Quantification of de novo CENP-A loading by measuring the ratio of TMR-Star signal over total CENP-A signal (one-way ANOVA; significance was determined at p<0.05, n=number of cells analyzed). The box plots represent three independent technical replicates.
Figure 6—figure supplement 1.
Figure 6—figure supplement 1.. Quantification of de novo CENP-A loading by measuring the ratio of TMR-Star signal over total CENP-A signal as shown in Figure 6C with individual data points.
The box plots represent three independent technical replicates.
Figure 7.
Figure 7.. Clutch model for CENP-C restricted motion of CENP-A chromatin.
Under wildtype conditions, we propose that CENP-A chromatin not bound by CENP-C (yellow box) forms a chromatin clutch and is readily accessible to the transcriptional machinery, because of the intrinsic material properties of CENP-A nucleosomes. In contrast, when CENP-C or CENP-C complexes bind CENP-A nucleosomes, a unique clutch of CENP-A chromatin is formed restricting sliding of CENP-A nucleosomes. This coincides with CENP-CCD altering the material properties, and quenching the mobility, of CENP-A chromatin. Less mobile CENP-A nucleosomes restrict progression of the transcriptional machinery and subsequent loading of new CENP-A molecules.
Author response image 1.
Author response image 2.
Author response image 2.. An example of a failed in vitro reconstitution imaged by conventional in air AFM, where only a few nucleosomes (red arrow) are formed.
CENP-A/H4 tetramers (green arrow) can be easily distinguished from H2A/H2B dimers (pink arrows). In all cases, a nucleosome is much larger in diameter and height than either CENP-A/H4 tetramer or H2A/H2B dimers.
Author response image 3.
Author response image 3.. A side-by-side comparison of the same region that was imaged at two different resolutions and consequently, speeds.
The left image was scanned at the maximum resolution of 744 x 1024 lines & points at 1 frame per 4 seconds. The right image was scanned at 512 x 256 lines & points at 1 frame per second.

Update of

  • doi: 10.1101/2022.01.04.474986

Similar articles

Cited by

References

    1. Ali-Ahmad A, Bilokapić S, Schäfer IB, Halić M, Sekulić N. CENP-C unwraps the human CENP-A nucleosome through the H2A C-terminal tail. EMBO Reports. 2019;20:e48913. doi: 10.15252/embr.201948913. - DOI - PMC - PubMed
    1. Allahverdi A, Chen Q, Korolev N, Nordenskiöld L. Chromatin compaction under mixed salt conditions: opposite effects of sodium and potassium ions on nucleosome array folding. Scientific Reports. 2015;5:8512. doi: 10.1038/srep08512. - DOI - PMC - PubMed
    1. Allshire RC, Madhani HD. Ten principles of heterochromatin formation and function. Nature Reviews. Molecular Cell Biology. 2018;19:229–244. doi: 10.1038/nrm.2017.119. - DOI - PMC - PubMed
    1. Ando T. High-speed atomic force microscopy and its future prospects. Biophysical Reviews. 2018;10:285–292. doi: 10.1007/s12551-017-0356-5. - DOI - PMC - PubMed
    1. Ariyoshi M, Makino F, Watanabe R, Nakagawa R, Kato T, Namba K, Arimura Y, Fujita R, Kurumizaka H, Okumura E-I, Hara M, Fukagawa T. Cryo-EM structure of the CENP-A nucleosome in complex with phosphorylated CENP-C. The EMBO Journal. 2021;40:e105671. doi: 10.15252/embj.2020105671. - DOI - PMC - PubMed

Publication types