. 2023 Sep 20;80(10):298.
doi: 10.1007/s00018-023-04923-4.

Human CD34+-derived complete plasmacytoid and conventional dendritic cell vaccine effectively induces antigen-specific CD8+ T cell and NK cell responses in vitro and in vivo

Affiliations

Human CD34+-derived complete plasmacytoid and conventional dendritic cell vaccine effectively induces antigen-specific CD8+ T cell and NK cell responses in vitro and in vivo

Jesper van Eck van der Sluijs et al. Cell Mol Life Sci. .

Abstract

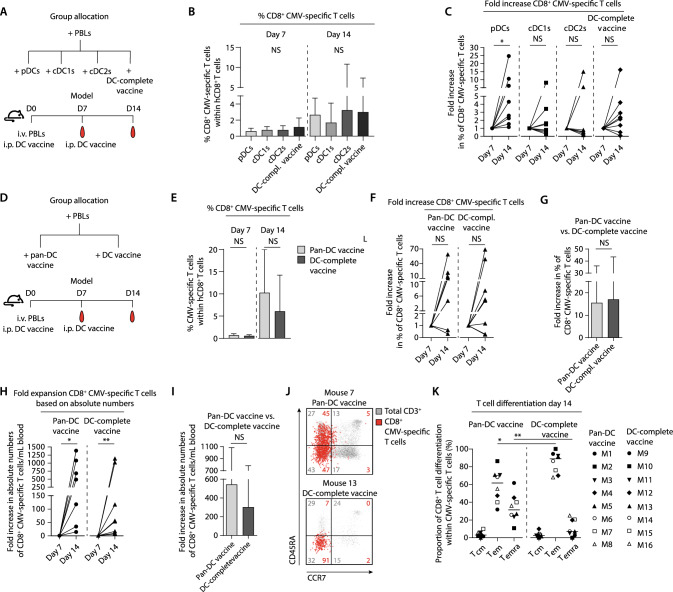
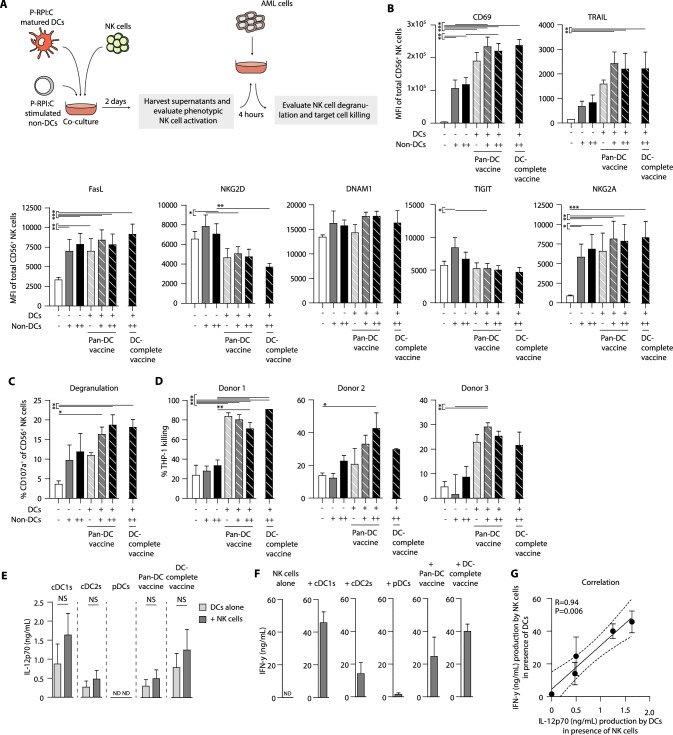
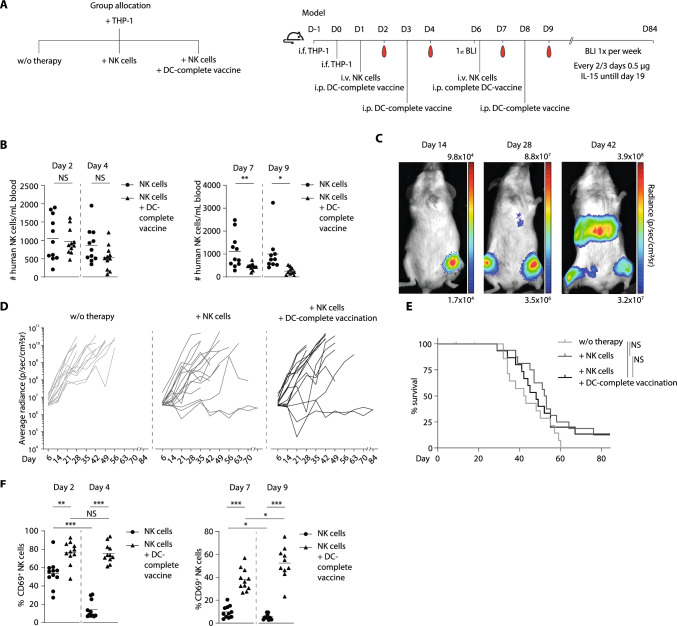
Allogeneic stem cell transplantation (alloSCT) can be curative for hemato-oncology patients due to effective graft-versus-tumor immunity. However, relapse remains the major cause of treatment failure, emphasizing the need for adjuvant immunotherapies. In this regard, post-transplantation dendritic cell (DC) vaccination is a highly interesting strategy to boost graft-versus-tumor responses. Previously, we developed a clinically applicable protocol for simultaneous large-scale generation of end-stage blood DC subsets from donor-derived CD34+ stem cells, including conventional type 1 and 2 DCs (cDC1s and cDC2s), and plasmacytoid DCs (pDCs). In addition, the total cultured end-product (DC-complete vaccine), also contains non-end-stage-DCs (i.e. non-DCs). In this study, we aimed to dissect the phenotypic identity of these non-DCs and their potential immune modulatory functions on the potency of cDCs and pDCs in stimulating tumor-reactive CD8+ T and NK cell responses, in order to obtain rationale for clinical translation of our DC-complete vaccine. The non-DC compartment was heterogeneous and comprised of myeloid progenitors and (immature) granulocyte- and monocyte-like cells. Importantly, non-DCs potentiated toll-like receptor-induced DC maturation, as reflected by increased expression of co-stimulatory molecules and enhanced cDC-derived IL-12 and pDC-derived IFN-α production. Additionally, antigen-specific CD8+ T cells effectively expanded upon DC-complete vaccination in vitro and in vivo. This effect was strongly augmented by non-DCs in an antigen-independent manner. Moreover, non-DCs did not impair in vitro DC-mediated NK cell activation, degranulation nor cytotoxicity. Notably, in vivo i.p. DC-complete vaccination activated i.v. injected NK cells. Together, these data demonstrate that the non-DC compartment potentiates DC-mediated activation and expansion of antigen-specific CD8+ T cells and do not impair NK cell responses in vitro and in vivo. This underscores the rationale for further clinical translation of our CD34+-derived DC-complete vaccine in hemato-oncology patients post alloSCT.

Keywords: CD34+ progenitor cells; Dendritic cells; Immunotherapy; NK cells; T cells; Vaccination.


Conflict of interest statement

The authors declare that they have no competing interests.

Figures

Fig. 1
Fig. 1
Dynamic development of CMP, GMDP, MDP into CDP and end-stage DC subsets. a Schematic overview of our culture system, including specification of the flow cytometry panels used to characterize the developmental process. All experiments were performed for three independent donors (n = 3). b Fish plot (mean percentage) visualizing the culture dynamics over time. c Fish plot (mean percentage) and d representative flow cytometry plots displaying differentiation within the CD34+ progenitor cell compartment over time by manual gating of the stem cell panel (Fig. S2). Colors indicated in the hematopoietic tree represent the colors in the fish plot. e Balloon plot displaying marker expression (percentage positivity and MFI of positive cells) within 19 hierarchically ordered FlowSOM metaclusters of the DC panel. f Frequency of annotated metaclusters obtained with the DC panel, over time, presented in box plots. Total frequency per DC subset at the end of culture is displayed in a stacked histogram. Data is shown as mean ± SEM. DC dendritic cell; non-DC, non-end-stage DC, HSC Hematopoietic Stem Cell, MPP Multipotent Progenitor, LMPP Lymphoid-Myeloid Primed Progenitor, CLP Common Lymphoid Progenitor, CMP Common Myeloid Progenitor, MEP Megakaryocyte Erythrocyte Progenitor, GMDP Granulocyte Monocyte Dendritic cell Progenitor, MDP Monocyte Dendritic Cell Restricted Progenitor, CDP Common Dendritic Cell Progenitor, MON monocytes, GR granulocytes, MFI median fluorescence intensity
Fig. 2
Fig. 2
The non-DC compartment is comprised of a heterogenous mixture of (immature) granulocyte-, monocyte- and myeloid-like cells. The non-DC panel was used to investigate the non-DC fraction in three independent donors (n = 3) a Minimal spanning tree (MST) showing 100 nodes with allocated metaclusters (shaded background) and average abundance at day 14 of the culture system. b Relative expression of each marker within every FlowSOM node plotted on the MST. Low expression does not equal marker negativity, scaling was performed per marker. c Balloon plot representing marker expression (percentage positivity and MFI of positive cells) within the 20 FlowSOM metaclusters, including cell type annotation (non-DCs in blue) and relative abundance per donor. d Pie chart visualizing the composition of the DC-complete vaccine (mean of each group of FlowSOM metaclusters). MFI median fluorescence intensity, DC dendritic cell, cDC conventional dendritic cell, pDC plasmacytoid dendritic cell
Fig. 3
Fig. 3
Non-DC have no negative effect on pan-TLR induced functional maturation of cDCs and pDCs. a Schematic overview visualizing the different vaccine strategies, including the DC-complete vaccine, sorted cDC1, cDC2, pDC and non-DC vaccines, and the Pan-DC vaccine which is generated by re-mixing cDC1s, cDC2s and pDCs according to the natural composition in the DC-complete vaccine. All experiments were performed with 3 independent donors. b–e Expression of co-stimulatory molecules CD80, CD83 and CD86 on unstimulated, RPI:C or CpG-P stimulated and P-RPI:C stimulated cDC2s b, pDCs (c), cDC1s d and non-DCs e as represented in balloon plots showing the frequency of positive cells (size of the balloon) and the MFI (color intensity). Asterisks at the upper left corner of the balloons represent statistically significant differences in iMFI of TLR stimulated cells versus unstimulated cells. Asterisks below indicated lines represent statistically significant differences for P-RPI:C stimulated cells within the different vaccine strategies per respective end-stage DC subset. Data is shown as mean ± SEM. f–g Release of pro-inflammatory cytokines IL-12p70 per potential IL-12p70 producing cell (total µg produced / total number of cells excluding pDCs) f and IFN-α per IFN-α producing cell (total µg produced / number of pDCs) g upon RPI:C/CpG-P and P-RPI:C stimulation of the different vaccine strategies. Data is shown as mean ± SEM. Statistical analyses were performed using repeated measures one-way ANOVA followed by Bonferroni correction comparing all pairs of columns b–e or using a non-parametric paired T-test f–g. *P < 0.05, **P < 0.01, ***P < 0.001. iMFI, integrated median fluorescence intensity; P-RPI:C, CpG-P + R848 + Poly I:C; cDC, conventional dendritic cell; pDC, plasmacytoid dendritic cell; non-DCs, non-end-stage dendritic cells; MFI, median fluorescence intensity; SEM, standard error of the mean
Fig. 4
Fig. 4
Non-DC strongly augmented DC-mediated antigen-specific T cell expansion in an antigen-independent manner. Assays were performed for 5 different experiments to assess CMV- (n = 3; b, e, h, i) or HA1-specific (n = 2; f) memory CD8+ T cell expansion potential of the different vaccination strategies. a Schematic overview of CMV-specific CD8+ T cell expansion upon stimulation with mature peptide-pulsed DC in the presence/absence of TLR-stimulated non-DCs pulsed with peptide. b Fold expansion of CMV-specific CD8+ T cells upon 7 day co-culture. Representative data of one independent donor is shown. c Schematic overview of antigen-specific CD8+ T cell expansion upon stimulation with mature peptide-pulsed DC in the presence/absence of TLR-stimulated non-DCs pulsed with/without peptide. d–f Representative CMV-tetramer flow cytometry plots d and relative fold expansion of CMV-specific CD8+ T cells of a second independent donor e and of HA-1-specific CD8+ T cells of 2 independent patients f. HA-1 assay: the DC:non-DC ratio was equal to the natural composition in the DC-complete vaccine. g Schematic overview of the transwell assay to examine the impact of (in)direct presence of non-DCs on DC-mediated CMV-specific CD8+ T cell expansion. h Fold expansion of CMV-specific CD8+ T cells upon mature peptide-pulsed DC stimulation in the presence of direct (full bars) or indirect exposure to TLR-stimulated non-DCs (striped bars). i Representative histogram of a third independent donor showing CMV-specific CD8+ T proliferation upon stimulation with cDC1s in the absence/presence of (non)-peptide-pulsed non-DCs. Unstimulated total CD8 + T cells were used as a negative control for CFSE-dilution. DC dendritic cell, cDC conventional dendritic cell, pDC plasmacytoid dendritic cell, non-DC non-end-stage dendritic cell, P-RPI:C, CpG-P + R848 + Poly I:C, CMV cytomegalovirus, CFSE carboxyfluorescein succinimidyl ester
Fig. 5
Fig. 5
In vivo vaccination with CD34+-derived DCs effectively induces expansion of antigen-specific CD8+ T cells. a, d Schematic overview of group allocation and experimental setup of in vivo model 1 and model 2. PBLs containing CMV-specific CD8+ T cells were i.v. injected at day 0 (model 1: 20 × 106 PBLs, containing ~ 50,000 CMV-specific CD8+ T cells, 1.0% of CD8+ T cells, n = 8 mice per group; model 2: 12.5 × 106 PBLs, containing ~ 37,500 CMV-specific CD8+ T cells, 0.8% of CD8+ T cells, n = 8 mice per group), followed by treatment with vaccines containing 0.5 × 106 mature peptide-pulsed end-stage DCs at day 0 and 7. b, e Frequencies of CMV-specific CD8+ T cells within human CD8+ T cells at day 7 and 14 after DC vaccination (mean ± SD). c, f–g Fold increase of % CMV-specific CD8+ T cells and h, i absolute numbers of CMV-specific CD8+ T cells upon DC vaccination. j Representative dot plots and k combined data of T cell differentiation status (Tcm (CD45RACCR7+), Tem (CD45RACCR7) and Temra (CD45RA+CCR7)) upon pan-DC and DC-complete vaccination. Numbers in the FACS plots indicate the percentage Tn, Tcm, Tem and Temra within the CMV-specific CD8+ T cells. Statistical analysis was performed using a Kruskal–Wallis test followed by Dunn’s multiple comparisons test b, non-parametric paired T-test c, f, h, non-parametric unpaired T-test e, g, j, only comparing pan-DC versus DC-complete vaccine for all memory T cell subsets j. *P < 0.05, **P < 0.01. PBL peripheral blood lymphocytes, DC dendritic cell, cDC conventional dendritic cell, pDC plasmacytoid dendritic cell, i.v. intravenous, i.p. intraperitoneally, CMV cytomegalovirus, NS non-significant, Tcm central memory T cells, Tem effector memory T cells, Temra terminally differentiated effector memory T cells. to initiate tumor cell killing (Figs. 6c–d. S7a-c). Notably, the inclusion of cDCs/pDCs further enhanced the NK cell degranulation capacity and effectively induced NK cell-mediated tumor reactivity. Correspondingly, the DC-complete vaccine induced effective phenotypic and functional NK cell activation (Fig. 6b–d)
Fig. 6
Fig. 6
DC-mediated NK cell activation and cytolytic capacity is not hampered by the presence of non-DC. a Schematic overview of experimental setup. Mature DCs were co-cultured with healthy donor NK cells (DC-NK cell ratio 1:1) in the absence or presence of P-RPI:C stimulated non-DCs (DC:non-DC ratio 1:1 or 1:2) for 2 days. Subsequently, THP-1 cells were added for 4 h. NK cell assays were performed for multiple independent donors (n = 4 in b; n = 3 in c-g). b MFI of activating and inhibitory molecules on NK cells after 2 days of DC-NK cell co-culture (mean ± SEM). c Degranulation of DC-activated NK cells in the absence or presence of TLR-stimulated non-DCs upon 4 h exposure to THP-1 cells (mean ± SEM). d Killing of CFSE-labeled THP-1 cells by DC-activated NK cells in the absence or presence of TLR-stimulated non-DCs (mean ± SD). e–f Release of pro-inflammatory cytokine IL-12p70 e and IFN- γ f by NK cells after 2 day co-culture with the different DC vaccines (mean ± SEM). g Correlation of IL-12p70 and IFN-γ production during DC-NK cell co-cultures (mean ± SEM). Statistical analyses was performed using a repeated measures one-way ANOVA followed by Bonferroni correction comparing selected pairs of means b–c, an one-way ANOVA followed by Bonferroni correction comparing selected pairs of means d, paired T-tests e and a Pearson correlation g. *P < 0.05, **P < 0.01, ***P < 0.001. ND, not detectable. DC dendritic cell, NK cell natural killer cells, cDC conventional dendritic cell, pDC plasmacytoid dendritic cell; non-DC, non-end-stage dendritic cell, P-RPI:C CpG-P + R848 + Poly I:C, CFSE carboxyfluorescein succinimidyl ester, SEM standard error of the mean, MFI median fluorescence intensity
Fig. 7
Fig. 7
In vivo DC-complete vaccination strongly boosted and effectively retained phenotypic NK cell activation. a Schematic overview of group allocation and experimental setup of in vivo NK cell model. Mice were i.f. injected with 2 × 104 LucGFP THP-1 cells, followed by two i.v. NK cell infusions (3 × 106) or PBS as control and four i.p. treatments with DC-complete vaccine (0.5 × 106 end-stage-DCs) or PBS as control (n = 14–16 mice per group, with n = 11 mice per group per time-point for phenotype analysis (b, f) due to welfare restrictions in blood volume withdrawal). b Absolute numbers of human NK cells per mL blood at day 2 and 4 (after 1st NK cell injection) or day 7 and 9 (after 2nd NK cell injection). c Example of metastasis formation after i.f. tumor injection in the left hind leg. d BLI results from each individual mouse and e survival of all three treatment groups. f Percentage of CD69 positive NK cells at day 2 and 4 (after 1st NK cell injection) and day 7 and 9 (after 2nd NK cell injection). Statistical analyses was performed using non-parametric unpaired T-tests b–f and Log-rank (Mantel-Cox) test e*P < 0.05, **P < 0.01,***P < 0.001. NK cell natural killer cell, BLI bioluminescence imaging, i.f. intrafemoral, Luc luciferase, GFP green fluorescent protein

Similar articles

Cited by

References

    1. de Lima M, et al. Proceedings from the National Cancer Institute's Second International Workshop on the Biology, Prevention, and Treatment of Relapse After Hematopoietic Stem Cell Transplantation: part III. Prevention and treatment of relapse after allogeneic transplantation. Biol Blood Marrow Transpl. 2014;20(1):4–13. doi: 10.1016/j.bbmt.2013.08.012. - DOI - PMC - PubMed
    1. Avigan D, et al. Proceedings from the National Cancer Institute's Second International Workshop on the Biology, Prevention, and Treatment of Relapse after Hematopoietic Stem Cell Transplantation: part II. Autologous Transplantation-novel agents and immunomodulatory strategies. Biol Blood Marrow Transpl. 2013;19(12):1661–1669. doi: 10.1016/j.bbmt.2013.08.011. - DOI - PMC - PubMed
    1. Zhou M, Sacirbegovic F, Zhao K, Rosenberger S, Shlomchik WD T cell exhaustion and a failure in antigen presentation drive resistance to the graft-versus-leukemia effect, Nat Commun, 11(1): 4227, Aug 24 2020, 10.1038/s41467-020-17991-y. - PMC - PubMed
    1. Perez CR, De Palma M Engineering dendritic cell vaccines to improve cancer immunotherapy. Nat Commun, 10(1): 5408, Nov 27 2019, 10.1038/s41467-019-13368-y. - PMC - PubMed
    1. Van Acker HH et al. (2019) Dendritic Cell-Based Immunotherapy of Acute Myeloid Leukemia J Clin Med, 8(5), 10.3390/jcm8050579. - PMC - PubMed

Supplementary concepts